NLRB Stats Archive › Annual Reports › FY1971 › Distribution of Unfair Labor Practice Situations Received, by Number of Employees in Establishment, Fiscal Year 1971
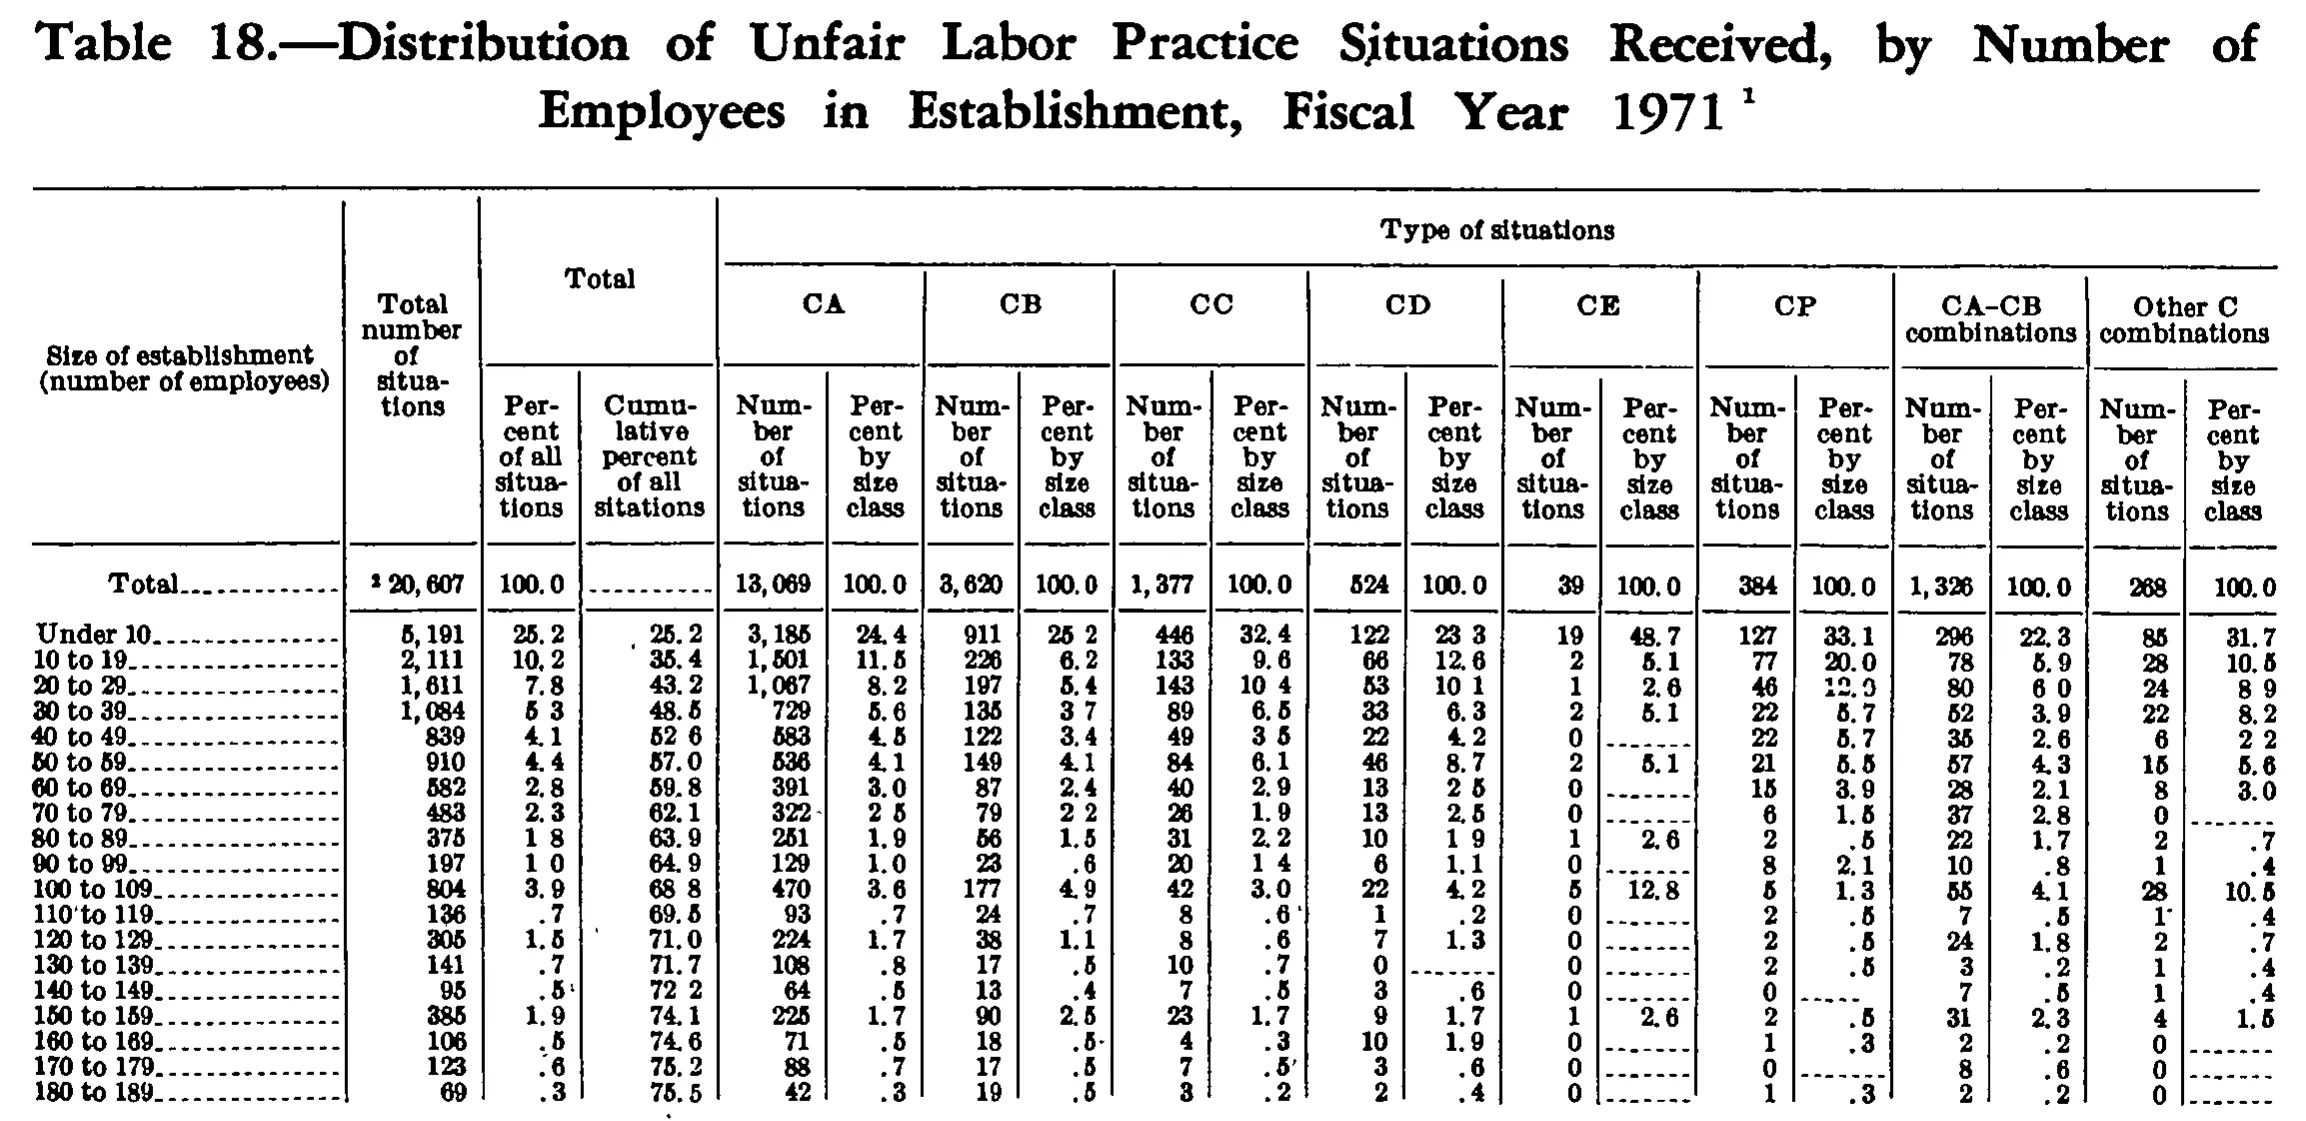
Distribution of Unfair Labor Practice Situations Received, by Number of Employees in Establishment, Fiscal Year 1971
Stitched from pp. 203–204.
| Size of establishment (number of employees) | Total number of situations | Total | Type of situations | ||||||||||||||||
|---|---|---|---|---|---|---|---|---|---|---|---|---|---|---|---|---|---|---|---|
| Size of establishment (number of employees) | Total number of situations | Total | CA | CB | CC | CD | CE | CP | CA-CB combinations | Other C combinations | |||||||||
| Size of establishment (number of employees) | Total number of situations | Percent of all situations | Cumulative percent of all sitations | Number of situations | Percent by size class | Number of situations | Percent by size class | Number of situations | Percent by size class | Number of situations | Percent by size class | Number of situations | Percent by size class | Number of situations | Percent by size class | Number of situations | Percent by size class | Number of situations | Percent by size class |
| Total | 20,607 | 100.0 | 13,069 | 100.0 | 3,620 | 100.0 | 1,377 | 100.0 | 524 | 100.0 | 39 | 100.0 | 384 | 100.0 | 1,326 | 100.0 | 268 | 100.0 | |
| Under 10 | 5,191 | 25.2 | 25.2 | 3,185 | 24.4 | 911 | 25.2 | 446 | 32.4 | 122 | 23.3 | 19 | 48.7 | 127 | 33.1 | 296 | 22.3 | 85 | 31.7 |
| 10 to 19 | 2,111 | 10.2 | 35.4 | 1,501 | 11.5 | 226 | 6.2 | 133 | 9.6 | 66 | 12.6 | 2 | 5.1 | 77 | 20.0 | 78 | 5.9 | 28 | 10.5 |
| 20 to 29 | 1,611 | 7.8 | 43.2 | 1,067 | 8.2 | 197 | 5.4 | 143 | 10.4 | 53 | 10.1 | 1 | 2.6 | 46 | 12.0 | 80 | 6.0 | 24 | 8.9 |
| 30 to 39 | 1,084 | 5.3 | 48.5 | 729 | 5.6 | 135 | 3.7 | 89 | 6.5 | 33 | 6.3 | 2 | 5.1 | 22 | 5.7 | 52 | 3.9 | 22 | 8.2 |
| 40 to 49 | 839 | 4.1 | 52.6 | 583 | 4.5 | 122 | 3.4 | 49 | 3.5 | 22 | 4.2 | 0 | 22 | 5.7 | 35 | 2.6 | 6 | 2.2 | |
| 50 to 59 | 910 | 4.4 | 57.0 | 536 | 4.1 | 149 | 4.1 | 84 | 6.1 | 46 | 8.7 | 2 | 5.1 | 21 | 5.5 | 57 | 4.3 | 15 | 5.6 |
| 60 to 69 | 582 | 2.8 | 59.8 | 391 | 3.0 | 87 | 2.4 | 40 | 2.9 | 13 | 2.5 | 0 | 15 | 3.9 | 28 | 2.1 | 8 | 3.0 | |
| 70 to 79 | 483 | 2.3 | 62.1 | 322 | 2.5 | 79 | 2.2 | 26 | 1.9 | 13 | 2.5 | 0 | 6 | 1.5 | 37 | 2.8 | 0 | ||
| 80 to 89 | 375 | 1.8 | 63.9 | 251 | 1.9 | 56 | 1.5 | 31 | 2.2 | 10 | 1.9 | 1 | 2.6 | 2 | .5 | 22 | 1.7 | 2 | .7 |
| 90 to 99 | 197 | 1.0 | 64.9 | 129 | 1.0 | 23 | .6 | 20 | 1.4 | 6 | 1.1 | 0 | 8 | 2.1 | 10 | .8 | 1 | .4 | |
| 100 to 109 | 804 | 3.9 | 68.8 | 470 | 3.6 | 177 | 4.9 | 42 | 3.0 | 22 | 4.2 | 5 | 12.8 | 5 | 1.3 | 55 | 4.1 | 28 | 10.5 |
| 110 to 119 | 136 | .7 | 69.5 | 93 | .7 | 24 | .7 | 8 | .6 | 1 | .2 | 0 | 2 | .5 | 7 | .5 | 1 | .4 | |
| 120 to 129 | 305 | 1.5 | 71.0 | 224 | 1.7 | 38 | 1.1 | 8 | .6 | 7 | 1.3 | 0 | 2 | .5 | 24 | 1.8 | 2 | .7 | |
| 130 to 139 | 141 | .7 | 71.7 | 108 | .8 | 17 | .5 | 10 | .7 | 0 | 0 | 2 | .5 | 3 | .2 | 1 | .4 | ||
| 140 to 149 | 95 | .5 | 72.2 | 64 | .5 | 13 | .4 | 7 | .5 | 3 | .6 | 0 | 0 | 7 | .5 | 1 | .4 | ||
| 150 to 159 | 385 | 1.9 | 74.1 | 225 | 1.7 | 90 | 2.5 | 23 | 1.7 | 9 | 1.7 | 1 | 2.6 | 2 | .5 | 31 | 2.3 | 4 | 1.5 |
| 160 to 169 | 106 | .5 | 74.6 | 71 | .5 | 18 | .5 | 4 | .3 | 10 | 1.9 | 0 | 1 | .3 | 2 | .2 | 0 | ||
| 170 to 179 | 123 | .6 | 75.2 | 88 | .7 | 17 | .5 | 7 | .5 | 3 | .6 | 0 | 0 | 8 | .6 | 0 | |||
| 180 to 189 | 69 | .3 | 75.5 | 42 | .3 | 19 | .5 | 3 | .2 | 2 | .4 | 0 | 1 | .3 | 2 | .2 | 0 | ||
| 190 to 199 | 35 | .2 | 75.7 | 27 | .2 | 4 | .1 | 2 | .2 | 0 | 0 | 0 | 1 | .1 | 1 | .4 | |||
| 200 to 299 | 1,122 | 5.4 | 81.1 | 713 | 5.4 | 246 | 6.8 | 45 | 3.3 | 27 | 5.1 | 0 | 5 | 1.3 | 76 | 5.7 | 10 | 3.7 | |
| 300 to 399 | 668 | 3.2 | 84.3 | 439 | 3.4 | 139 | 3.8 | 25 | 1.8 | 8 | 1.5 | 1 | 2.6 | 5 | 1.3 | 41 | 3.1 | 10 | 3.7 |
| 400 to 499 | 368 | 1.8 | 86.1 | 224 | 1.7 | 83 | 2.3 | 12 | .9 | 4 | .8 | 0 | 2 | .5 | 42 | 3.2 | 1 | .4 | |
| 500 to 599 | 366 | 1.8 | 87.9 | 209 | 1.6 | 89 | 2.5 | 11 | .8 | 7 | 1.3 | 0 | 1 | .3 | 47 | 3.5 | 2 | .7 | |
| 600 to 699 | 229 | 1.1 | 89.0 | 143 | 1.1 | 47 | 1.3 | 12 | .9 | 2 | .4 | 0 | 1 | .3 | 21 | 1.6 | 3 | 1.1 | |
| 700 to 799 | 137 | .7 | 89.7 | 84 | .6 | 34 | .9 | 8 | .6 | 2 | .4 | 0 | 0 | 8 | .6 | 1 | .4 | ||
| 800 to 899 | 142 | .7 | 90.4 | 93 | .7 | 30 | .8 | 4 | .3 | 0 | 1 | 2.6 | 0 | 14 | 1.1 | 0 | |||
| 900 to 999 | 72 | .3 | 90.7 | 41 | .3 | 19 | .5 | 3 | .2 | 4 | .8 | 0 | 0 | 5 | .4 | 0 | |||
| 1,000 to 1,999 | 696 | 3.4 | 94.1 | 397 | 3.0 | 151 | 4.2 | 45 | 3.3 | 16 | 3.0 | 3 | 7.6 | 2 | .5 | 75 | 5.7 | 7 | 2.6 |
| 2,000 to 2,999 | 315 | 1.5 | 95.6 | 171 | 1.3 | 92 | 2.5 | 12 | .9 | 4 | .8 | 0 | 1 | .3 | 34 | 2.6 | 1 | .4 | |
| 3,000 to 3,999 | 239 | 1.2 | 96.8 | 109 | .8 | 86 | 2.4 | 5 | .4 | 3 | .6 | 0 | 0 | 36 | 2.7 | 0 | |||
| 4,000 to 4,999 | 97 | .5 | 97.3 | 47 | .4 | 32 | .9 | 1 | .1 | 0 | 0 | 1 | .3 | 16 | 1.2 | 0 | |||
| 5,000 to 9,999 | 255 | 1.2 | 98.5 | 141 | 1.1 | 64 | 1.8 | 9 | .6 | 4 | .8 | 0 | 0 | 36 | 2.7 | 1 | .4 | ||
| Above 9,999 | 319 | 1.5 | 100.0 | 152 | 1.2 | 106 | 2.9 | 10 | .7 | 2 | .4 | 1 | 2.6 | 5 | 1.3 | 40 | 3.0 | 3 | 1.1 |
273 of 273 figures sit in a row or column sum that works out.
Reader’s notes
p. 203. Grid is 20 columns: stub; Total number of situations; Total (Percent of all situations, Cumulative percent); then Number/Percent pairs for CA, CB, CC, CD, CE, CP, CA-CB combinations, Other C combinations. Crop coverage: the body is cut off after the "180 to 189" row (that row sits on the bottom edge but is legible); larger size classes and any footnote text continue below the crop, so `footnotes` is empty even though markers appear on the page (a raised 1 on the caption, which is excluded, and a raised 2 on the Total row's total-number cell, transcribed as 20,607^2). Doubtful cell: CP "Percent by size class" for row "20 to 29" — the glyph after "12." is ink-damaged and could be read as 9 or 0. Transcribed as 12.0 because 46/384 = 12.0 and because the printed CP percent column then sums to 93.9 against 361/384 = 94.0 (a 12.9 reading would overshoot the column total). Flagging in case the original truly reads 12.9. Header wording: the fourth column's last line appears to be printed "sitations" (missing the u) rather than "situations"; transcribed as seen — it may also be scan damage. Faint decimal points: this scan drops or thins many decimal points (e.g. "25 2" for Under 10 / CB percent, "23 3" for Under 10 / CD percent, "52 6" for 40 to 49 / Cumulative percent). These are printed decimals and are written with a period throughout. Zero rows: where a Number cell is 0 the matching Percent cell holds a dash rule, transcribed as "" (CE for 40 to 49, 60 to 69, 70 to 79, 90 to 99, 110 to 119 through 140 to 149, 160 to 169 through 180 to 189; CD for 130 to 139; CP for 140 to 149 and 170 to 179; Other C for 70 to 79, 160 to 169, 170 to 179, 180 to 189). The Total row's Cumulative percent cell holds leader dots and is "". Verification: every Number column's printed entries sum to a share of its printed column total that matches the sum of that column's printed percents (e.g. CA 10,079/13,069 = 77.1 vs 77.2 printed sum; CD 441/524 = 84.2 vs 84.1; Other C 228/268 = 85.1 vs 85.1), and the cumulative-percent column reproduces the running sum of the percent-of-all column down to 75.5. Small gaps are the table's own truncation of some percents (e.g. 133/1,377 = 9.66 printed as 9.6; 49/1,377 = 3.56 printed as 3.5); these are transcribed as printed, not corrected.
p. 204. CROP SCOPE: this is the tail of a table continued from the preceding page. No column headings, caption, footnotes or stub heading appear on the image, so header_rows and footnotes are empty; nothing was reconstructed. The body is cut off at the top (the size brackets below "190 to 199" are on the prior page). The double rule under "Above 9,999" is the table's closing rule, and no footnote text follows it on this crop. COLUMN COUNT: 20 columns total = stub + 19 data columns. The layout is one count/percent/cumulative-percent triple (cols 1-3), then eight count/percent pairs (cols 4-5, 6-7, 8-9, 10-11, 12-13, 14-15, 16-17, 18-19). Single-panel table, not side-by-side panels. DASH RULES: every cell printed as a dash rule (------) is given as "" per instruction; these all sit in a percent column whose paired count cell is a printed 0, which is kept as 0. SCAN QUALITY / DOUBTFUL CELLS (this scan renders 3 with a filled bowl that reads as 8, and 5 that can read as 6): - Row "600 to 699", 4th data column: the glyph reads as "148" at this resolution, but the final digit is degraded. I transcribed 143. Reason: in all 14 other rows, col 1 = col 4 + (cols 6+8+10+12+14+16+18) exactly; here 143 + 86 = 229 matches the printed 229, whereas 148 would require col 1 to be 234. Every component of the 86 is independently pinned by its own printed percent. Flagging as the single least certain numeric cell on the page; if verifying against a cleaner scan, check this cell first. - Row "4,000 to 4,999", 17th data column: the decimal point is broken, printing as "1 2". Transcribed as 1.2 (consistent with 16 of ~1,336 = 1.2%). - Rows "900 to 999" (col 2) and "2,000 to 2,999" (col 5): the glyphs read as ".8" and "1.8" but are .3 and 1.3 — confirmed by the cumulative column (90.4 + .3 = 90.7) and by 171/~13,200 = 1.3%. - Row labels "300 to 399" and "3,000 to 3,999" show the same 3-as-8 artifact in their leading digit; transcribed as 3 on the evidence of the surrounding bracket sequence. - Row "190 to 199", 9th data column: printed .2, which is slightly high against the implied column base (2 of ~1,385 = .14%). Transcribed as printed; likely original rounding, not a reading error. No arithmetic was performed on or substituted into any cell; the checks above were used only to choose between competing readings of degraded glyphs.
Source image

Source data: U.S. NLRB Annual Reports (public domain). Reconstruction by NLRB Stats Archive. Read by claude-opus-5 (effort max, prompt extract_v1) from the 300-dpi scan; stitched by page. Updated October 2026.