NLRB Stats Archive › Annual Reports › FY1971 › Size of Units in Representation Election Cases Closed, Fiscal Year 1971
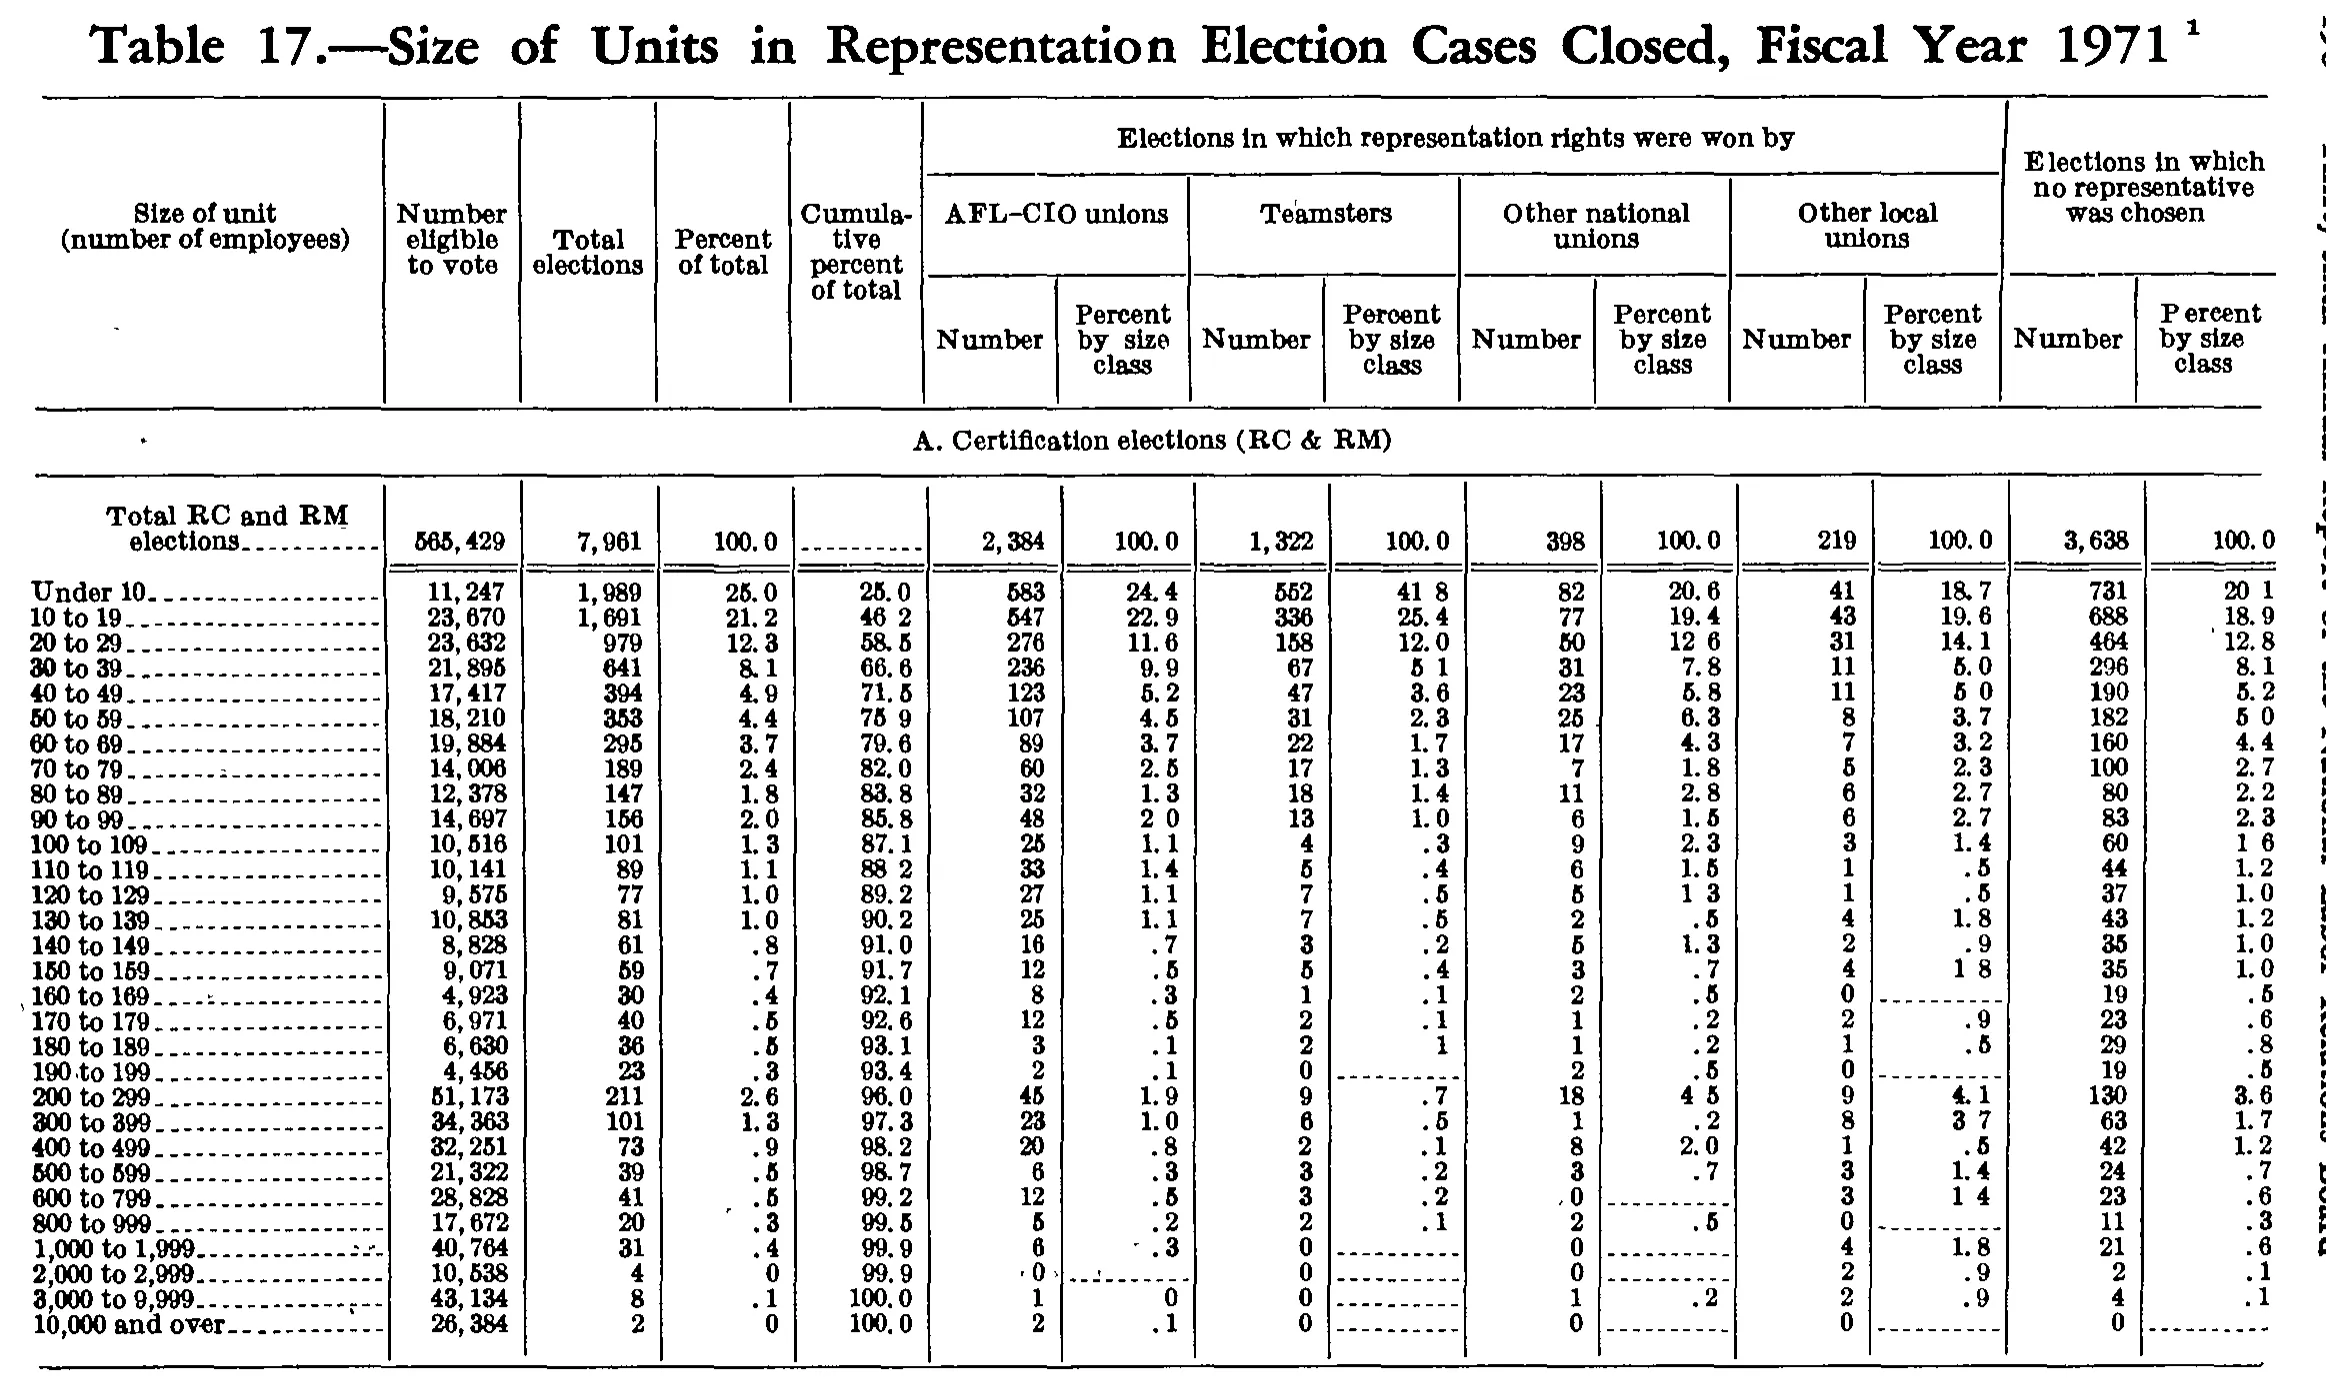
Size of Units in Representation Election Cases Closed, Fiscal Year 1971
Stitched from pp. 201–202.
| Size of unit (number of employees) | Number eligible to vote | Total elections | Percent of total | Cumulative percent of total | Elections in which representation rights were won by | Elections in which no representative was chosen | ||||||||
|---|---|---|---|---|---|---|---|---|---|---|---|---|---|---|
| Size of unit (number of employees) | Number eligible to vote | Total elections | Percent of total | Cumulative percent of total | AFL-CIO unions | Teamsters | Other national unions | Other local unions | Elections in which no representative was chosen | |||||
| Size of unit (number of employees) | Number eligible to vote | Total elections | Percent of total | Cumulative percent of total | Number | Percent by size class | Number | Percent by size class | Number | Percent by size class | Number | Percent by size class | Number | Percent by size class |
| A. Certification elections (RC & RM) | ||||||||||||||
| Total RC and RM elections | 565,429 | 7,961 | 100.0 | 2,384 | 100.0 | 1,322 | 100.0 | 398 | 100.0 | 219 | 100.0 | 3,638 | 100.0 | |
| Under 10 | 11,247 | 1,989 | 25.0 | 25.0 | 583 | 24.4 | 552 | 41.8 | 82 | 20.6 | 41 | 18.7 | 731 | 20.1 |
| 10 to 19 | 23,670 | 1,691 | 21.2 | 46.2 | 547 | 22.9 | 336 | 25.4 | 77 | 19.4 | 43 | 19.6 | 688 | 18.9 |
| 20 to 29 | 23,632 | 979 | 12.3 | 58.5 | 276 | 11.6 | 158 | 12.0 | 50 | 12.6 | 31 | 14.1 | 464 | 12.8 |
| 30 to 39 | 21,895 | 641 | 8.1 | 66.6 | 236 | 9.9 | 67 | 5.1 | 31 | 7.8 | 11 | 5.0 | 296 | 8.1 |
| 40 to 49 | 17,417 | 394 | 4.9 | 71.5 | 123 | 5.2 | 47 | 3.6 | 23 | 5.8 | 11 | 5.0 | 190 | 5.2 |
| 50 to 59 | 18,210 | 353 | 4.4 | 75.9 | 107 | 4.5 | 31 | 2.3 | 25 | 6.3 | 8 | 3.7 | 182 | 5.0 |
| 60 to 69 | 19,884 | 295 | 3.7 | 79.6 | 89 | 3.7 | 22 | 1.7 | 17 | 4.3 | 7 | 3.2 | 160 | 4.4 |
| 70 to 79 | 14,006 | 189 | 2.4 | 82.0 | 60 | 2.5 | 17 | 1.3 | 7 | 1.8 | 5 | 2.3 | 100 | 2.7 |
| 80 to 89 | 12,378 | 147 | 1.8 | 83.8 | 32 | 1.3 | 18 | 1.4 | 11 | 2.8 | 6 | 2.7 | 80 | 2.2 |
| 90 to 99 | 14,697 | 156 | 2.0 | 85.8 | 48 | 2.0 | 13 | 1.0 | 6 | 1.5 | 6 | 2.7 | 83 | 2.3 |
| 100 to 109 | 10,516 | 101 | 1.3 | 87.1 | 25 | 1.1 | 4 | .3 | 9 | 2.3 | 3 | 1.4 | 60 | 1.6 |
| 110 to 119 | 10,141 | 89 | 1.1 | 88.2 | 33 | 1.4 | 5 | .4 | 6 | 1.5 | 1 | .5 | 44 | 1.2 |
| 120 to 129 | 9,575 | 77 | 1.0 | 89.2 | 27 | 1.1 | 7 | .5 | 5 | 1.3 | 1 | .5 | 37 | 1.0 |
| 130 to 139 | 10,853 | 81 | 1.0 | 90.2 | 25 | 1.1 | 7 | .5 | 2 | .5 | 4 | 1.8 | 43 | 1.2 |
| 140 to 149 | 8,828 | 61 | .8 | 91.0 | 16 | .7 | 3 | .2 | 5 | 1.3 | 2 | .9 | 35 | 1.0 |
| 150 to 159 | 9,071 | 59 | .7 | 91.7 | 12 | .5 | 5 | .4 | 3 | .7 | 4 | 1.8 | 35 | 1.0 |
| 160 to 169 | 4,923 | 30 | .4 | 92.1 | 8 | .3 | 1 | .1 | 2 | .5 | 0 | 19 | .5 | |
| 170 to 179 | 6,971 | 40 | .5 | 92.6 | 12 | .5 | 2 | .1 | 1 | .2 | 2 | .9 | 23 | .6 |
| 180 to 189 | 6,630 | 36 | .5 | 93.1 | 3 | .1 | 2 | .1 | 1 | .2 | 1 | .5 | 29 | .8 |
| 190 to 199 | 4,456 | 23 | .3 | 93.4 | 2 | .1 | 0 | 2 | .5 | 0 | 19 | .5 | ||
| 200 to 299 | 51,173 | 211 | 2.6 | 96.0 | 45 | 1.9 | 9 | .7 | 18 | 4.5 | 9 | 4.1 | 130 | 3.6 |
| 300 to 399 | 34,363 | 101 | 1.3 | 97.3 | 23 | 1.0 | 6 | .5 | 1 | .2 | 8 | 3.7 | 63 | 1.7 |
| 400 to 499 | 32,251 | 73 | .9 | 98.2 | 20 | .8 | 2 | .1 | 8 | 2.0 | 1 | .5 | 42 | 1.2 |
| 500 to 599 | 21,322 | 39 | .5 | 98.7 | 6 | .3 | 3 | .2 | 3 | .7 | 3 | 1.4 | 24 | .7 |
| 600 to 799 | 28,828 | 41 | .5 | 99.2 | 12 | .5 | 3 | .2 | 0 | 3 | 1.4 | 23 | .6 | |
| 800 to 999 | 17,672 | 20 | .3 | 99.5 | 5 | .2 | 2 | .1 | 2 | .5 | 0 | 11 | .3 | |
| 1,000 to 1,999 | 40,764 | 31 | .4 | 99.9 | 6 | .3 | 0 | 0 | 4 | 1.8 | 21 | .6 | ||
| 2,000 to 2,999 | 10,538 | 4 | 0 | 99.9 | 0 | 0 | 0 | 2 | .9 | 2 | .1 | |||
| 3,000 to 9,999 | 43,134 | 8 | .1 | 100.0 | 1 | 0 | 0 | 1 | .2 | 2 | .9 | 4 | .1 | |
| 10,000 and over | 26,384 | 2 | 0 | 100.0 | 2 | .1 | 0 | 0 | 0 | 0 | ||||
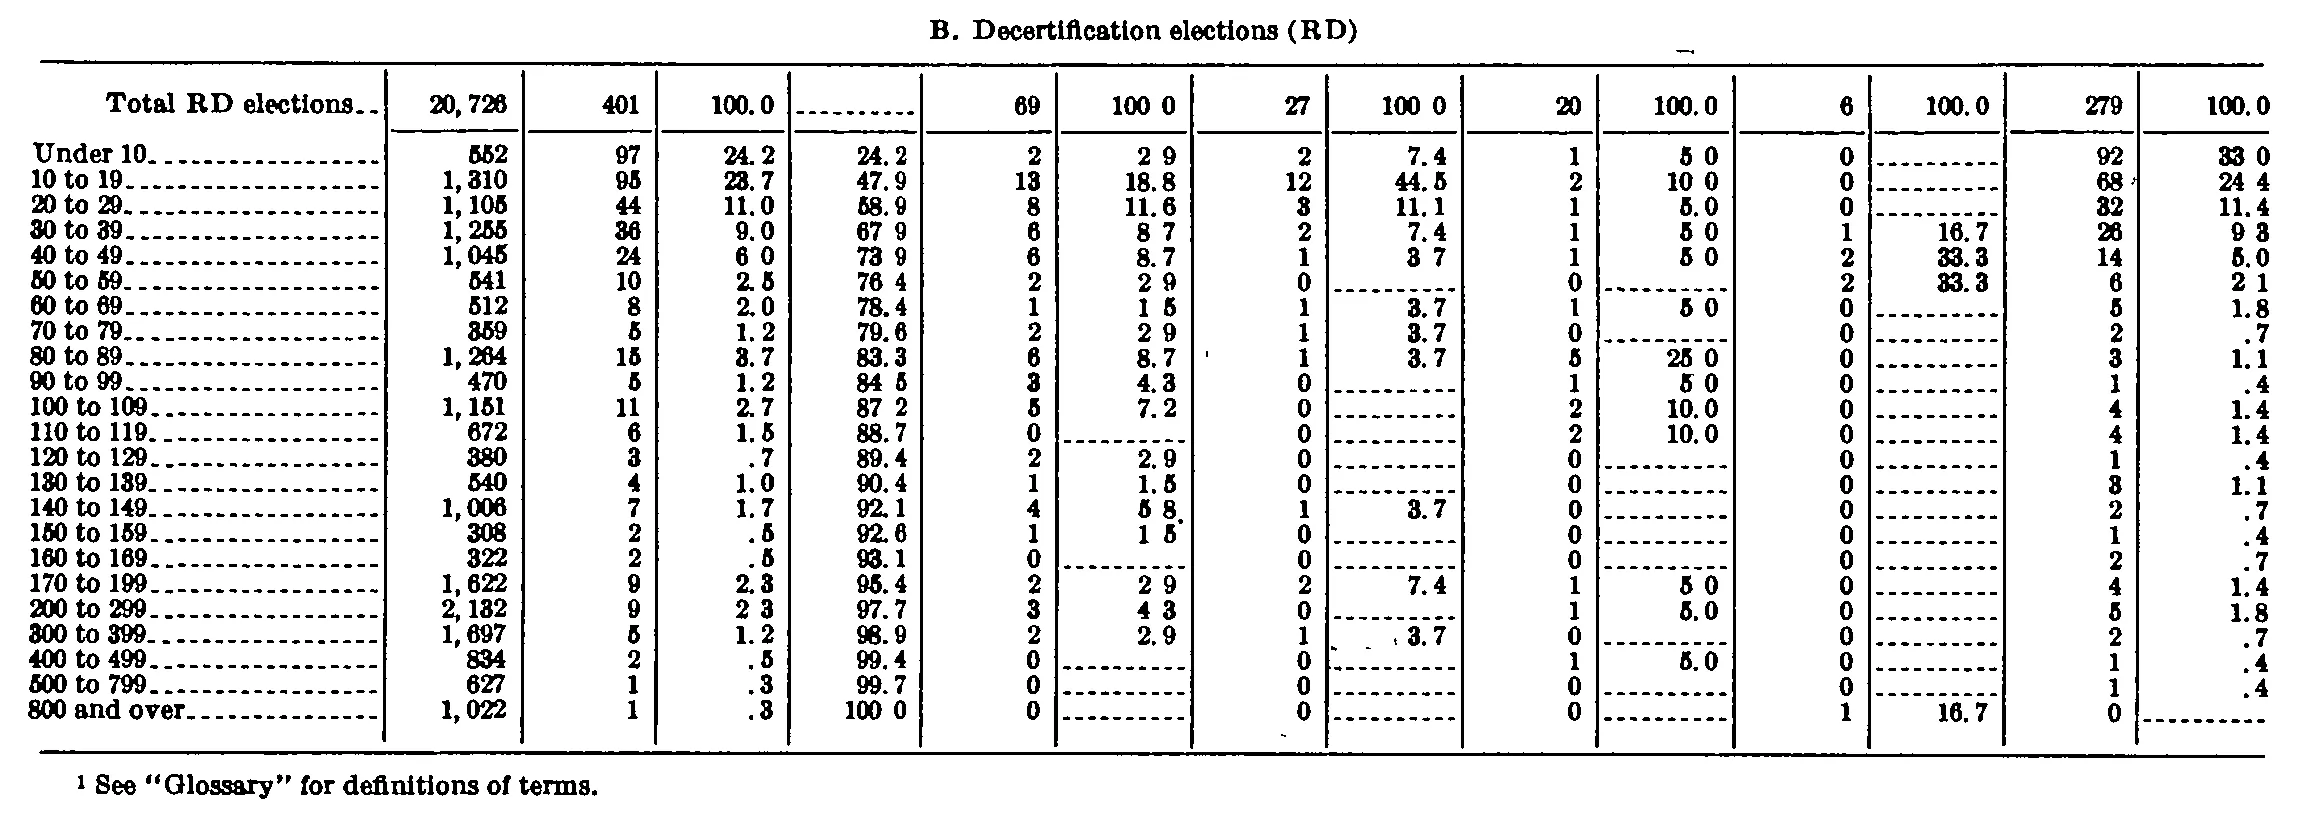
| B. Decertification elections (RD) | ||||||||||||||
| Total RD elections | 20,726 | 401 | 100.0 | 69 | 100.0 | 27 | 100.0 | 20 | 100.0 | 6 | 100.0 | 279 | 100.0 | |
| Under 10 | 552 | 97 | 24.2 | 24.2 | 2 | 2.9 | 2 | 7.4 | 1 | 5.0 | 0 | 92 | 33.0 | |
| 10 to 19 | 1,310 | 95 | 23.7 | 47.9 | 13 | 18.8 | 12 | 44.5 | 2 | 10.0 | 0 | 68 | 24.4 | |
| 20 to 29 | 1,105 | 44 | 11.0 | 58.9 | 8 | 11.6 | 3 | 11.1 | 1 | 5.0 | 0 | 32 | 11.4 | |
| 30 to 39 | 1,255 | 36 | 9.0 | 67.9 | 6 | 8.7 | 2 | 7.4 | 1 | 5.0 | 1 | 16.7 | 26 | 9.3 |
| 40 to 49 | 1,045 | 24 | 6.0 | 73.9 | 6 | 8.7 | 1 | 3.7 | 1 | 5.0 | 2 | 33.3 | 14 | 5.0 |
| 50 to 59 | 541 | 10 | 2.5 | 76.4 | 2 | 2.9 | 0 | 0 | 2 | 33.3 | 6 | 2.1 | ||
| 60 to 69 | 512 | 8 | 2.0 | 78.4 | 1 | 1.5 | 1 | 3.7 | 1 | 5.0 | 0 | 5 | 1.8 | |
| 70 to 79 | 359 | 5 | 1.2 | 79.6 | 2 | 2.9 | 1 | 3.7 | 0 | 0 | 2 | .7 | ||
| 80 to 89 | 1,264 | 15 | 3.7 | 83.3 | 6 | 8.7 | 1 | 3.7 | 5 | 25.0 | 0 | 3 | 1.1 | |
| 90 to 99 | 470 | 5 | 1.2 | 84.5 | 3 | 4.3 | 0 | 1 | 5.0 | 0 | 1 | .4 | ||
| 100 to 109 | 1,151 | 11 | 2.7 | 87.2 | 5 | 7.2 | 0 | 2 | 10.0 | 0 | 4 | 1.4 | ||
| 110 to 119 | 672 | 6 | 1.5 | 88.7 | 0 | 0 | 2 | 10.0 | 0 | 4 | 1.4 | |||
| 120 to 129 | 380 | 3 | .7 | 89.4 | 2 | 2.9 | 0 | 0 | 0 | 1 | .4 | |||
| 130 to 139 | 540 | 4 | 1.0 | 90.4 | 1 | 1.5 | 0 | 0 | 0 | 3 | 1.1 | |||
| 140 to 149 | 1,006 | 7 | 1.7 | 92.1 | 4 | 5.8 | 1 | 3.7 | 0 | 0 | 2 | .7 | ||
| 150 to 159 | 308 | 2 | .5 | 92.6 | 1 | 1.5 | 0 | 0 | 0 | 1 | .4 | |||
| 160 to 169 | 322 | 2 | .5 | 93.1 | 0 | 0 | 0 | 0 | 2 | .7 | ||||
| 170 to 199 | 1,622 | 9 | 2.3 | 95.4 | 2 | 2.9 | 2 | 7.4 | 1 | 5.0 | 0 | 4 | 1.4 | |
| 200 to 299 | 2,132 | 9 | 2.3 | 97.7 | 3 | 4.3 | 0 | 1 | 5.0 | 0 | 5 | 1.8 | ||
| 300 to 399 | 1,697 | 5 | 1.2 | 98.9 | 2 | 2.9 | 1 | 3.7 | 0 | 0 | 2 | .7 | ||
| 400 to 499 | 834 | 2 | .5 | 99.4 | 0 | 0 | 1 | 5.0 | 0 | 1 | .4 | |||
| 500 to 799 | 627 | 1 | .3 | 99.7 | 0 | 0 | 0 | 0 | 1 | .4 | ||||
| 800 and over | 1,022 | 1 | .3 | 100.0 | 0 | 0 | 1 | 1 | 16.7 | 0 | ||||
- 1 See "Glossary" for definitions of terms.
323 of 324 figures sit in a row or column sum that works out. 2 cells break a sum: '800 and over', column 3: prints 1, the subtotals in columns 6 to 14 add to 2; 'Total RD elections', column 10: prints 20, rows 'Under 10' to '800 and over' add to 21.
Reader’s notes
p. 201. Grid is 15 columns: stub plus 14 numeric columns. The caption carries a raised 1 (footnote marker), but no footnote text is printed within this crop; the table evidently continues past the bottom rule with panel "B" (e.g. decertification elections) and the footnote text on a following page, so `footnotes` is empty. Decimal points: in this 1-bit scan many decimal points in the one-decimal percentages are reproduced as a faint gap rather than a visible dot (e.g. Teamsters "Percent by size class" for "Under 10" prints as "41 8", "10 to 19" cumulative prints as "46 2"). Given the uniform one-decimal format of these columns I have written them with a period (41.8, 46.2, etc.). Cells affected in this way include: Under 10 (Teamsters pct, no-representative pct), 10 to 19 (cumulative pct), 30 to 39 (Teamsters pct), 40 to 49 (Other local pct), 50 to 59 (cumulative pct), 90 to 99 (AFL-CIO pct), 100 to 109 (no-representative pct), 120 to 129 (Other national pct), 150 to 159 (Other local pct), 200 to 299 (Other national pct), 300 to 399 (Other local pct), 600 to 799 (Other local pct). Values below 1 are printed without a leading zero (".3", ".5") and are transcribed that way. Dash-rule cells ("------") are rendered as empty strings; a printed "0" is kept as 0. Cumulative percent for the "Total RC and RM elections" row is a dash rule, hence "". A few counts carry stray specks: "600 to 799" Other national unions Number reads as a comma-like mark before 0 (read as 0), and "1,000 to 1,999" AFL-CIO percent has a stray mark before ".3". The stub label "1,000 to 1,999" has heavy leader dots trailing into the rule but the label itself is legible. Printed percent columns do not always sum to 100.0 and cumulative percent reaches 100.0 at "3,000 to 9,999" while later rows still carry counts; transcribed exactly as printed, nothing computed or corrected.
p. 202. CROP SCOPE: this page continues a table from the preceding page, so no column headings are printed on the image and `header_rows` is empty. The centred line "B. Decertification elections (RD)" sits above the table's top rule and is transcribed as a label-only section row (it is a section of the table, not the table caption). The grid has 15 columns: stub + 14 value columns, counted from the vertical rules (a thick double rule separates the stub from col 1, and the last rule separates col 13 from col 14). Column 4 is an unlabelled cumulative-percent column (its total cell carries a dash rule, transcribed as ""); its printed values are exactly the running sum of column 3, which confirms the column alignment. DECIMAL POINTS: this is a 1-bit scan in which many decimal points in the percent columns did not reproduce, so cells appear as e.g. "100 0", "2 9", "5 0", "84 5", "33 0". These are decimal fractions (confirmed by the column arithmetic), and the period is printed but faint, so they are transcribed with the decimal point. No digits were added or removed. ARITHMETIC CHECKS (used only to validate the reading, nothing was computed into a cell): all five count columns sum exactly to their printed totals — col 1 = 20,726, col 2 = 401, col 5 = 69, col 7 = 27, col 9 = 20, col 11 = 6, col 13 = 279 — and every percent column matches its count divided by that total. DOUBTFUL CELLS: - Row "10 to 19", col 8 (the percent column of the 27-total panel): reads "44.5" as printed, but 12/27 = 44.4. Either a misprint in the original or a 4/5 glyph confusion in the scan; transcribed as printed. - Row "800 and over", col 9 (the count column of the 20-total panel): printed as "1"; the surrounding rows in that column are 0 and the column already sums to 20 without it, so this may be an ink artifact or a misprint. Transcribed as seen. - Rows "170 to 199" and "200 to 299", col 3: printed ".3" tail ("2.3" each), though 9/401 = 2.24; the cumulative column (95.4, 97.7) is consistent with the printed 2.3, so this is the original's rounding, left as printed. - A small stray mark sits in the top margin above col 10, and a faint stray dot appears in the gutter beside row "80 to 89"; both are page noise, not data.
Source image
Source data: U.S. NLRB Annual Reports (public domain). Reconstruction by NLRB Stats Archive. Read by claude-opus-5 (effort max, prompt extract_v1) from the 300-dpi scan; stitched by page. Updated October 2026.