NLRB Stats Archive › Annual Reports › FY1971 › Analysis of Methods of Disposition of Representation and Union Deauthorization Cases Closed, Fiscal Year 1971
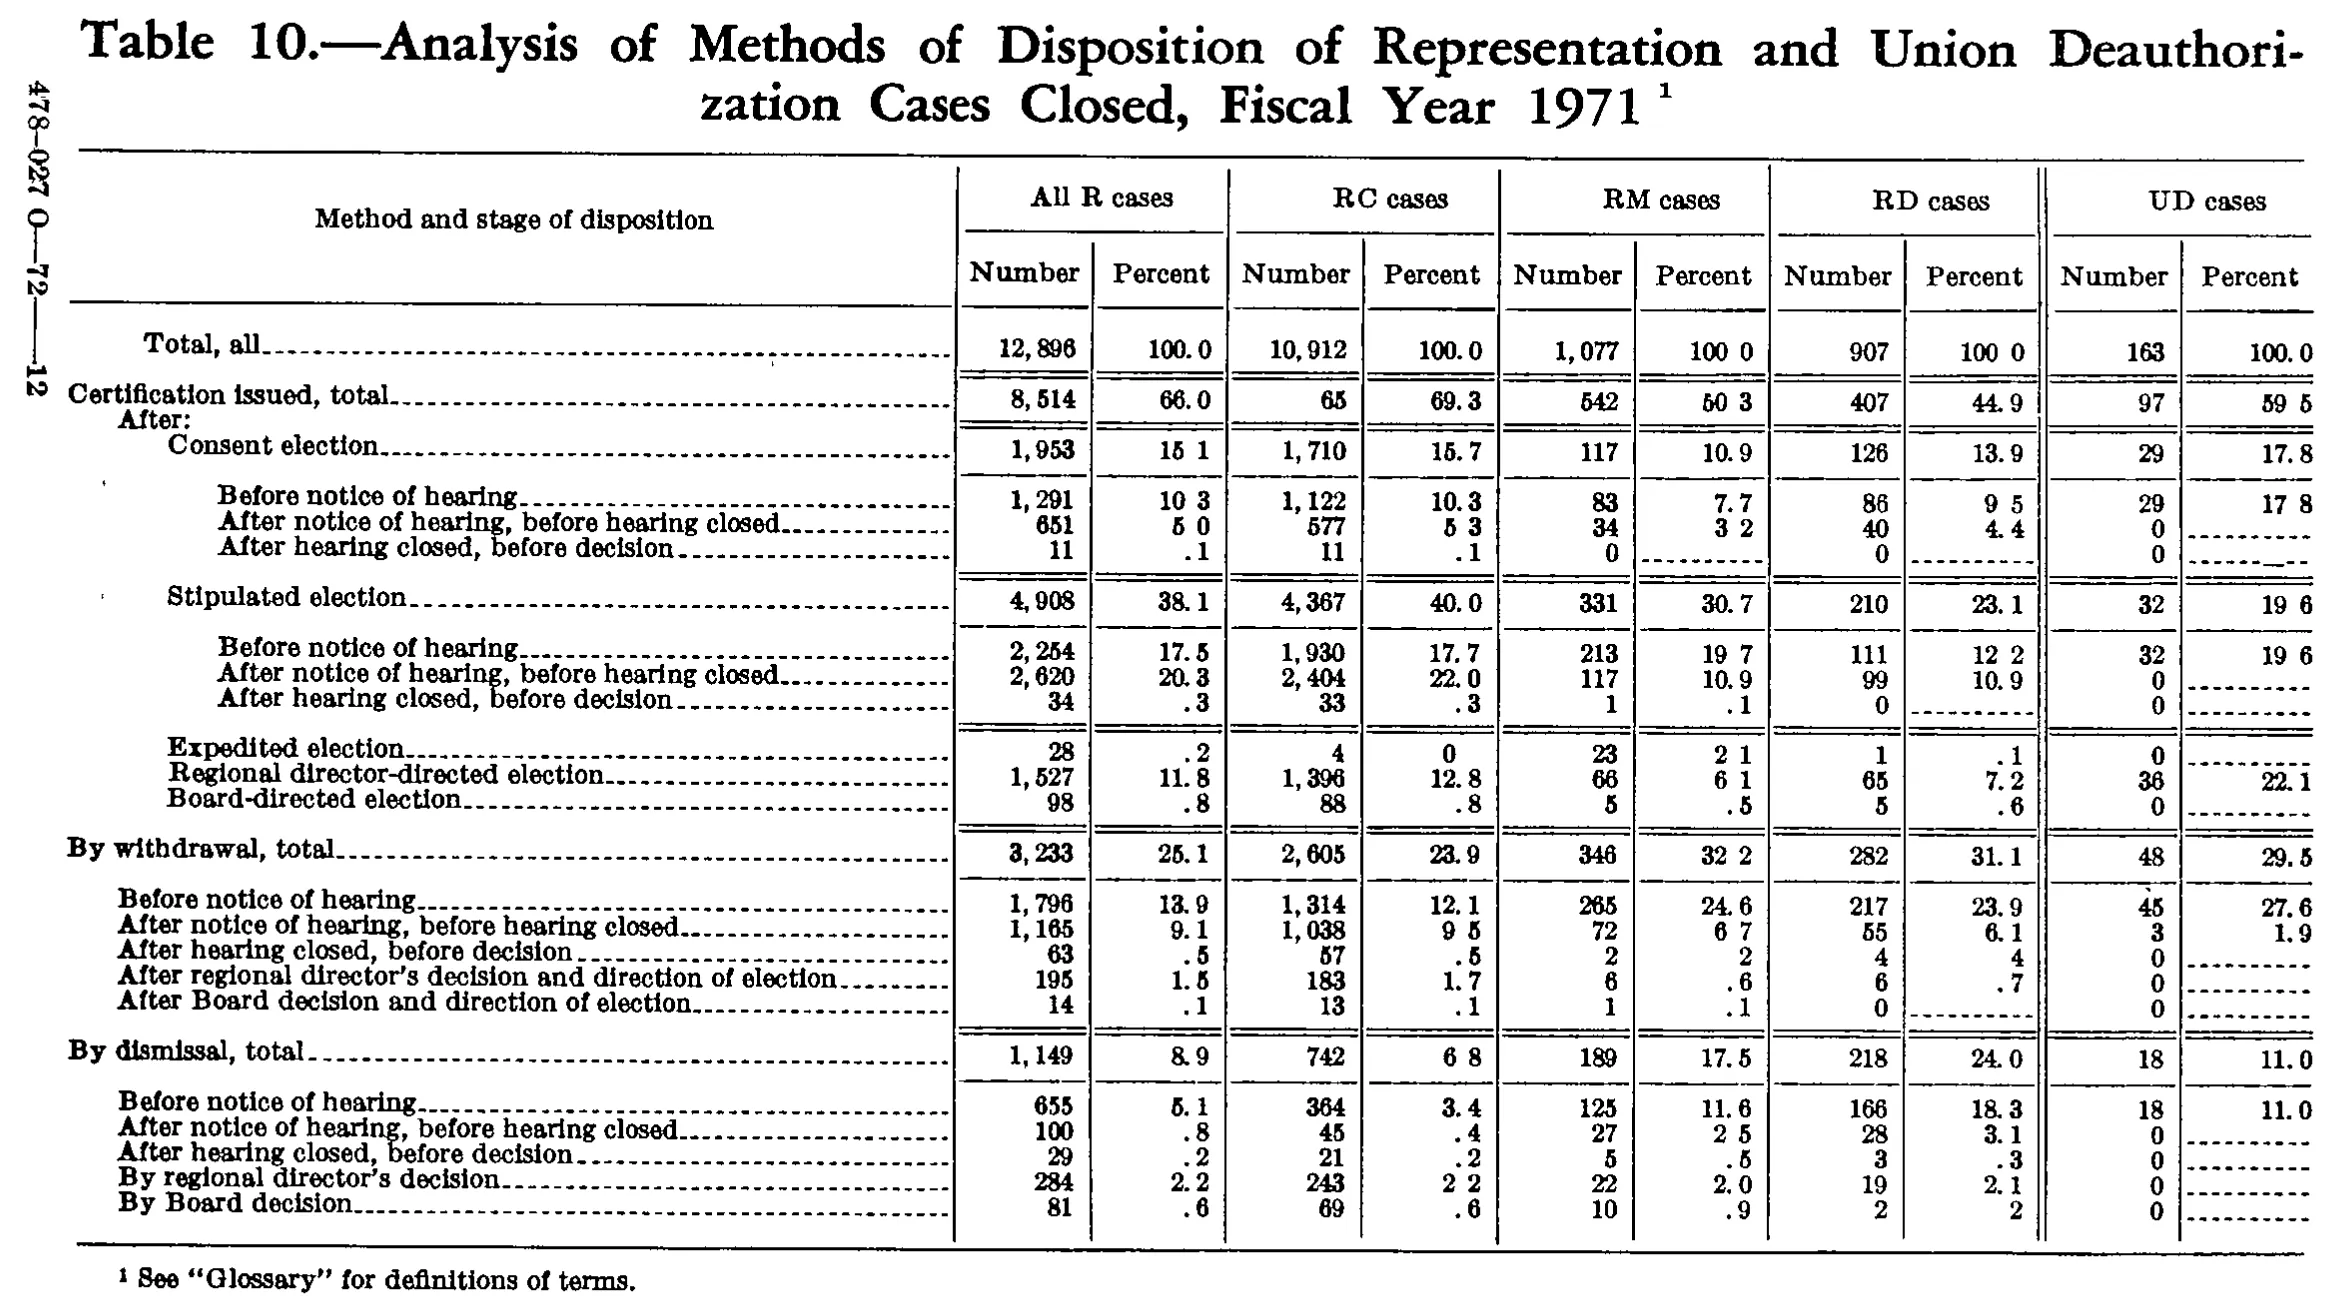
Analysis of Methods of Disposition of Representation and Union Deauthorization Cases Closed, Fiscal Year 1971
| Method and stage of disposition | All R cases | RC cases | RM cases | RD cases | UD cases | |||||
|---|---|---|---|---|---|---|---|---|---|---|
| Method and stage of disposition | Number | Percent | Number | Percent | Number | Percent | Number | Percent | Number | Percent |
| Total, all | 12,896 | 100.0 | 10,912 | 100.0 | 1,077 | 100.0 | 907 | 100.0 | 163 | 100.0 |
| Certification issued, total | 8,514 | 66.0 | 65 | 69.3 | 542 | 50.3 | 407 | 44.9 | 97 | 59.5 |
| After: | ||||||||||
| Consent election | 1,953 | 15.1 | 1,710 | 15.7 | 117 | 10.9 | 126 | 13.9 | 29 | 17.8 |
| Before notice of hearing | 1,291 | 10.3 | 1,122 | 10.3 | 83 | 7.7 | 86 | 9.5 | 29 | 17.8 |
| After notice of hearing, before hearing closed | 651 | 5.0 | 577 | 5.3 | 34 | 3.2 | 40 | 4.4 | 0 | |
| After hearing closed, before decision | 11 | .1 | 11 | .1 | 0 | 0 | 0 | |||
| Stipulated election | 4,908 | 38.1 | 4,367 | 40.0 | 331 | 30.7 | 210 | 23.1 | 32 | 19.6 |
| Before notice of hearing | 2,254 | 17.5 | 1,930 | 17.7 | 213 | 19.7 | 111 | 12.2 | 32 | 19.6 |
| After notice of hearing, before hearing closed | 2,620 | 20.3 | 2,404 | 22.0 | 117 | 10.9 | 99 | 10.9 | 0 | |
| After hearing closed, before decision | 34 | .3 | 33 | .3 | 1 | .1 | 0 | 0 | ||
| Expedited election | 28 | .2 | 4 | 0 | 23 | 2.1 | 1 | .1 | 0 | |
| Regional director-directed election | 1,527 | 11.8 | 1,396 | 12.8 | 66 | 6.1 | 65 | 7.2 | 36 | 22.1 |
| Board-directed election | 98 | .8 | 88 | .8 | 5 | .5 | 5 | .6 | 0 | |
| By withdrawal, total | 3,233 | 25.1 | 2,605 | 23.9 | 346 | 32.2 | 282 | 31.1 | 48 | 29.5 |
| Before notice of hearing | 1,796 | 13.9 | 1,314 | 12.1 | 265 | 24.6 | 217 | 23.9 | 45 | 27.6 |
| After notice of hearing, before hearing closed | 1,165 | 9.1 | 1,038 | 9.5 | 72 | 6.7 | 55 | 6.1 | 3 | 1.9 |
| After hearing closed, before decision | 63 | .5 | 57 | .5 | 2 | .2 | 4 | .4 | 0 | |
| After regional director's decision and direction of election | 195 | 1.5 | 183 | 1.7 | 6 | .6 | 6 | .7 | 0 | |
| After Board decision and direction of election | 14 | .1 | 13 | .1 | 1 | .1 | 0 | 0 | ||
| By dismissal, total | 1,149 | 8.9 | 742 | 6.8 | 189 | 17.5 | 218 | 24.0 | 18 | 11.0 |
| Before notice of hearing | 655 | 5.1 | 364 | 3.4 | 125 | 11.6 | 166 | 18.3 | 18 | 11.0 |
| After notice of hearing, before hearing closed | 100 | .8 | 45 | .4 | 27 | 2.5 | 28 | 3.1 | 0 | |
| After hearing closed, before decision | 29 | .2 | 21 | .2 | 5 | .5 | 3 | .3 | 0 | |
| By regional director's decision | 284 | 2.2 | 243 | 2.2 | 22 | 2.0 | 19 | 2.1 | 0 | |
| By Board decision | 81 | .6 | 69 | .6 | 10 | .9 | 2 | .2 | 0 | |
- 1 See "Glossary" for definitions of terms.
107 of 108 figures sit in a row or column sum that works out. 3 cells break a sum: 'Certification issued, total', column 2: prints 8,514, the subtotals in columns 4 to 8 add to 1,014; 'Certification issued, total', column 4: prints 65, the subtotals in rows 'After:' to 'Board-directed elect' add to 7,565; 'Total, all', column 4: prints 10,912, the subtotals in rows 'Certification issued' to 'By dismissal, total' add to 3,412.
Reader’s notes
p. 178. Eleven columns: stub plus Number/Percent pairs for All R, RC, RM, RD and UD cases. DOUBTFUL CELL — "Certification issued, total", RC cases / Number: only the characters "65" are legible in the scan, set well in from the column's right-hand alignment, so leading characters appear to have dropped out in printing or scanning. The table's own arithmetic points to 7,565 (RC detail 1,710 + 4,367 + 4 + 1,396 + 88 = 7,565; and 7,565 + 542 + 407 = 8,514, the All R figure; 7,565 / 10,912 = 69.3 percent, the value printed beside it). I have transcribed only what is legible, "65", rather than supply the missing digits. Two All R percent cells disagree with the printed numbers and may be misreadings of a faint final digit rather than misprints: "Before notice of hearing" under Consent election, All R / Percent, read as 10.3 (1,291 / 12,896 = 10.0); and "After notice of hearing, before hearing closed" under By withdrawal, All R / Percent, read as 9.1 (1,165 / 12,896 = 9.0). Every other All R percent in the table reproduces its own ratio exactly, so these two stand out. The glyphs are small and I could not resolve them with certainty. Decimal points print very faintly throughout this scan, so that many percents appear as "100 0", "50 3", "15 1", "19 7". These are decimal points, and I have written them as such; none is a thousands separator. Where a percent cell holds a dash rule rather than a figure (chiefly the UD cases column and a few RM and RD cells beside a printed 0), the cell is given as "". The row "After hearing closed, before decision" under Consent election has a printed 0 in RM, RD and UD Number with no percent in any of the three. "Expedited election", RC cases / Percent is a bare printed "0", not ".0" and not a dash; 4 of 10,912 rounds to less than a tenth of a percent. Minor rounding differences from the report's own computation (RM 19.7 for 19.8, RM 32.2 for 32.1, RD 23.1 for 23.2) are transcribed as printed. "After:" is a section line carrying a label and no values. The vertical mark in the left margin ("478-027 O—72——12") is a printer's signature, not table matter, and is omitted along with the caption and its footnote reference.
Source image
Source data: U.S. NLRB Annual Reports (public domain). Reconstruction by NLRB Stats Archive. Read by claude-opus-5 (effort max, prompt extract_v1) from the 300-dpi scan; stitched by page. Updated October 2026.