NLRB Stats Archive › Annual Reports › FY1971 › Geographic Distribution of Cases Received, Fiscal Year 1971
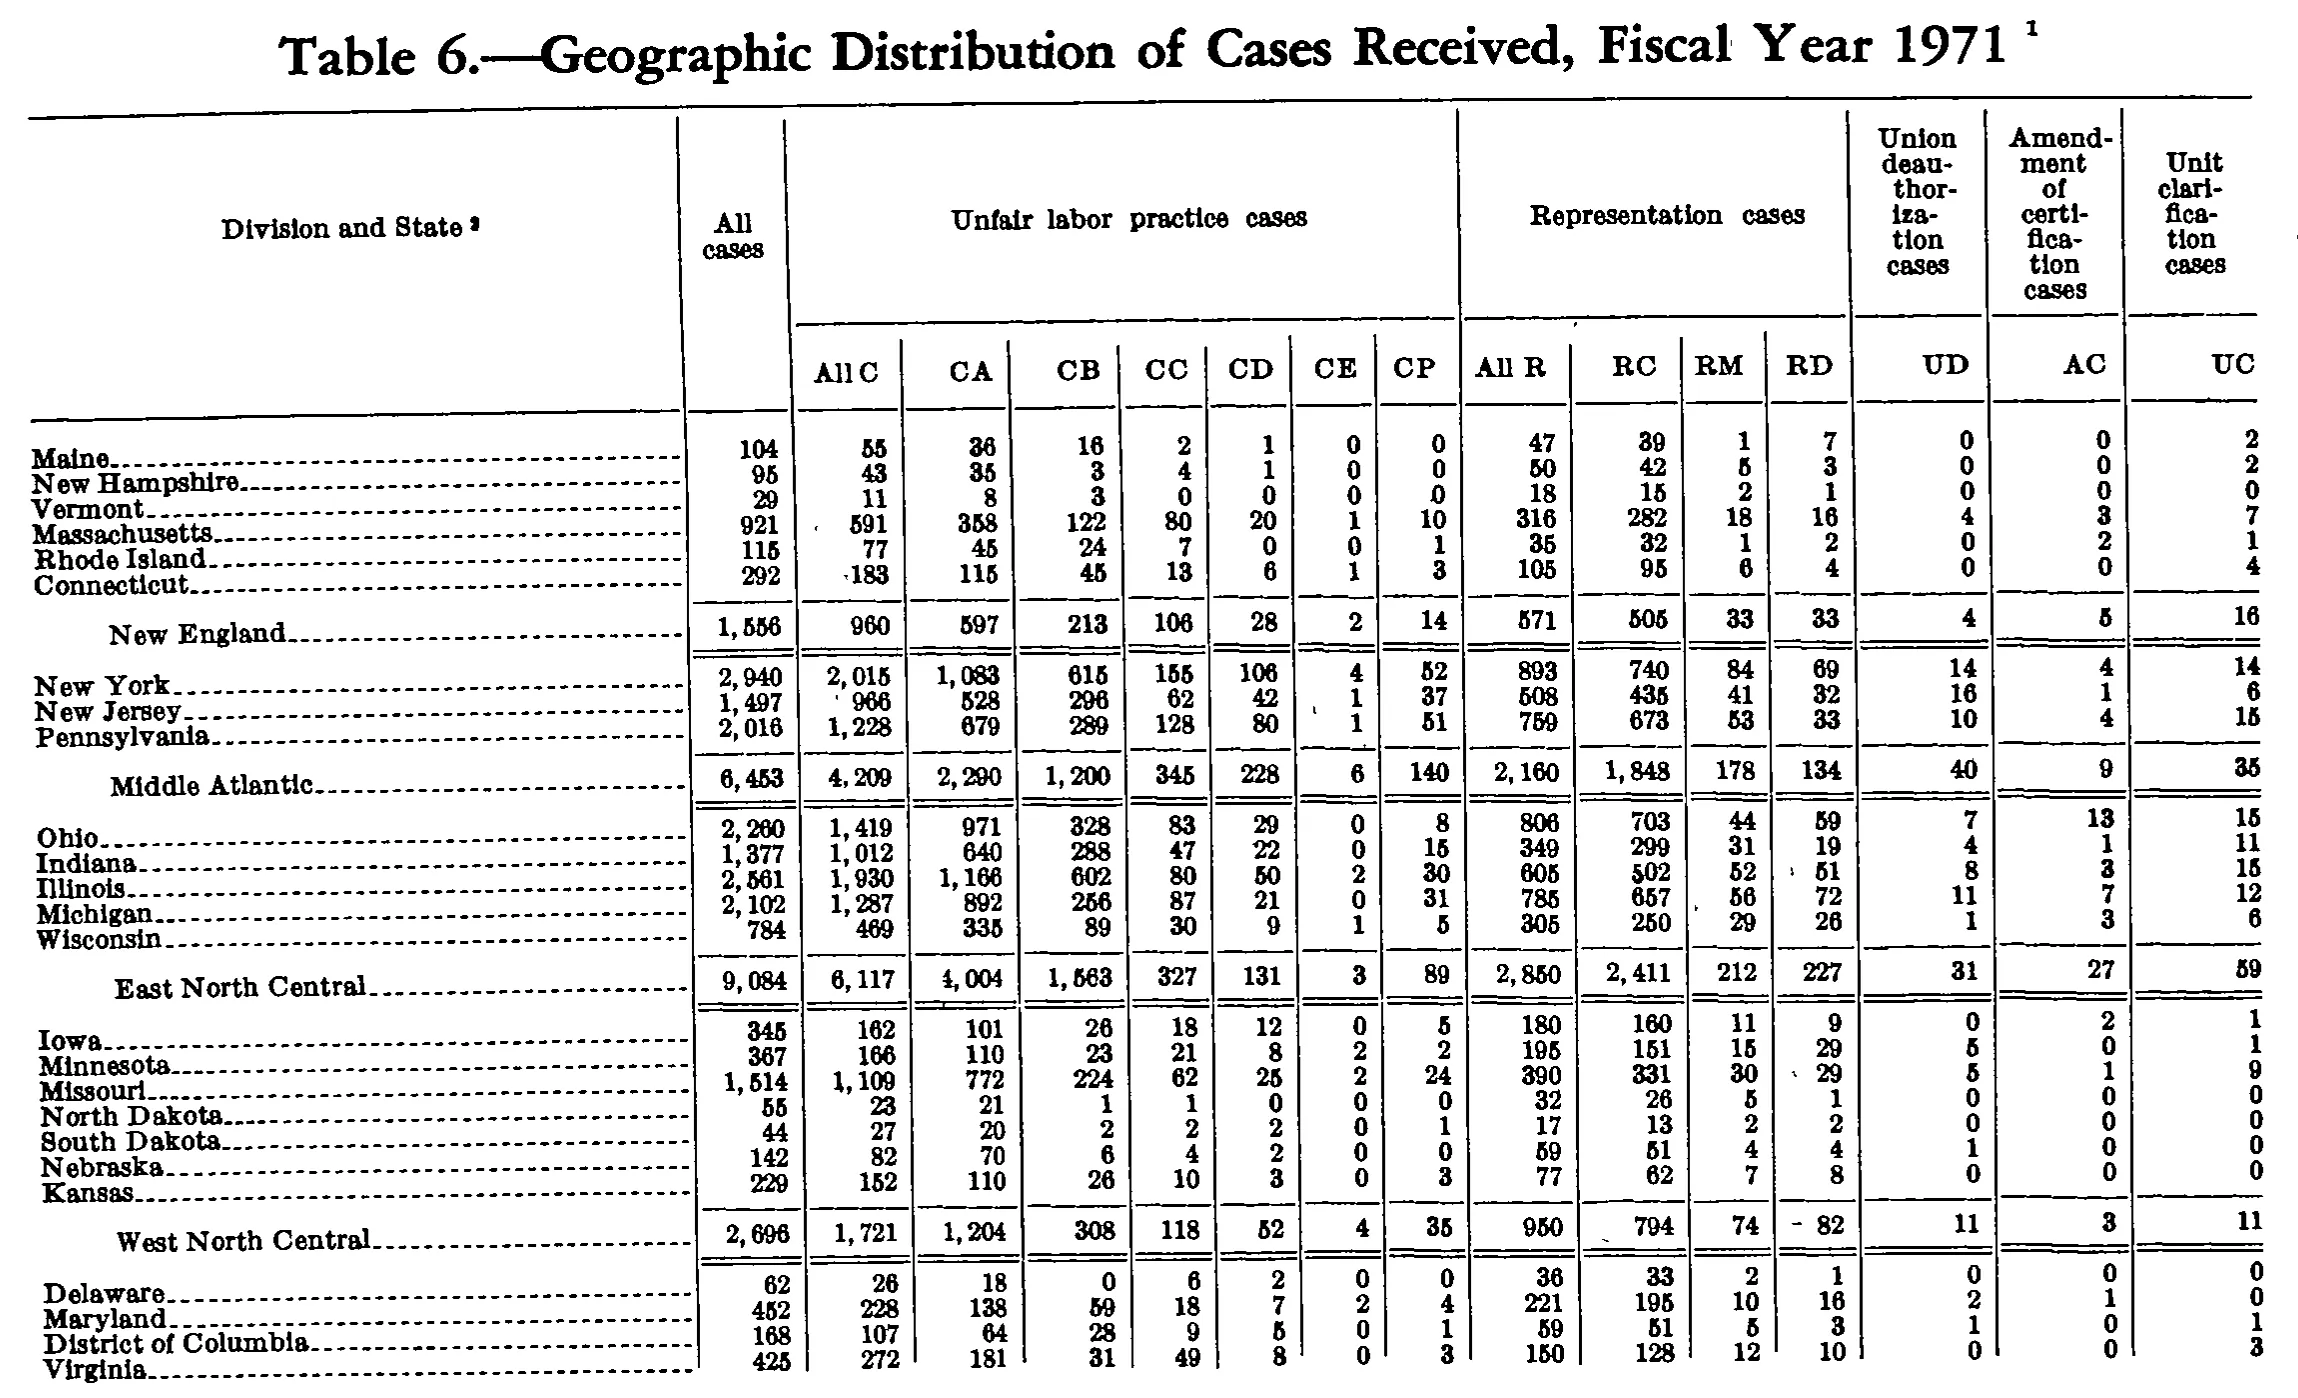
Geographic Distribution of Cases Received, Fiscal Year 1971
Stitched from pp. 171–172.
| Division and State | All cases | Unfair labor practice cases | Representation cases | Union deauthorization cases | Amendment of certification cases | Unit clarification cases | |||||||||
|---|---|---|---|---|---|---|---|---|---|---|---|---|---|---|---|
| Division and State | All cases | All C | CA | CB | CC | CD | CE | CP | All R | RC | RM | RD | UD | AC | UC |
| Maine | 104 | 55 | 36 | 16 | 2 | 1 | 0 | 0 | 47 | 39 | 1 | 7 | 0 | 0 | 2 |
| New Hampshire | 95 | 43 | 35 | 3 | 4 | 1 | 0 | 0 | 50 | 42 | 5 | 3 | 0 | 0 | 2 |
| Vermont | 29 | 11 | 8 | 3 | 0 | 0 | 0 | 0 | 18 | 15 | 2 | 1 | 0 | 0 | 0 |
| Massachusetts | 921 | 591 | 358 | 122 | 80 | 20 | 1 | 10 | 316 | 282 | 18 | 16 | 4 | 3 | 7 |
| Rhode Island | 115 | 77 | 45 | 24 | 7 | 0 | 0 | 1 | 35 | 32 | 1 | 2 | 0 | 2 | 1 |
| Connecticut | 292 | 183 | 115 | 45 | 13 | 6 | 1 | 3 | 105 | 95 | 6 | 4 | 0 | 0 | 4 |
| New England | 1,556 | 960 | 597 | 213 | 106 | 28 | 2 | 14 | 571 | 505 | 33 | 33 | 4 | 5 | 16 |
| New York | 2,940 | 2,015 | 1,083 | 615 | 155 | 106 | 4 | 52 | 893 | 740 | 84 | 69 | 14 | 4 | 14 |
| New Jersey | 1,497 | 966 | 528 | 296 | 62 | 42 | 1 | 37 | 508 | 435 | 41 | 32 | 16 | 1 | 6 |
| Pennsylvania | 2,016 | 1,228 | 679 | 289 | 128 | 80 | 1 | 51 | 759 | 673 | 53 | 33 | 10 | 4 | 15 |
| Middle Atlantic | 6,453 | 4,209 | 2,290 | 1,200 | 345 | 228 | 6 | 140 | 2,160 | 1,848 | 178 | 134 | 40 | 9 | 35 |
| Ohio | 2,260 | 1,419 | 971 | 328 | 83 | 29 | 0 | 8 | 806 | 703 | 44 | 59 | 7 | 13 | 15 |
| Indiana | 1,377 | 1,012 | 640 | 288 | 47 | 22 | 0 | 15 | 349 | 299 | 31 | 19 | 4 | 1 | 11 |
| Illinois | 2,561 | 1,930 | 1,166 | 602 | 80 | 50 | 2 | 30 | 605 | 502 | 52 | 51 | 8 | 3 | 15 |
| Michigan | 2,102 | 1,287 | 892 | 256 | 87 | 21 | 0 | 31 | 785 | 657 | 56 | 72 | 11 | 7 | 12 |
| Wisconsin | 784 | 469 | 335 | 89 | 30 | 9 | 1 | 5 | 305 | 250 | 29 | 26 | 1 | 3 | 6 |
| East North Central | 9,084 | 6,117 | 4,004 | 1,563 | 327 | 131 | 3 | 89 | 2,850 | 2,411 | 212 | 227 | 31 | 27 | 59 |
| Iowa | 345 | 162 | 101 | 26 | 18 | 12 | 0 | 5 | 180 | 160 | 11 | 9 | 0 | 2 | 1 |
| Minnesota | 367 | 166 | 110 | 23 | 21 | 8 | 2 | 2 | 195 | 151 | 15 | 29 | 5 | 0 | 1 |
| Missouri | 1,514 | 1,109 | 772 | 224 | 62 | 25 | 2 | 24 | 390 | 331 | 30 | 29 | 5 | 1 | 9 |
| North Dakota | 55 | 23 | 21 | 1 | 1 | 0 | 0 | 0 | 32 | 26 | 5 | 1 | 0 | 0 | 0 |
| South Dakota | 44 | 27 | 20 | 2 | 2 | 2 | 0 | 1 | 17 | 13 | 2 | 2 | 0 | 0 | 0 |
| Nebraska | 142 | 82 | 70 | 6 | 4 | 2 | 0 | 0 | 59 | 51 | 4 | 4 | 1 | 0 | 0 |
| Kansas | 229 | 152 | 110 | 26 | 10 | 3 | 0 | 3 | 77 | 62 | 7 | 8 | 0 | 0 | 0 |
| West North Central | 2,696 | 1,721 | 1,204 | 308 | 118 | 52 | 4 | 35 | 950 | 794 | 74 | 82 | 11 | 3 | 11 |
| Delaware | 62 | 26 | 18 | 0 | 6 | 2 | 0 | 0 | 36 | 33 | 2 | 1 | 0 | 0 | 0 |
| Maryland | 452 | 228 | 138 | 59 | 18 | 7 | 2 | 4 | 221 | 195 | 10 | 16 | 2 | 1 | 0 |
| District of Columbia | 168 | 107 | 64 | 28 | 9 | 5 | 0 | 1 | 59 | 51 | 5 | 3 | 1 | 0 | 0 |
| Virginia | 425 | 272 | 181 | 31 | 49 | 8 | 1 | 3 | 150 | 128 | 12 | 10 | 0 | 0 | 3 |
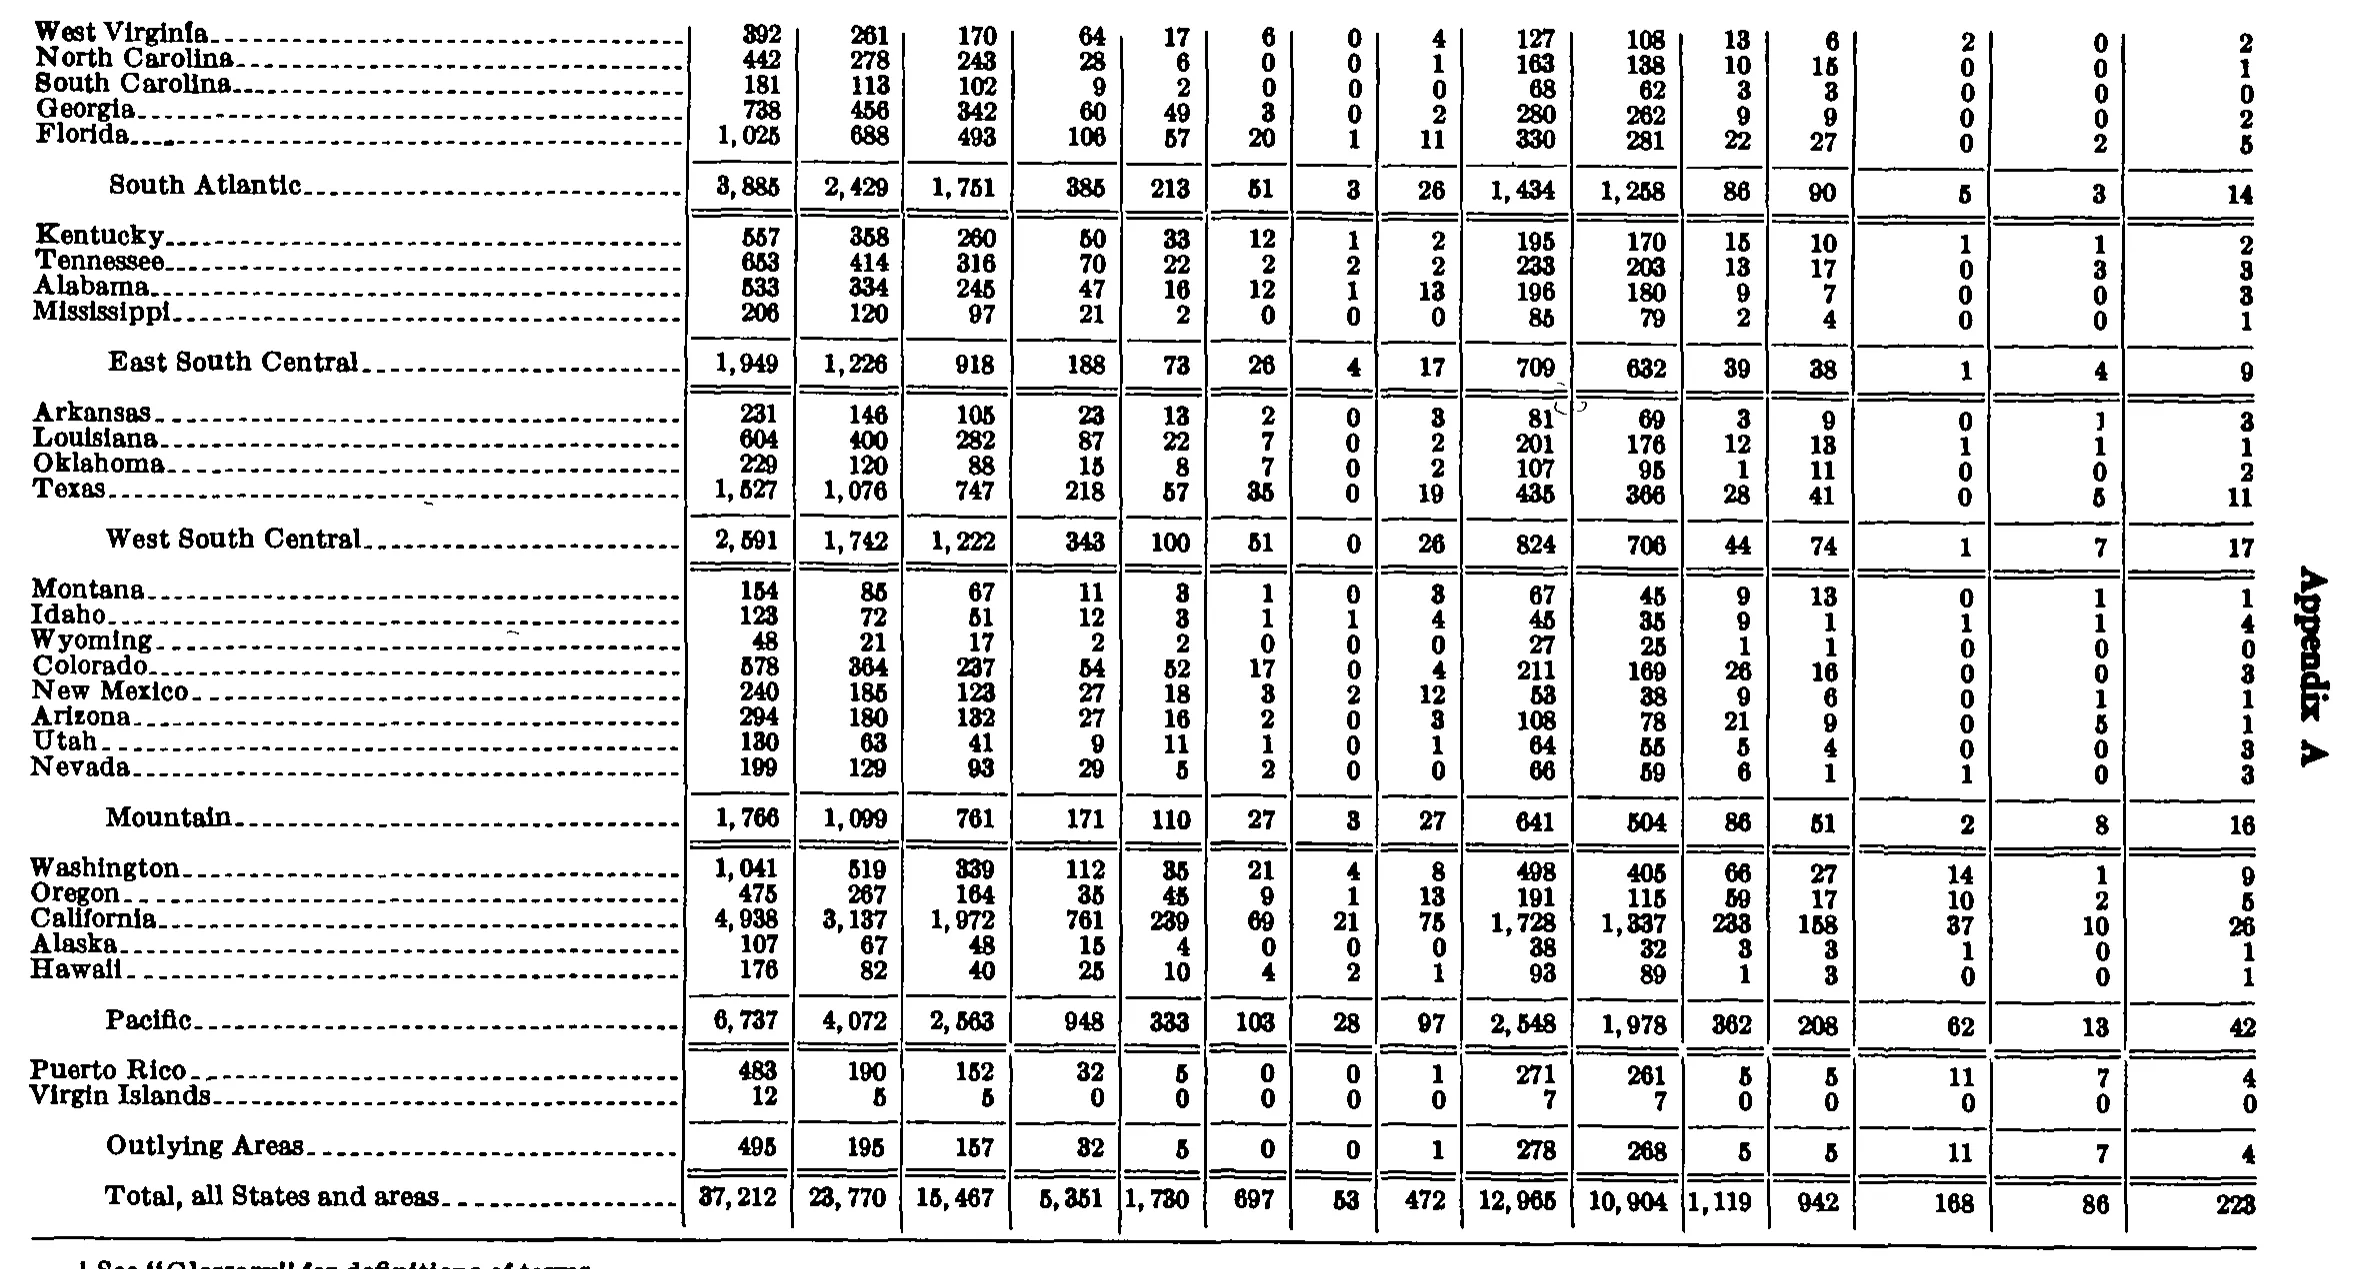
| West Virginia | 392 | 261 | 170 | 64 | 17 | 6 | 0 | 4 | 127 | 108 | 13 | 6 | 2 | 0 | 2 |
| North Carolina | 442 | 278 | 243 | 28 | 6 | 0 | 0 | 1 | 163 | 138 | 10 | 15 | 0 | 0 | 1 |
| South Carolina | 181 | 113 | 102 | 9 | 2 | 0 | 0 | 0 | 68 | 62 | 3 | 3 | 0 | 0 | 0 |
| Georgia | 738 | 456 | 342 | 60 | 49 | 3 | 0 | 2 | 280 | 262 | 9 | 9 | 0 | 0 | 2 |
| Florida | 1,025 | 688 | 493 | 106 | 57 | 20 | 1 | 11 | 330 | 281 | 22 | 27 | 0 | 2 | 5 |
| South Atlantic | 3,885 | 2,429 | 1,751 | 385 | 213 | 51 | 3 | 26 | 1,434 | 1,258 | 86 | 90 | 5 | 3 | 14 |
| Kentucky | 557 | 358 | 260 | 50 | 33 | 12 | 1 | 2 | 195 | 170 | 15 | 10 | 1 | 1 | 2 |
| Tennessee | 653 | 414 | 316 | 70 | 22 | 2 | 2 | 2 | 233 | 203 | 13 | 17 | 0 | 3 | 3 |
| Alabama | 533 | 334 | 245 | 47 | 16 | 12 | 1 | 13 | 196 | 180 | 9 | 7 | 0 | 0 | 3 |
| Mississippi | 206 | 120 | 97 | 21 | 2 | 0 | 0 | 0 | 85 | 79 | 2 | 4 | 0 | 0 | 1 |
| East South Central | 1,949 | 1,226 | 918 | 188 | 73 | 26 | 4 | 17 | 709 | 632 | 39 | 38 | 1 | 4 | 9 |
| Arkansas | 231 | 146 | 105 | 23 | 13 | 2 | 0 | 3 | 81 | 69 | 3 | 9 | 0 | 1 | 3 |
| Louisiana | 604 | 400 | 282 | 87 | 22 | 7 | 0 | 2 | 201 | 176 | 12 | 13 | 1 | 1 | 1 |
| Oklahoma | 229 | 120 | 88 | 15 | 8 | 7 | 0 | 2 | 107 | 95 | 1 | 11 | 0 | 0 | 2 |
| Texas | 1,527 | 1,076 | 747 | 218 | 57 | 35 | 0 | 19 | 435 | 366 | 28 | 41 | 0 | 5 | 11 |
| West South Central | 2,591 | 1,742 | 1,222 | 343 | 100 | 51 | 0 | 26 | 824 | 706 | 44 | 74 | 1 | 7 | 17 |
| Montana | 154 | 85 | 67 | 11 | 3 | 1 | 0 | 3 | 67 | 45 | 9 | 13 | 0 | 1 | 1 |
| Idaho | 123 | 72 | 51 | 12 | 3 | 1 | 1 | 4 | 45 | 35 | 9 | 1 | 1 | 1 | 4 |
| Wyoming | 48 | 21 | 17 | 2 | 2 | 0 | 0 | 0 | 27 | 25 | 1 | 1 | 0 | 0 | 0 |
| Colorado | 578 | 364 | 237 | 54 | 52 | 17 | 0 | 4 | 211 | 169 | 26 | 16 | 0 | 0 | 3 |
| New Mexico | 240 | 185 | 123 | 27 | 18 | 3 | 2 | 12 | 53 | 38 | 9 | 6 | 0 | 1 | 1 |
| Arizona | 294 | 180 | 132 | 27 | 16 | 2 | 0 | 3 | 108 | 78 | 21 | 9 | 0 | 5 | 1 |
| Utah | 130 | 63 | 41 | 9 | 11 | 1 | 0 | 1 | 64 | 55 | 5 | 4 | 0 | 0 | 3 |
| Nevada | 199 | 129 | 93 | 29 | 5 | 2 | 0 | 0 | 66 | 59 | 6 | 1 | 1 | 0 | 3 |
| Mountain | 1,766 | 1,099 | 761 | 171 | 110 | 27 | 3 | 27 | 641 | 504 | 86 | 51 | 2 | 8 | 16 |
| Washington | 1,041 | 519 | 339 | 112 | 35 | 21 | 4 | 8 | 498 | 405 | 66 | 27 | 14 | 1 | 9 |
| Oregon | 475 | 267 | 164 | 35 | 45 | 9 | 1 | 13 | 191 | 115 | 59 | 17 | 10 | 2 | 5 |
| California | 4,938 | 3,137 | 1,972 | 761 | 239 | 69 | 21 | 75 | 1,728 | 1,337 | 233 | 158 | 37 | 10 | 26 |
| Alaska | 107 | 67 | 48 | 15 | 4 | 0 | 0 | 0 | 38 | 32 | 3 | 3 | 1 | 0 | 1 |
| Hawaii | 176 | 82 | 40 | 25 | 10 | 4 | 2 | 1 | 93 | 89 | 1 | 3 | 0 | 0 | 1 |
| Pacific | 6,737 | 4,072 | 2,563 | 948 | 333 | 103 | 28 | 97 | 2,548 | 1,978 | 362 | 208 | 62 | 13 | 42 |
| Puerto Rico | 483 | 190 | 152 | 32 | 5 | 0 | 0 | 1 | 271 | 261 | 5 | 5 | 11 | 7 | 4 |
| Virgin Islands | 12 | 5 | 5 | 0 | 0 | 0 | 0 | 0 | 7 | 7 | 0 | 0 | 0 | 0 | 0 |
| Outlying Areas | 495 | 195 | 157 | 32 | 5 | 0 | 0 | 1 | 278 | 268 | 5 | 5 | 11 | 7 | 4 |
| Total, all States and areas | 37,212 | 23,770 | 15,467 | 5,351 | 1,730 | 697 | 53 | 472 | 12,965 | 10,904 | 1,119 | 942 | 168 | 86 | 223 |
- 1 See "Glossary" for definitions of terms.
830 of 831 figures sit in a row or column sum that works out. 4 cells break a sum: 'Virginia', column 3: prints 272, columns 4 to 9 add to 273; 'District of Columbia', column 2: prints 168, the subtotals in columns 3 to 16 add to 167; 'South Atlantic', column 8: prints 3, rows 'Delaware' to 'Florida' add to 4; 'South Atlantic', column 16: prints 14, rows 'Delaware' to 'Florida' add to 13.
Reader’s notes
p. 171. Crop is the first page of a continuing table; it ends mid-division. The last four rows (Delaware, Maryland, District of Columbia, Virginia) are the opening states of the South Atlantic division, whose unlabelled section continues on the next page, so no subtotal row for them appears here. The caption carries a raised "1" and the stub heading a raised "2"; the corresponding footnote texts are not printed on this crop. Verification: every state row and all four division totals satisfy both printed identities (All C = CA+CB+CC+CD+CE+CP, and All cases = All C + All R + UD + AC + UC), and each division total equals the sum of its states in all 15 numeric columns, with two exceptions noted below. That gives high confidence in the whole grid above the Delaware row. Doubtful cells, all in the last (South Atlantic) block, where the UD/AC/UC columns sit near the crop's bottom edge: - District of Columbia, UC: read as 0, but 107 + 59 + 1 + 0 + 0 = 167 against a printed All cases of 168, so this cell is more likely a printed 1. The glyph is small and degraded; I transcribed what I could see. - Virginia, UD and AC: read as 0 and 0, but both are faint at the bottom edge of the crop and were hard to resolve. - Virginia, UC: read as 3. In this block the UC column glyphs appear set roughly half a line higher than the UD/AC glyphs, so the sequence 0, 0, 0, 3 could alternatively belong to Maryland, District of Columbia, Virginia and a row below. I assigned them row-by-row as printed. - Virginia, All C: printed 272, but the six C components as read (181 + 31 + 49 + 8 + 1 + 3) sum to 273. Either All C is a misprint or one component is one unit off in my reading (CA, CB, CC or CD are the candidates). Transcribed as printed. Note that 272 is the value consistent with All cases = 425 given All R = 150 and UD+AC+UC = 3. Typographic debris ignored (scan specks, not digits or markers): a speck before Massachusetts All C "591", before Connecticut All C "183", before New Jersey All C "966" and New Jersey CE "1", before Illinois RD "51" and Missouri RD "29", near Michigan RM "56", before Vermont CP "0", and a short dash before the West North Central RD value, transcribed as "82". Old-typeface digit shapes: the printed "5" frequently resembles a "6" in this scan (e.g. New England All R 571, RC 505, East North Central CB 1,563 and UC 59, Maryland CB 59). All of these are confirmed by the row and column sums, so they are transcribed as 5.
p. 172. Continuation page: no column headings are printed on this crop, so header_rows is empty. The grid has 16 columns (stub + 15 numeric), confirmed by the column rules and by the last row (37,212 ... 223). The crop begins mid-division: the South Atlantic subtotal row covers states (Delaware, Maryland, D.C., Virginia) printed on the preceding page and not visible here. Internal arithmetic is fully consistent once the grid below is used: in every row, column 2 = sum of columns 3-8, column 9 = sum of columns 10-12, and column 1 = column 2 + column 9 + columns 13 + 14 + 15; every column also foots to its division subtotal and to the grand total. No printed value appears to be a misprint. Two cells were glyph-ambiguous in this 1-bit scan, where 3 and 8 are easily confused. Montana, column 8: read as 3 (67+11+3+1+0+3 = 85, the printed row total for column 2; and the Mountain subtotal of 27 requires 3). Louisiana, column 12: read as 13 (176+12+13 = 201, the printed column-9 value; and the West South Central subtotal of 74 requires 13). Both were resolved by two independent checks each; an 8 in either cell would break both. The single footnote line at the foot of the page is clipped by the bottom crop edge — only the upper portion of its letterforms is visible — but it is legible as transcribed. "Appendix A" set vertically in the right margin is a running head and is omitted.
Source image
Source data: U.S. NLRB Annual Reports (public domain). Reconstruction by NLRB Stats Archive. Read by claude-opus-5 (effort max, prompt extract_v1) from the 300-dpi scan; stitched by page. Updated October 2026.