NLRB Stats Archive › Annual Reports › FY1970 › Proceedings Decided by Circuit Courts of Appeals on Petitions for Enforcement and/or Review of Board Orders, Fiscal Year 1970 Compared With 5-Year Cumulative Totals, Fiscal Years 1965 Through 1969
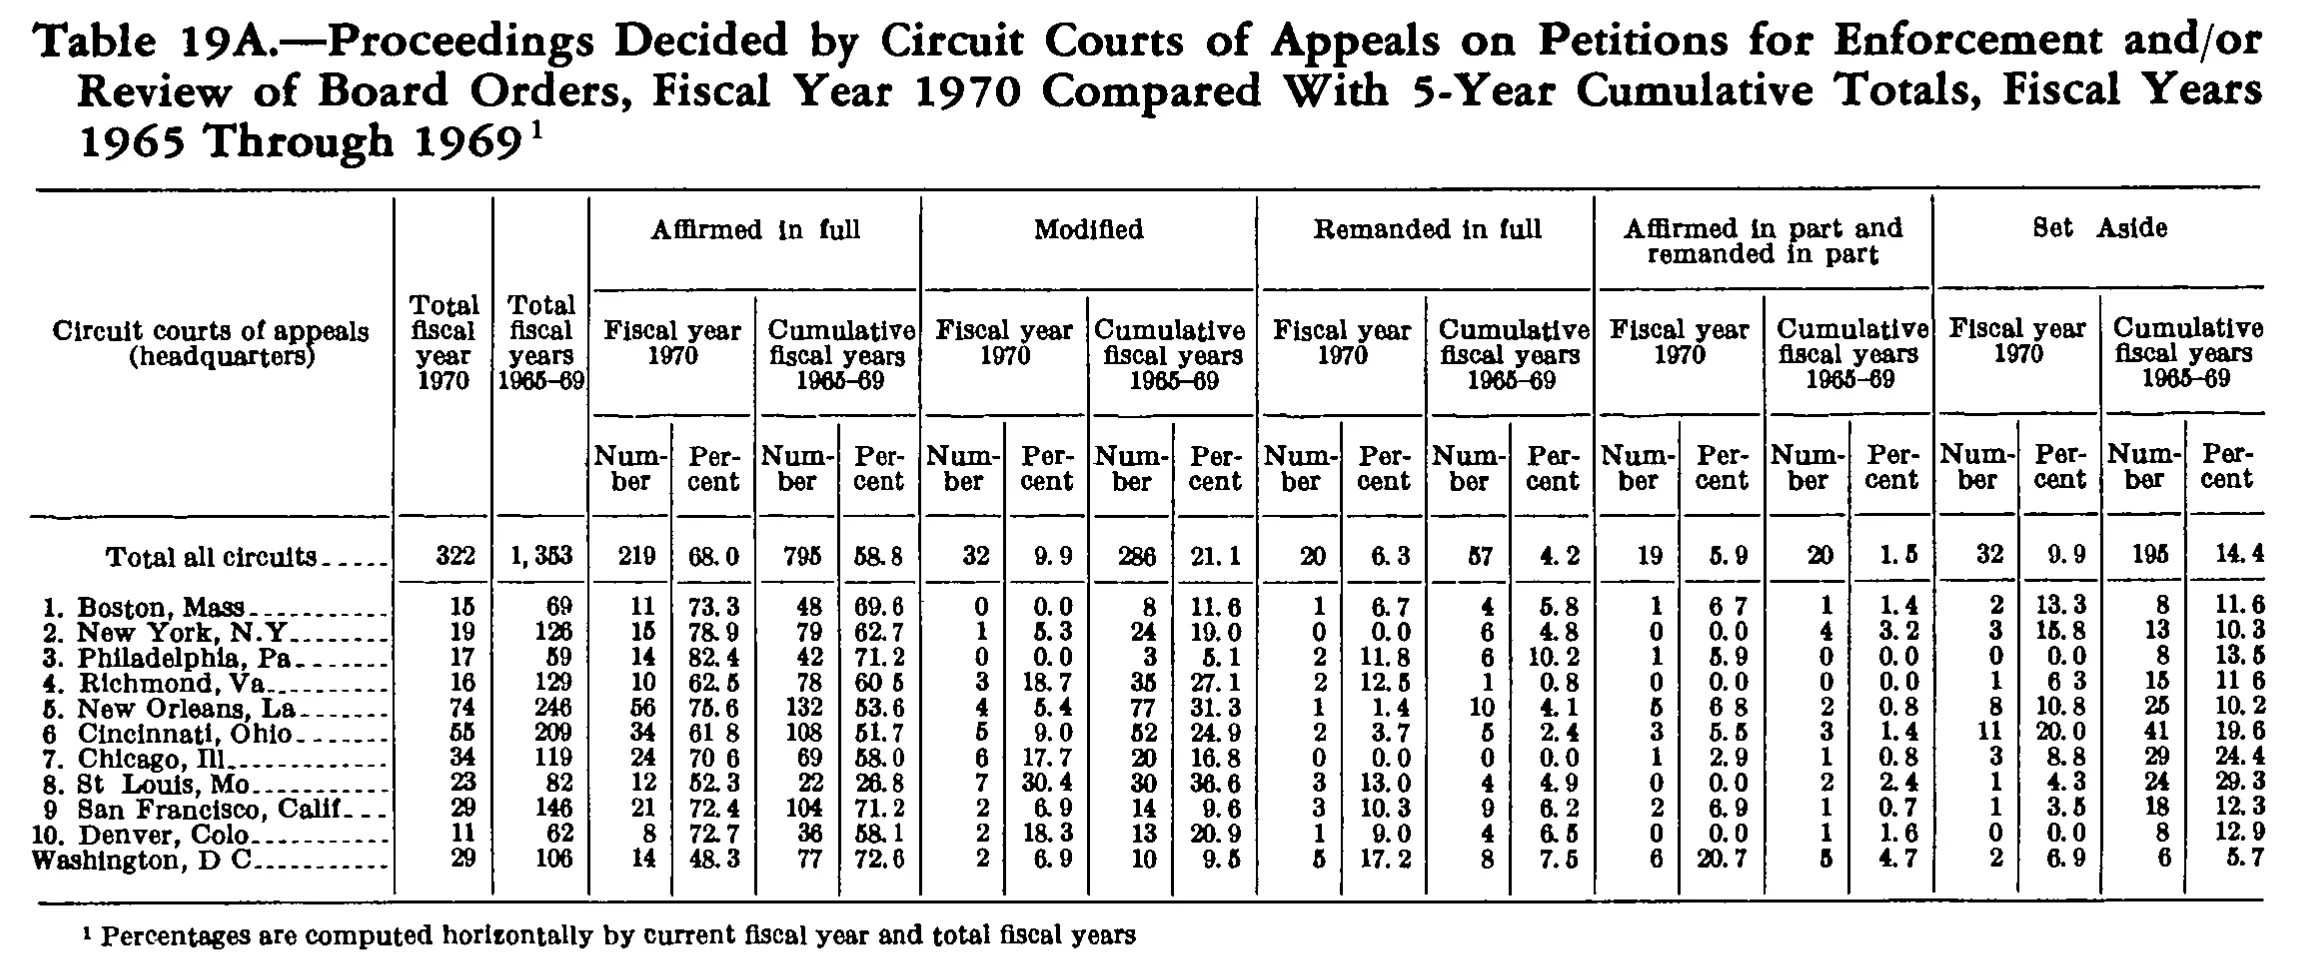
Proceedings Decided by Circuit Courts of Appeals on Petitions for Enforcement and/or Review of Board Orders, Fiscal Year 1970 Compared With 5-Year Cumulative Totals, Fiscal Years 1965 Through 1969
| Circuit courts of appeals (headquarters) | Total fiscal year 1970 | Total fiscal years 1965-69 | Affirmed in full | Modified | Remanded in full | Affirmed in part and remanded in part | Set Aside | |||||||||||||||
|---|---|---|---|---|---|---|---|---|---|---|---|---|---|---|---|---|---|---|---|---|---|---|
| Circuit courts of appeals (headquarters) | Total fiscal year 1970 | Total fiscal years 1965-69 | Fiscal year 1970 | Cumulative fiscal years 1965-69 | Fiscal year 1970 | Cumulative fiscal years 1965-69 | Fiscal year 1970 | Cumulative fiscal years 1965-69 | Fiscal year 1970 | Cumulative fiscal years 1965-69 | Fiscal year 1970 | Cumulative fiscal years 1965-69 | ||||||||||
| Circuit courts of appeals (headquarters) | Total fiscal year 1970 | Total fiscal years 1965-69 | Number | Percent | Number | Percent | Number | Percent | Number | Percent | Number | Percent | Number | Percent | Number | Percent | Number | Percent | Number | Percent | Number | Percent |
| Total all circuits | 322 | 1,353 | 219 | 68.0 | 795 | 58.8 | 32 | 9.9 | 286 | 21.1 | 20 | 6.3 | 57 | 4.2 | 19 | 5.9 | 20 | 1.5 | 32 | 9.9 | 195 | 14.4 |
| 1. Boston, Mass. | 15 | 69 | 11 | 73.3 | 48 | 69.6 | 0 | 0.0 | 8 | 11.6 | 1 | 6.7 | 4 | 5.8 | 1 | 6.7 | 1 | 1.4 | 2 | 13.3 | 8 | 11.6 |
| 2. New York, N.Y. | 19 | 126 | 15 | 78.9 | 79 | 62.7 | 1 | 5.3 | 24 | 19.0 | 0 | 0.0 | 6 | 4.8 | 0 | 0.0 | 4 | 3.2 | 3 | 15.8 | 13 | 10.3 |
| 3. Philadelphia, Pa. | 17 | 59 | 14 | 82.4 | 42 | 71.2 | 0 | 0.0 | 3 | 5.1 | 2 | 11.8 | 6 | 10.2 | 1 | 5.9 | 0 | 0.0 | 0 | 0.0 | 8 | 13.5 |
| 4. Richmond, Va. | 16 | 129 | 10 | 62.5 | 78 | 60.5 | 3 | 18.7 | 35 | 27.1 | 2 | 12.5 | 1 | 0.8 | 0 | 0.0 | 0 | 0.0 | 1 | 6.3 | 15 | 11.6 |
| 5. New Orleans, La. | 74 | 246 | 56 | 75.6 | 132 | 53.6 | 4 | 5.4 | 77 | 31.3 | 1 | 1.4 | 10 | 4.1 | 5 | 6.8 | 2 | 0.8 | 8 | 10.8 | 25 | 10.2 |
| 6. Cincinnati, Ohio | 55 | 209 | 34 | 61.8 | 108 | 51.7 | 5 | 9.0 | 52 | 24.9 | 2 | 3.7 | 5 | 2.4 | 3 | 5.5 | 3 | 1.4 | 11 | 20.0 | 41 | 19.6 |
| 7. Chicago, Ill. | 34 | 119 | 24 | 70.6 | 69 | 58.0 | 6 | 17.7 | 20 | 16.8 | 0 | 0.0 | 0 | 0.0 | 1 | 2.9 | 1 | 0.8 | 3 | 8.8 | 29 | 24.4 |
| 8. St. Louis, Mo. | 23 | 82 | 12 | 52.3 | 22 | 26.8 | 7 | 30.4 | 30 | 36.6 | 3 | 13.0 | 4 | 4.9 | 0 | 0.0 | 2 | 2.4 | 1 | 4.3 | 24 | 29.3 |
| 9. San Francisco, Calif. | 29 | 146 | 21 | 72.4 | 104 | 71.2 | 2 | 6.9 | 14 | 9.6 | 3 | 10.3 | 9 | 6.2 | 2 | 6.9 | 1 | 0.7 | 1 | 3.5 | 18 | 12.3 |
| 10. Denver, Colo. | 11 | 62 | 8 | 72.7 | 36 | 58.1 | 2 | 18.3 | 13 | 20.9 | 1 | 9.0 | 4 | 6.5 | 0 | 0.0 | 1 | 1.6 | 0 | 0.0 | 8 | 12.9 |
| Washington, D.C. | 29 | 106 | 14 | 48.3 | 77 | 72.6 | 2 | 6.9 | 10 | 9.5 | 5 | 17.2 | 8 | 7.5 | 6 | 20.7 | 5 | 4.7 | 2 | 6.9 | 6 | 5.7 |
- 1 Percentages are computed horizontally by current fiscal year and total fiscal years
131 of 131 figures sit in a row or column sum that works out.
Reader’s notes
p. 206. 23 columns: stub, two "Total" columns, then five outcome groups of four columns each (Fiscal year 1970 Number/Percent, Cumulative fiscal years 1965-69 Number/Percent). Scan quality: many decimal points in the percent columns are faint or dropped, so the value prints as two groups separated by a space. I have restored the decimal point in each case, by analogy with the comma rule. Affected cells: Boston "Affirmed in part and remanded in part / Fiscal year 1970 / Percent" ("6 7" -> 6.7); Richmond "Affirmed in full / Cumulative / Percent" ("60 5" -> 60.5), "Set Aside / Fiscal year 1970 / Percent" ("6 3" -> 6.3) and "Set Aside / Cumulative / Percent" ("11 6" -> 11.6); New Orleans "Affirmed in part and remanded in part / Fiscal year 1970 / Percent" ("6 8" -> 6.8); Cincinnati "Affirmed in full / Fiscal year 1970 / Percent" ("61 8" -> 61.8); Chicago "Affirmed in full / Fiscal year 1970 / Percent" ("70 6" -> 70.6). The same fading affects periods in the stub: the image shows "6 Cincinnati, Ohio", "9 San Francisco, Calif", "8. St Louis, Mo", "Washington, D C"; I have written the ordinary abbreviation points (6., 9., St., D.C.). The last row carries no circuit number in the printed stub. Verification: every row's five Number cells sum to that row's Total for both the fiscal-year-1970 and the cumulative panels, and every Number column sums to the "Total all circuits" line, in all cases exactly. The horizontal percentages sum to 100.0 in nearly every row (Philadelphia cumulative sums to 100.1), which is consistent with the rounding being nudged to force a 100.0 row total; this is why a few percentages differ by 0.1 from the unrounded quotient (e.g. St. Louis 52.3 for 12/23 = 52.17, Denver 18.3 for 2/11 = 18.18, Cincinnati 3.7 for 2/55 = 3.64). These are transcribed as printed, not corrected.
Source image
Source data: U.S. NLRB Annual Reports (public domain). Reconstruction by NLRB Stats Archive. Read by claude-opus-5 (effort max, prompt extract_v1) from the 300-dpi scan; stitched by page. Updated October 2026.