NLRB Stats Archive › Annual Reports › FY1970 › Decisions issued
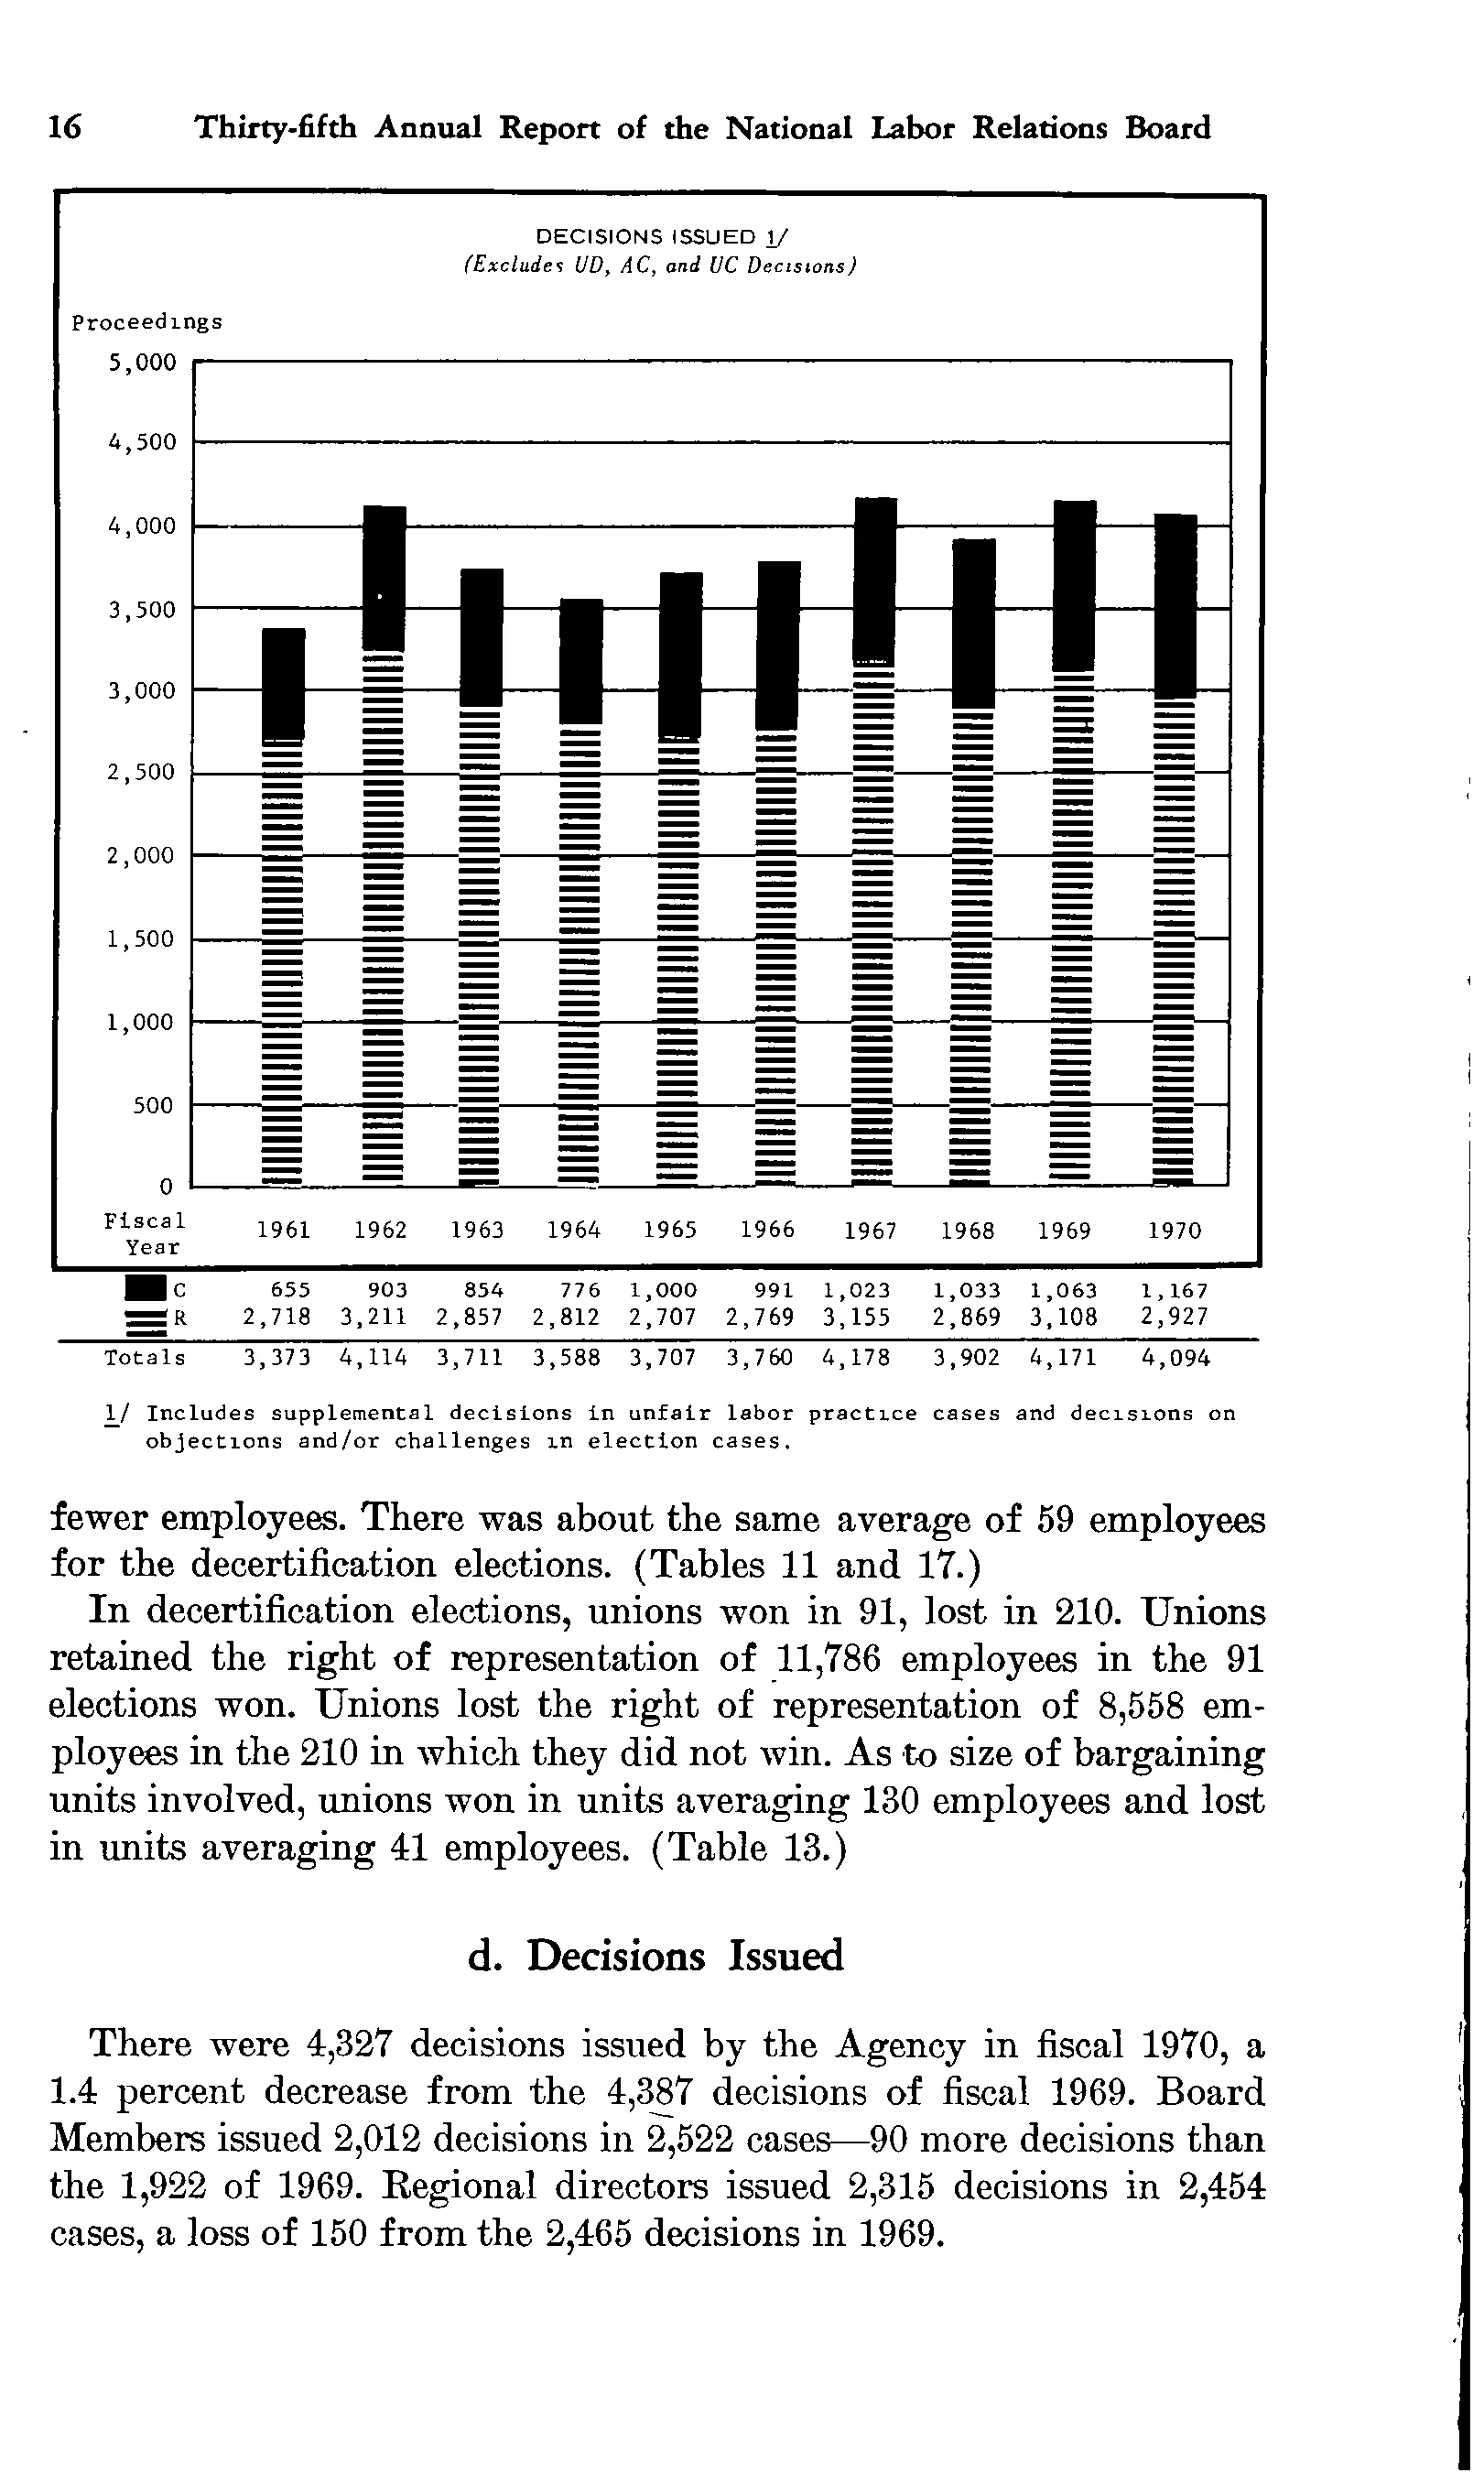
Decisions issued
| Fiscal Year | 1961 | 1962 | 1963 | 1964 | 1965 | 1966 | 1967 | 1968 | 1969 | 1970 |
|---|---|---|---|---|---|---|---|---|---|---|
| C | 655 | 903 | 854 | 776 | 1,000 | 991 | 1,023 | 1,033 | 1,063 | 1,167 |
| R | 2,718 | 3,211 | 2,857 | 2,812 | 2,707 | 2,769 | 3,155 | 2,869 | 3,108 | 2,927 |
| Totals | 3,373 | 4,114 | 3,711 | 3,588 | 3,707 | 3,760 | 4,178 | 3,902 | 4,171 | 4,094 |
- 1/ Includes supplemental decisions in unfair labor practice cases and decisions on objections and/or challenges in election cases.
30 of 30 figures sit in a row or column sum that works out.
Reader’s notes
p. 27. The crop is a stacked bar chart (titled \"DECISIONS ISSUED 1/ (Excludes UD, AC, and UC Decisions)\", y-axis labelled \"Proceedings\", scaled 0 to 5,000) with a small data table printed beneath the plot; only that data table is transcribed. The stub heading \"Fiscal Year\" is printed on two lines at the left of the year row, which doubles as the chart's x-axis labels. The row labels \"C\" and \"R\" are each preceded by a legend swatch (solid black for C, horizontally hatched for R); the swatches are not transcribed. The \"Totals\" row is separated from the C and R rows by a horizontal rule. All ten printed totals equal C plus R as printed, so no internal inconsistency was found. The footnote marker 1/ in the chart title is printed underlined rather than raised, in the typewritten style of this figure.
Source image
Source data: U.S. NLRB Annual Reports (public domain). Reconstruction by NLRB Stats Archive. Read by claude-opus-5 (effort max, prompt extract_v1) from the 300-dpi scan; stitched by page. Updated October 2026.