NLRB Stats Archive › Annual Reports › FY1970 › Time required to process representation cases
Time required to process representation cases
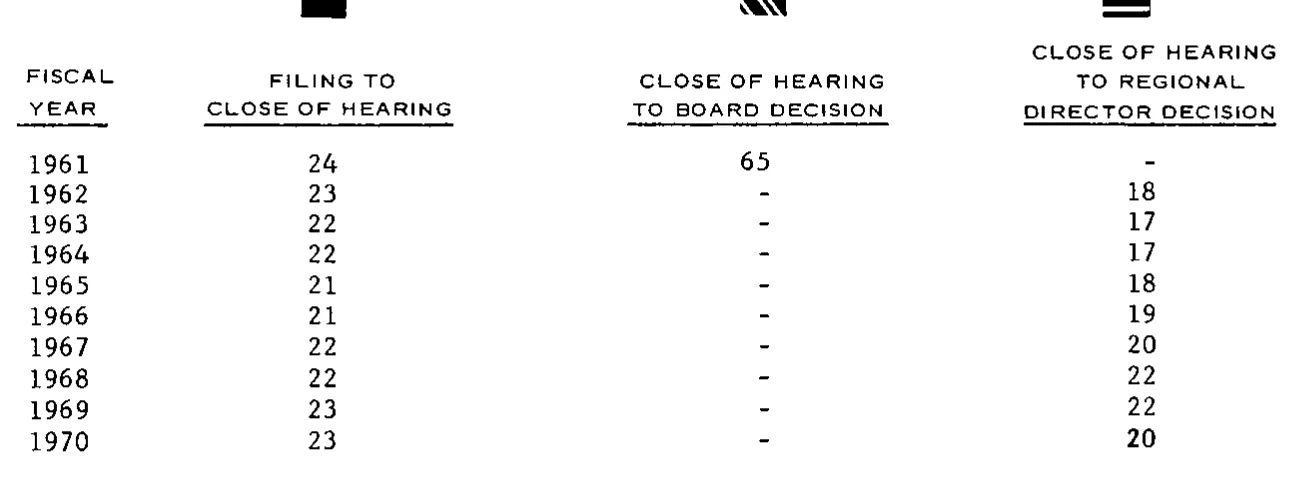
| FISCAL YEAR | FILING TO CLOSE OF HEARING | CLOSE OF HEARING TO BOARD DECISION | CLOSE OF HEARING TO REGIONAL DIRECTOR DECISION |
|---|---|---|---|
| 1961 | 24 | 65 | |
| 1962 | 23 | 18 | |
| 1963 | 22 | 17 | |
| 1964 | 22 | 17 | |
| 1965 | 21 | 18 | |
| 1966 | 21 | 19 | |
| 1967 | 22 | 20 | |
| 1968 | 22 | 22 | |
| 1969 | 23 | 22 | |
| 1970 | 23 | 20 |
0 of 20 figures sit in a row or column sum that works out.
Reader’s notes
p. 23. This is the data table printed beneath a chart (median days to process representation cases); the top edge of the crop clips three small legend symbols (a solid black bar, a hatched bar, and a double-rule bar) that sit above the three data-column headings and key them to the chart above. No chart title, caption or footnotes are visible in the crop. Four printed columns, confirmed by the four underscored headings and the alignment of the figures. Each "-" cell is a single short centered dash (a nil / not-applicable marker, not a rule of dashes and not a minus sign on a number): column "CLOSE OF HEARING TO BOARD DECISION" for 1962-1970, and column "CLOSE OF HEARING TO REGIONAL DIRECTOR DECISION" for 1961 — reflecting the 1961 delegation of representation-case decisions to regional directors. If dashes are to be treated as empty cells in downstream use, those 10 cells are the ones to blank. All digits are clear; the 1970 figure 20 in the last column is printed in a slightly heavier face than the rows above it but is legible.
Source image
Source data: U.S. NLRB Annual Reports (public domain). Reconstruction by NLRB Stats Archive. Read by claude-opus-5 (effort max, prompt extract_v1) from the 300-dpi scan; stitched by page. Updated October 2026.