NLRB Stats Archive › Annual Reports › FY1970 › Unfair labor practice merit factor
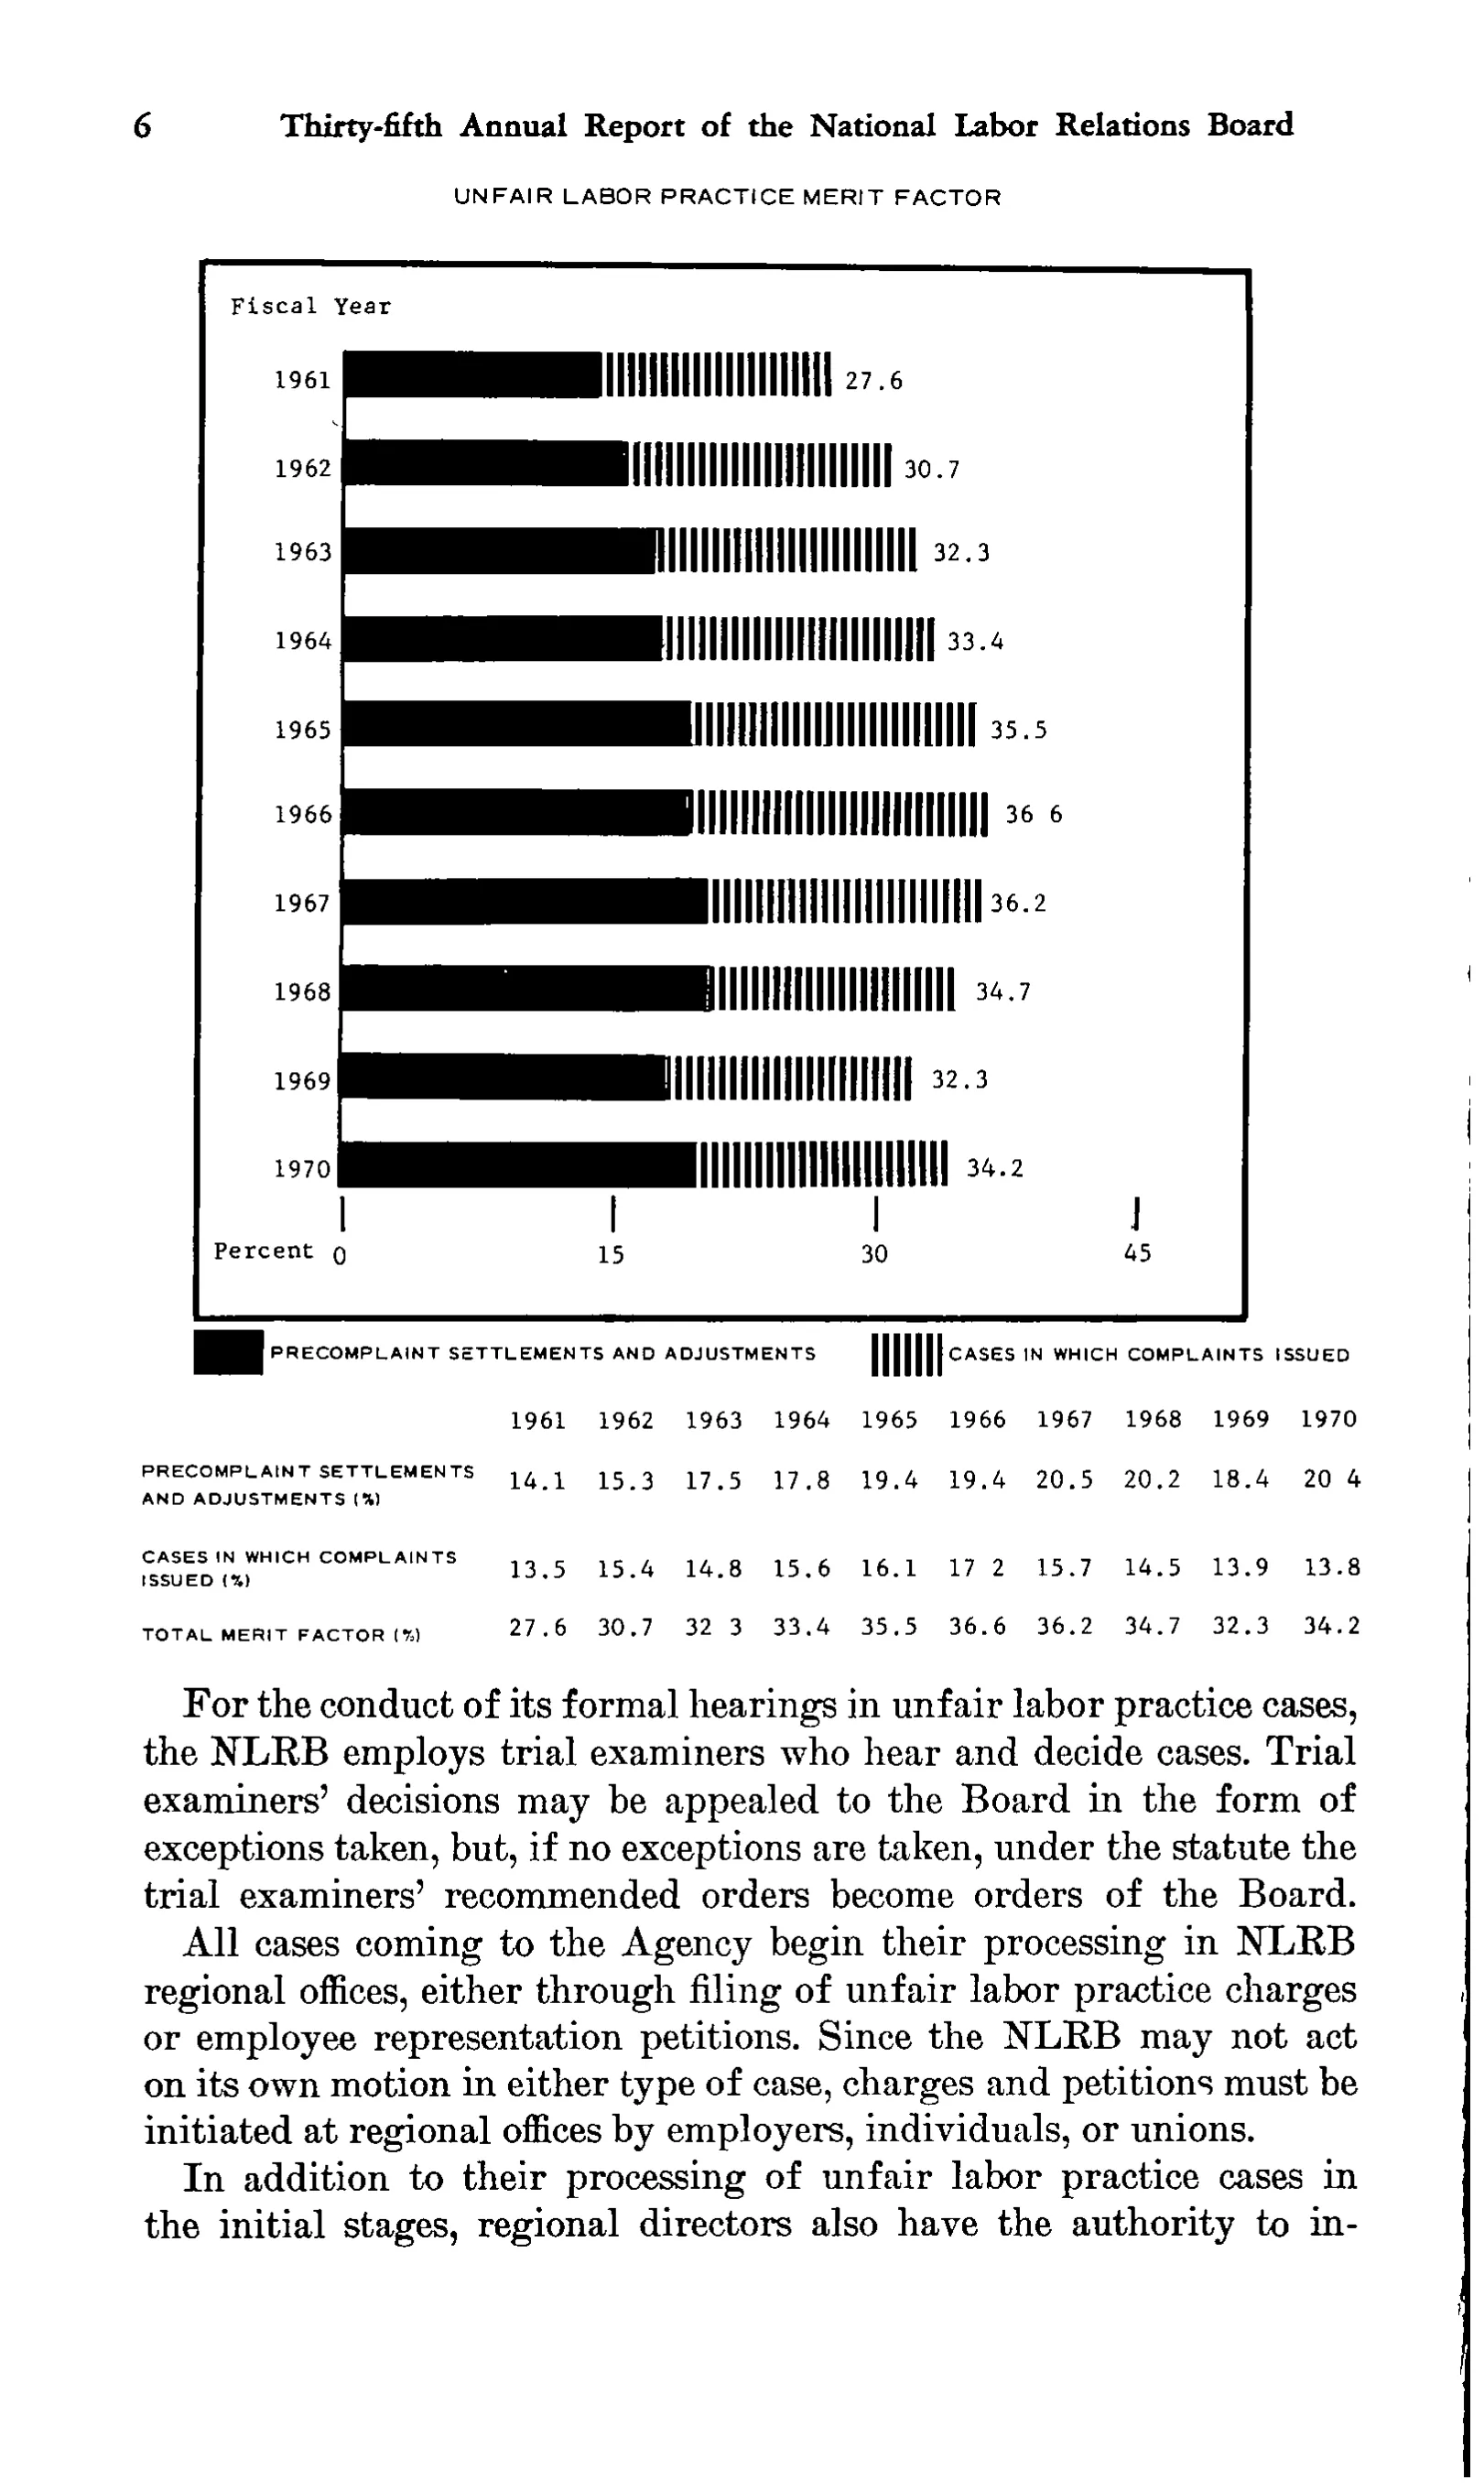
Unfair labor practice merit factor
| 1961 | 1962 | 1963 | 1964 | 1965 | 1966 | 1967 | 1968 | 1969 | 1970 | |
|---|---|---|---|---|---|---|---|---|---|---|
| PRECOMPLAINT SETTLEMENTS AND ADJUSTMENTS (%) | 14.1 | 15.3 | 17.5 | 17.8 | 19.4 | 19.4 | 20.5 | 20.2 | 18.4 | 20.4 |
| CASES IN WHICH COMPLAINTS ISSUED (%) | 13.5 | 15.4 | 14.8 | 15.6 | 16.1 | 17.2 | 15.7 | 14.5 | 13.9 | 13.8 |
| TOTAL MERIT FACTOR (%) | 27.6 | 30.7 | 32.3 | 33.4 | 35.5 | 36.6 | 36.2 | 34.7 | 32.3 | 34.2 |
Reader’s notes
p. 17. The crop is a chart page ("UNFAIR LABOR PRACTICE MERIT FACTOR") consisting of a horizontal bar chart for fiscal years 1961-1970 plus a small data table printed beneath it; the data table is what is transcribed here. The chart itself is not transcribed: it has a "Fiscal Year" stub listing 1961-1970, a percent axis marked 0, 15, 30, 45, two-segment bars, and a value printed at the end of each bar (27.6, 30.7, 32.3, 33.4, 35.5, 36 6, 36.2, 34.7, 32.3, 34.2) that duplicates the TOTAL MERIT FACTOR row. Between the chart and the table is a legend line reading "PRECOMPLAINT SETTLEMENTS AND ADJUSTMENTS" (solid black key) and "CASES IN WHICH COMPLAINTS ISSUED" (hatched key); it is a key, not a table row or footnote, so it is omitted. The year heading row has no printed stub heading, so cell 0 of the header is empty. Three table cells are printed with the decimal point dropped or invisible in this scan: PRECOMPLAINT SETTLEMENTS AND ADJUSTMENTS (%) under 1970 reads "20 4", CASES IN WHICH COMPLAINTS ISSUED (%) under 1966 reads "17 2", and TOTAL MERIT FACTOR (%) under 1963 reads "32 3"; each is rendered here with the decimal point (20.4, 17.2, 32.3) because every other value in the table carries one tenth and the column sums confirm it (19.4+17.2=36.6; 17.5+14.8=32.3; 20.4+13.8=34.2). The chart value for 1966 likewise reads "36 6" for 36.6. The two multi-line row labels are joined: "PRECOMPLAINT SETTLEMENTS / AND ADJUSTMENTS (%)" and "CASES IN WHICH COMPLAINTS / ISSUED (%)". All ten columns add exactly to the printed totals, so no misprint is suspected in the figures themselves.
Source image
Source data: U.S. NLRB Annual Reports (public domain). Reconstruction by NLRB Stats Archive. Read by claude-opus-5 (effort max, prompt extract_v1) from the 300-dpi scan; stitched by page. Updated October 2026.