NLRB Stats Archive › Annual Reports › FY1969 › Proceeding Decided by Circuit Courts of Appeals on Petitions for Enforcement and/or Review of Board Orders, Fiscal Year 1969 compared with 5-Year Cumulative Totals, Fiscal Years 1964 through 1968
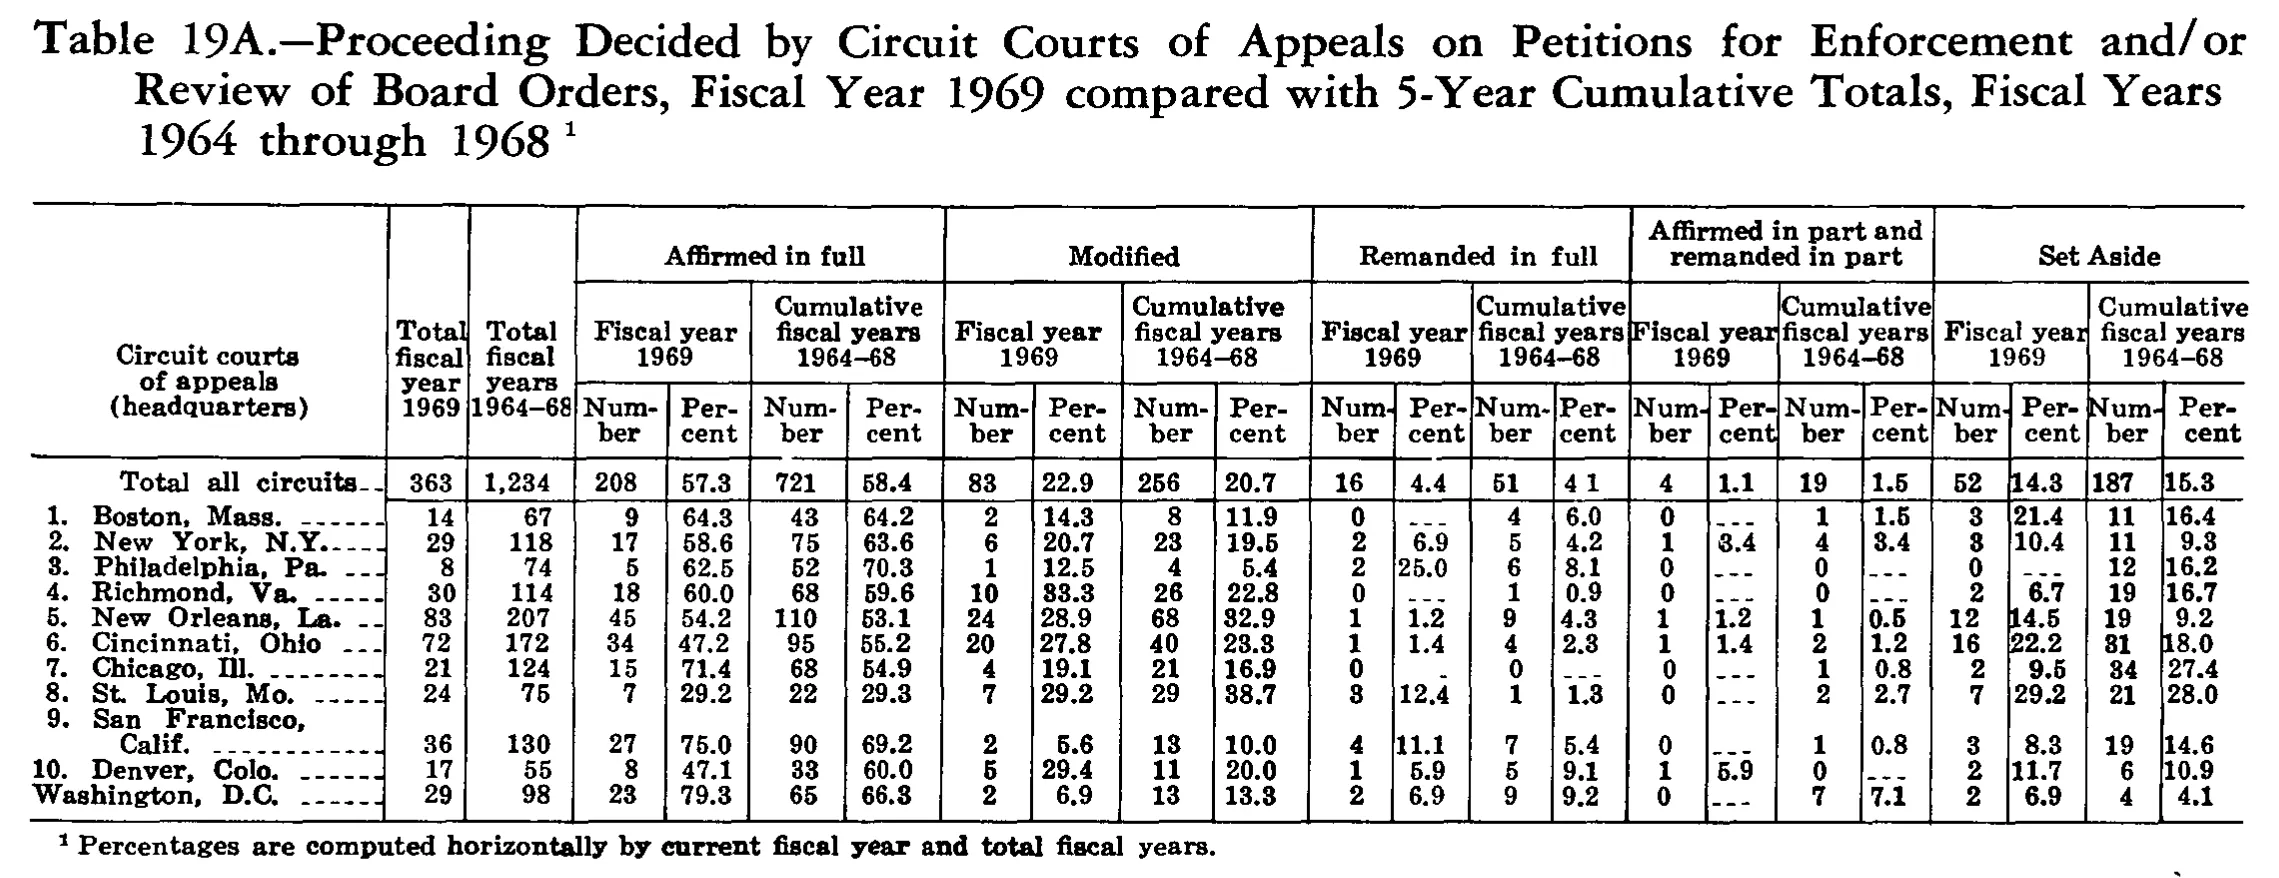
Proceeding Decided by Circuit Courts of Appeals on Petitions for Enforcement and/or Review of Board Orders, Fiscal Year 1969 compared with 5-Year Cumulative Totals, Fiscal Years 1964 through 1968
| Circuit courts of appeals (headquarters) | Total fiscal year 1969 | Total fiscal years 1964-68 | Affirmed in full | Modified | Remanded in full | Affirmed in part and remanded in part | Set Aside | |||||||||||||||
|---|---|---|---|---|---|---|---|---|---|---|---|---|---|---|---|---|---|---|---|---|---|---|
| Circuit courts of appeals (headquarters) | Total fiscal year 1969 | Total fiscal years 1964-68 | Fiscal year 1969 | Cumulative fiscal years 1964-68 | Fiscal year 1969 | Cumulative fiscal years 1964-68 | Fiscal year 1969 | Cumulative fiscal years 1964-68 | Fiscal year 1969 | Cumulative fiscal years 1964-68 | Fiscal year 1969 | Cumulative fiscal years 1964-68 | ||||||||||
| Circuit courts of appeals (headquarters) | Total fiscal year 1969 | Total fiscal years 1964-68 | Number | Percent | Number | Percent | Number | Percent | Number | Percent | Number | Percent | Number | Percent | Number | Percent | Number | Percent | Number | Percent | Number | Percent |
| Total all circuits | 363 | 1,234 | 208 | 57.3 | 721 | 58.4 | 83 | 22.9 | 256 | 20.7 | 16 | 4.4 | 51 | 4.1 | 4 | 1.1 | 19 | 1.5 | 52 | 14.3 | 187 | 15.3 |
| 1. Boston, Mass. | 14 | 67 | 9 | 64.3 | 43 | 64.2 | 2 | 14.3 | 8 | 11.9 | 0 | 4 | 6.0 | 0 | 1 | 1.5 | 3 | 21.4 | 11 | 16.4 | ||
| 2. New York, N.Y. | 29 | 118 | 17 | 58.6 | 75 | 63.6 | 6 | 20.7 | 23 | 19.5 | 2 | 6.9 | 5 | 4.2 | 1 | 3.4 | 4 | 3.4 | 3 | 10.4 | 11 | 9.3 |
| 3. Philadelphia, Pa. | 8 | 74 | 5 | 62.5 | 52 | 70.3 | 1 | 12.5 | 4 | 5.4 | 2 | 25.0 | 6 | 8.1 | 0 | 0 | 0 | 12 | 16.2 | |||
| 4. Richmond, Va. | 30 | 114 | 18 | 60.0 | 68 | 59.6 | 10 | 33.3 | 26 | 22.8 | 0 | 1 | 0.9 | 0 | 0 | 2 | 6.7 | 19 | 16.7 | |||
| 5. New Orleans, La. | 83 | 207 | 45 | 54.2 | 110 | 53.1 | 24 | 28.9 | 68 | 32.9 | 1 | 1.2 | 9 | 4.3 | 1 | 1.2 | 1 | 0.5 | 12 | 14.5 | 19 | 9.2 |
| 6. Cincinnati, Ohio | 72 | 172 | 34 | 47.2 | 95 | 55.2 | 20 | 27.8 | 40 | 23.3 | 1 | 1.4 | 4 | 2.3 | 1 | 1.4 | 2 | 1.2 | 16 | 22.2 | 31 | 18.0 |
| 7. Chicago, Ill. | 21 | 124 | 15 | 71.4 | 68 | 54.9 | 4 | 19.1 | 21 | 16.9 | 0 | 0 | 0 | 1 | 0.8 | 2 | 9.5 | 34 | 27.4 | |||
| 8. St. Louis, Mo. | 24 | 75 | 7 | 29.2 | 22 | 29.3 | 7 | 29.2 | 29 | 38.7 | 3 | 12.4 | 1 | 1.3 | 0 | 2 | 2.7 | 7 | 29.2 | 21 | 28.0 | |
| 9. San Francisco, Calif. | 36 | 130 | 27 | 75.0 | 90 | 69.2 | 2 | 5.6 | 13 | 10.0 | 4 | 11.1 | 7 | 5.4 | 0 | 1 | 0.8 | 3 | 8.3 | 19 | 14.6 | |
| 10. Denver, Colo. | 17 | 55 | 8 | 47.1 | 33 | 60.0 | 5 | 29.4 | 11 | 20.0 | 1 | 5.9 | 5 | 9.1 | 1 | 5.9 | 0 | 2 | 11.7 | 6 | 10.9 | |
| Washington, D.C. | 29 | 98 | 23 | 79.3 | 65 | 66.3 | 2 | 6.9 | 13 | 13.3 | 2 | 6.9 | 9 | 9.2 | 0 | 7 | 7.1 | 2 | 6.9 | 4 | 4.1 | |
- 1 Percentages are computed horizontally by current fiscal year and total fiscal years.
129 of 129 figures sit in a row or column sum that works out.
Reader’s notes
p. 248. 23 columns: stub, two "Total" columns, then five disposition groups (Affirmed in full; Modified; Remanded in full; Affirmed in part and remanded in part; Set Aside), each with Number/Percent for fiscal year 1969 and for cumulative fiscal years 1964-68. Dash cells: wherever a Number cell is 0 the matching Percent cell carries a short dash rule ("---"); these are transcribed as "" per the rules. Verification: every Number column sums exactly to the printed "Total all circuits" figure (363; 1,234; 208; 721; 83; 256; 16; 51; 4; 19; 52; 187), and each circuit's five Number cells sum to its own row total, so the digits in the Number columns are well supported. Doubtful / ambiguous cells (the scan confuses 3 and 8 at this resolution; in each case the horizontal percentage and/or the column sum settles the reading): - "4. Richmond, Va.", Modified / fiscal year 1969 / Percent: glyph could read 83.3, transcribed 33.3 (10 of 30). - "6. Cincinnati, Ohio", Modified / cumulative 1964-68 / Percent: glyph could read 23.8, transcribed 23.3 (40 of 172). - "6. Cincinnati, Ohio", Set Aside / cumulative 1964-68 / Number: glyph could read 81, transcribed 31; the column then sums to the printed 187. - "Total all circuits", Remanded in full / cumulative 1964-68 / Percent: the decimal point is nearly lost in the scan, printing as "4 1"; transcribed 4.1 (51 of 1,234). - "3. Philadelphia, Pa.", Affirmed in part and remanded in part / fiscal year 1969 / Percent: a faint mark resembling "3.4" sits in this cell, but the Number is 0 and the row already sums to 8 without it; treated as a printing artifact over the usual dash rule and transcribed as "". - "7. Chicago, Ill.", Remanded in full / fiscal year 1969 / Percent: a faint speck rather than a clean dash rule; transcribed "" like the other zero rows. Apparent misprints, transcribed as printed: - "8. St. Louis, Mo.", Remanded in full / fiscal year 1969 / Percent reads 12.4; 3 of 24 is 12.5, and the row's percentages then total 100.0 only with 12.4. - "2. New York, N.Y.", Set Aside / fiscal year 1969 / Percent reads 10.4; 3 of 29 is 10.3. - "7. Chicago, Ill.": Affirmed in full / cumulative Percent reads 54.9 (68 of 124 is 54.8) and Modified / fiscal year 1969 Percent reads 19.1 (4 of 21 is 19.0). - "10. Denver, Colo.", Set Aside / fiscal year 1969 / Percent reads 11.7 (2 of 17 is 11.8). - "Total all circuits", Set Aside / cumulative Percent reads 15.3 (187 of 1,234 is 15.2). The last row, "Washington, D.C.", carries no list number in the stub, unlike the ten numbered circuits above it.
Source image
Source data: U.S. NLRB Annual Reports (public domain). Reconstruction by NLRB Stats Archive. Read by claude-opus-5 (effort max, prompt extract_v1) from the 300-dpi scan; stitched by page. Updated October 2026.