NLRB Stats Archive › Annual Reports › FY1969 › Distribution of Unfair Labor Practice Situations Received, By Number of Employees in Establishment, Fiscal Year 1969
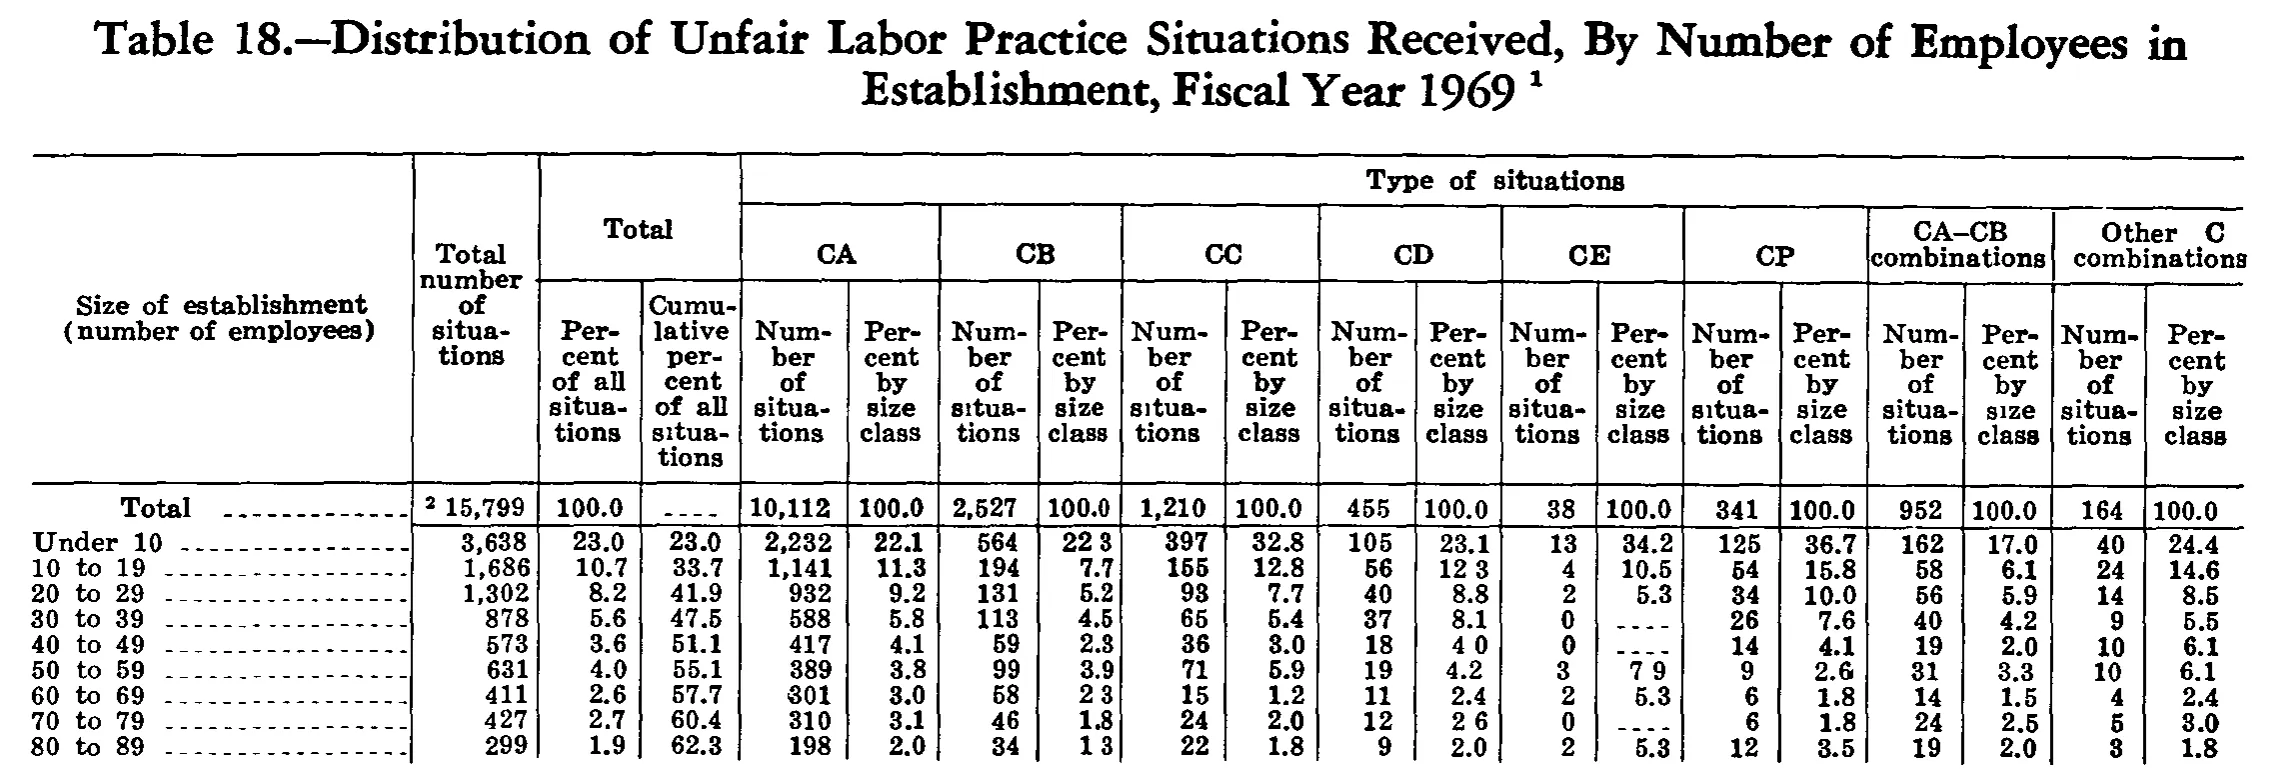
Distribution of Unfair Labor Practice Situations Received, By Number of Employees in Establishment, Fiscal Year 1969
Stitched from pp. 245–246.
| Size of establishment (number of employees) | Total number of situations | Total | Type of situations | ||||||||||||||||
|---|---|---|---|---|---|---|---|---|---|---|---|---|---|---|---|---|---|---|---|
| Size of establishment (number of employees) | Total number of situations | Total | CA | CB | CC | CD | CE | CP | CA–CB combinations | Other C combinations | |||||||||
| Size of establishment (number of employees) | Total number of situations | Percent of all situations | Cumulative percent of all situations | Number of situations | Percent by size class | Number of situations | Percent by size class | Number of situations | Percent by size class | Number of situations | Percent by size class | Number of situations | Percent by size class | Number of situations | Percent by size class | Number of situations | Percent by size class | Number of situations | Percent by size class |
| Total | 15,799 | 100.0 | 10,112 | 100.0 | 2,527 | 100.0 | 1,210 | 100.0 | 455 | 100.0 | 38 | 100.0 | 341 | 100.0 | 952 | 100.0 | 164 | 100.0 | |
| Under 10 | 3,638 | 23.0 | 23.0 | 2,232 | 22.1 | 564 | 22.3 | 397 | 32.8 | 105 | 23.1 | 13 | 34.2 | 125 | 36.7 | 162 | 17.0 | 40 | 24.4 |
| 10 to 19 | 1,686 | 10.7 | 33.7 | 1,141 | 11.3 | 194 | 7.7 | 155 | 12.8 | 56 | 12.3 | 4 | 10.5 | 54 | 15.8 | 58 | 6.1 | 24 | 14.6 |
| 20 to 29 | 1,302 | 8.2 | 41.9 | 932 | 9.2 | 131 | 5.2 | 93 | 7.7 | 40 | 8.8 | 2 | 5.3 | 34 | 10.0 | 56 | 5.9 | 14 | 8.5 |
| 30 to 39 | 878 | 5.6 | 47.5 | 588 | 5.8 | 113 | 4.5 | 65 | 5.4 | 37 | 8.1 | 0 | 26 | 7.6 | 40 | 4.2 | 9 | 5.5 | |
| 40 to 49 | 573 | 3.6 | 51.1 | 417 | 4.1 | 59 | 2.3 | 36 | 3.0 | 18 | 4.0 | 0 | 14 | 4.1 | 19 | 2.0 | 10 | 6.1 | |
| 50 to 59 | 631 | 4.0 | 55.1 | 389 | 3.8 | 99 | 3.9 | 71 | 5.9 | 19 | 4.2 | 3 | 7.9 | 9 | 2.6 | 31 | 3.3 | 10 | 6.1 |
| 60 to 69 | 411 | 2.6 | 57.7 | 301 | 3.0 | 58 | 2.3 | 15 | 1.2 | 11 | 2.4 | 2 | 5.3 | 6 | 1.8 | 14 | 1.5 | 4 | 2.4 |
| 70 to 79 | 427 | 2.7 | 60.4 | 310 | 3.1 | 46 | 1.8 | 24 | 2.0 | 12 | 2.6 | 0 | 6 | 1.8 | 24 | 2.5 | 5 | 3.0 | |
| 80 to 89 | 299 | 1.9 | 62.3 | 198 | 2.0 | 34 | 1.3 | 22 | 1.8 | 9 | 2.0 | 2 | 5.3 | 12 | 3.5 | 19 | 2.0 | 3 | 1.8 |
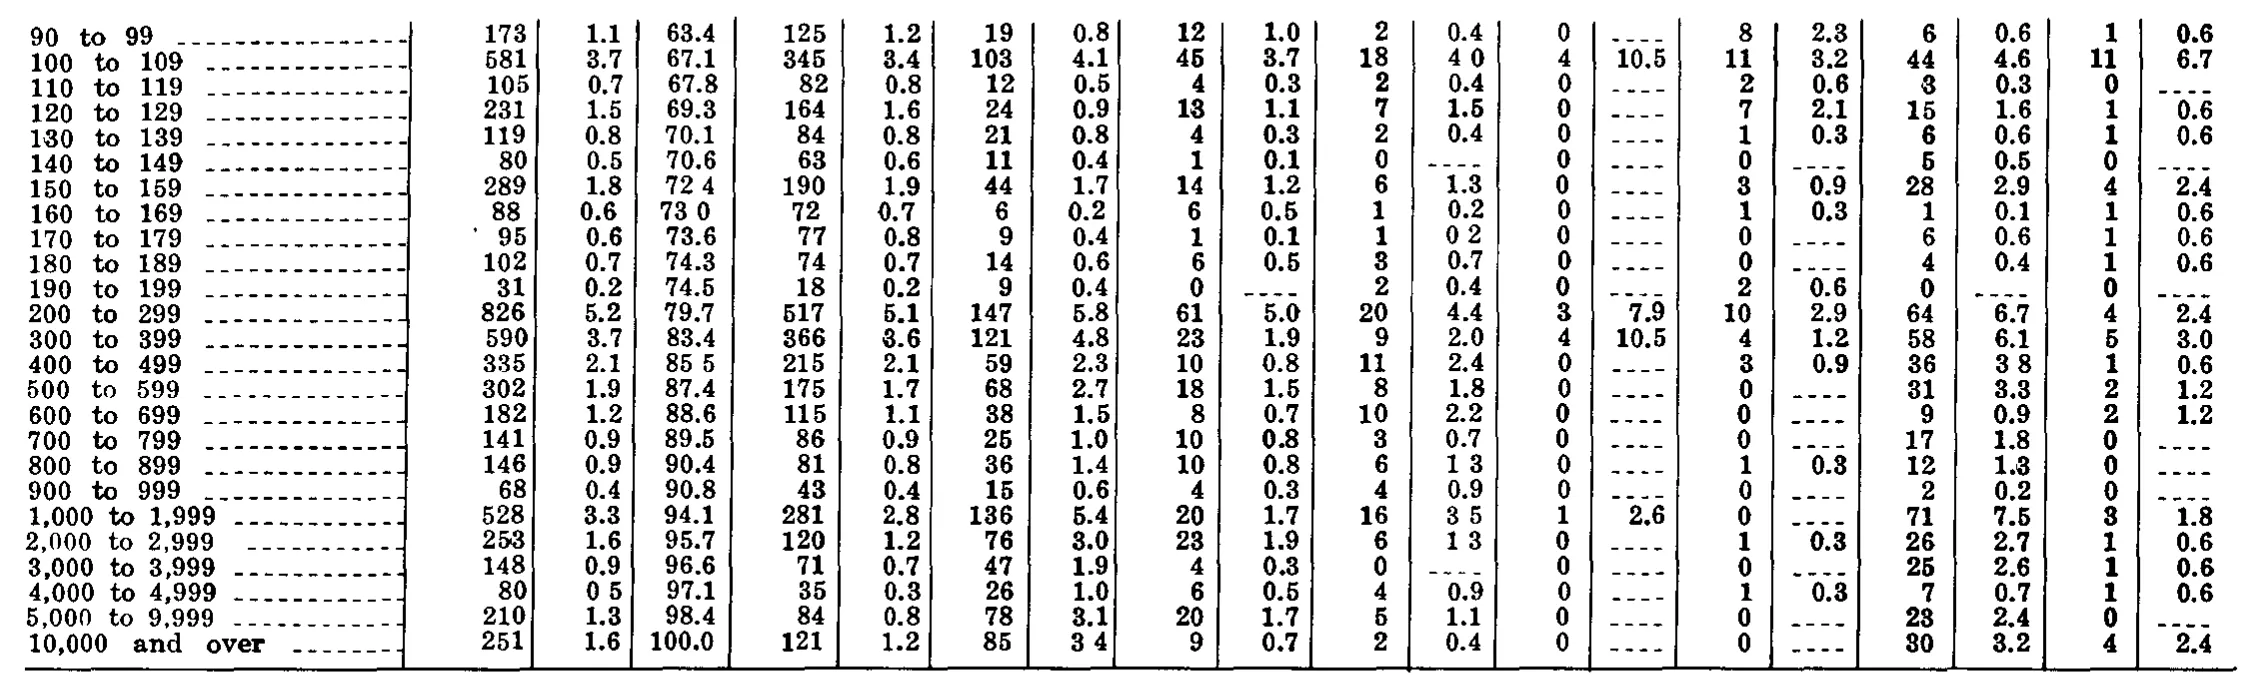
| 90 to 99 | 173 | 1.1 | 63.4 | 125 | 1.2 | 19 | 0.8 | 12 | 1.0 | 2 | 0.4 | 0 | 8 | 2.3 | 6 | 0.6 | 1 | 0.6 | |
| 100 to 109 | 581 | 3.7 | 67.1 | 345 | 3.4 | 103 | 4.1 | 45 | 3.7 | 18 | 4.0 | 4 | 10.5 | 11 | 3.2 | 44 | 4.6 | 11 | 6.7 |
| 110 to 119 | 105 | 0.7 | 67.8 | 82 | 0.8 | 12 | 0.5 | 4 | 0.3 | 2 | 0.4 | 0 | 2 | 0.6 | 3 | 0.3 | 0 | ||
| 120 to 129 | 231 | 1.5 | 69.3 | 164 | 1.6 | 24 | 0.9 | 13 | 1.1 | 7 | 1.5 | 0 | 7 | 2.1 | 15 | 1.6 | 1 | 0.6 | |
| 130 to 139 | 119 | 0.8 | 70.1 | 84 | 0.8 | 21 | 0.8 | 4 | 0.3 | 2 | 0.4 | 0 | 1 | 0.3 | 6 | 0.6 | 1 | 0.6 | |
| 140 to 149 | 80 | 0.5 | 70.6 | 63 | 0.6 | 11 | 0.4 | 1 | 0.1 | 0 | 0 | 0 | 5 | 0.5 | 0 | ||||
| 150 to 159 | 289 | 1.8 | 72.4 | 190 | 1.9 | 44 | 1.7 | 14 | 1.2 | 6 | 1.3 | 0 | 3 | 0.9 | 28 | 2.9 | 4 | 2.4 | |
| 160 to 169 | 88 | 0.6 | 73.0 | 72 | 0.7 | 6 | 0.2 | 6 | 0.5 | 1 | 0.2 | 0 | 1 | 0.3 | 1 | 0.1 | 1 | 0.6 | |
| 170 to 179 | 95 | 0.6 | 73.6 | 77 | 0.8 | 9 | 0.4 | 1 | 0.1 | 1 | 0.2 | 0 | 0 | 6 | 0.6 | 1 | 0.6 | ||
| 180 to 189 | 102 | 0.7 | 74.3 | 74 | 0.7 | 14 | 0.6 | 6 | 0.5 | 3 | 0.7 | 0 | 0 | 4 | 0.4 | 1 | 0.6 | ||
| 190 to 199 | 31 | 0.2 | 74.5 | 18 | 0.2 | 9 | 0.4 | 0 | 2 | 0.4 | 0 | 2 | 0.6 | 0 | 0 | ||||
| 200 to 299 | 826 | 5.2 | 79.7 | 517 | 5.1 | 147 | 5.8 | 61 | 5.0 | 20 | 4.4 | 3 | 7.9 | 10 | 2.9 | 64 | 6.7 | 4 | 2.4 |
| 300 to 399 | 590 | 3.7 | 83.4 | 366 | 3.6 | 121 | 4.8 | 23 | 1.9 | 9 | 2.0 | 4 | 10.5 | 4 | 1.2 | 58 | 6.1 | 5 | 3.0 |
| 400 to 499 | 335 | 2.1 | 85.5 | 215 | 2.1 | 59 | 2.3 | 10 | 0.8 | 11 | 2.4 | 0 | 3 | 0.9 | 36 | 3.8 | 1 | 0.6 | |
| 500 to 599 | 302 | 1.9 | 87.4 | 175 | 1.7 | 68 | 2.7 | 18 | 1.5 | 8 | 1.8 | 0 | 0 | 31 | 3.3 | 2 | 1.2 | ||
| 600 to 699 | 182 | 1.2 | 88.6 | 115 | 1.1 | 38 | 1.5 | 8 | 0.7 | 10 | 2.2 | 0 | 0 | 9 | 0.9 | 2 | 1.2 | ||
| 700 to 799 | 141 | 0.9 | 89.5 | 86 | 0.9 | 25 | 1.0 | 10 | 0.8 | 3 | 0.7 | 0 | 0 | 17 | 1.8 | 0 | |||
| 800 to 899 | 146 | 0.9 | 90.4 | 81 | 0.8 | 36 | 1.4 | 10 | 0.8 | 6 | 1.3 | 0 | 1 | 0.3 | 12 | 1.3 | 0 | ||
| 900 to 999 | 68 | 0.4 | 90.8 | 43 | 0.4 | 15 | 0.6 | 4 | 0.3 | 4 | 0.9 | 0 | 0 | 2 | 0.2 | 0 | |||
| 1,000 to 1,999 | 528 | 3.3 | 94.1 | 281 | 2.8 | 136 | 5.4 | 20 | 1.7 | 16 | 3.5 | 1 | 2.6 | 0 | 71 | 7.5 | 3 | 1.8 | |
| 2,000 to 2,999 | 253 | 1.6 | 95.7 | 120 | 1.2 | 76 | 3.0 | 23 | 1.9 | 6 | 1.3 | 0 | 1 | 0.3 | 26 | 2.7 | 1 | 0.6 | |
| 3,000 to 3,999 | 148 | 0.9 | 96.6 | 71 | 0.7 | 47 | 1.9 | 4 | 0.3 | 0 | 0 | 0 | 25 | 2.6 | 1 | 0.6 | |||
| 4,000 to 4,999 | 80 | 0.5 | 97.1 | 35 | 0.3 | 26 | 1.0 | 6 | 0.5 | 4 | 0.9 | 0 | 1 | 0.3 | 7 | 0.7 | 1 | 0.6 | |
| 5,000 to 9,999 | 210 | 1.3 | 98.4 | 84 | 0.8 | 78 | 3.1 | 20 | 1.7 | 5 | 1.1 | 0 | 0 | 23 | 2.4 | 0 | |||
| 10,000 and over | 251 | 1.6 | 100.0 | 121 | 1.2 | 85 | 3.4 | 9 | 0.7 | 2 | 0.4 | 0 | 0 | 30 | 3.2 | 4 | 2.4 | ||
269 of 269 figures sit in a row or column sum that works out.
Reader’s notes
p. 245. The crop is cut off at the bottom: the body ends mid-table after "80 to 89" (cumulative percent only 62.3), so the remaining size classes and any total/footnote block below are not on this image. No footnote texts are printed in the crop, although markers are present: a raised 1 on the caption (caption excluded per instructions) and a raised 2 before 15,799 in the Total row, transcribed as 15,799^2. In the Total row the "Cumulative percent of all situations" cell holds a dash rule (----), transcribed as "". Likewise the CE "Percent by size class" cells for "30 to 39", "40 to 49" and "70 to 79" hold dash rules (the matching CE number cells are a printed 0), transcribed as "". Decimal points print very faintly in several one-decimal percent cells, appearing as a gap: "Under 10"/CB percent (22 3), "10 to 19"/CD percent (12 3), "40 to 49"/CD percent (4 0), "50 to 59"/CE percent (7 9), "60 to 69"/CB percent (2 3), "70 to 79"/CD percent (2 6) and "80 to 89"/CB percent (1 3). Each is transcribed with the decimal point (22.3, 12.3, 4.0, 7.9, 2.3, 2.6, 1.3); every one is consistent with the corresponding number divided by its column total, so the reading is secure. Header structure: "Total number of situations" and the two-column "Total" heading are tall headings repeated down the levels they span; "Type of situations" spans the 16 right-hand columns. All printed values check out arithmetically (column numbers sum to 15,799 and each percent matches its ratio), so no misprints are suspected.
p. 246. This crop is a continuation page: no column headings, no caption and no footnotes are printed on it, so header_rows is empty. The grid has 20 columns — the stub plus 19 numeric columns, read off the vertical column rules. The structure of the numeric columns is a 3-column block (count, percent, cumulative percent) followed by eight 2-column blocks (count, percent); I could not label them because the headings are on the previous page. Dash rules: many percent cells are printed as a short dash rule ("----") rather than a number; following the rule for dash-rule cells these are transcribed as "". They always sit beside a printed count of 0, so a reader should treat them as "no cases / percent not computed", not as missing data. Affected cells, by row label and numeric-column index (1 = first numeric column after the stub): 90 to 99 (13); 110 to 119 (13, 19); 120 to 129 (13); 130 to 139 (13); 140 to 149 (11, 13, 15, 19); 150 to 159 (13); 160 to 169 (13); 170 to 179 (13, 15); 180 to 189 (13, 15); 190 to 199 (9, 13, 17, 19); 400 to 499 (13); 500 to 599 (13, 15); 600 to 699 (13, 15); 700 to 799 (13, 15, 19); 800 to 899 (13, 19); 900 to 999 (13, 15, 19); 1,000 to 1,999 (15); 2,000 to 2,999 (13); 3,000 to 3,999 (11, 13, 15); 4,000 to 4,999 (13); 5,000 to 9,999 (13, 15, 19); 10,000 and over (13, 15). Dropped decimal points: in several cells the decimal point failed to print (or did not survive the scan) and the value appears as two digit groups separated by a space in a column where every other entry carries one decimal place. I have restored the point in these cells and list them here so the restoration is auditable: 100 to 109, col 11 printed "4 0" -> 4.0; 150 to 159, col 3 printed "72 4" -> 72.4; 160 to 169, col 3 printed "73 0" -> 73.0; 170 to 179, col 11 printed "0 2" -> 0.2; 400 to 499, col 3 printed "85 5" -> 85.5 and col 17 printed "3 8" -> 3.8; 800 to 899, col 11 printed "1 3" -> 1.3; 1,000 to 1,999, col 11 printed "3 5" -> 3.5; 2,000 to 2,999, col 11 printed "1 3" -> 1.3; 4,000 to 4,999, col 2 printed "0 5" -> 0.5; 10,000 and over, col 7 printed "3 4" -> 3.4. The three restorations in the cumulative-percent column (col 3) are confirmed arithmetically by the running total (70.6 + 1.8 = 72.4; 72.4 + 0.6 = 73.0; 83.4 + 2.1 = 85.5), as is 4,000 to 4,999 col 2 (96.6 + 0.5 = 97.1). Row labels are printed with wide internal spacing ("100 to 109"); I have normalized that to single spaces. Leader dots after each label were dropped. The table is cut off at the top and bottom by the crop: rows for the smaller size classes and any total line precede this page, and the bottom rule is the last thing on the image, so no total row appears here. The final row "10,000 and over" reaching 100.0 in the cumulative column indicates this is the end of the body.
Source image
Source data: U.S. NLRB Annual Reports (public domain). Reconstruction by NLRB Stats Archive. Read by claude-opus-5 (effort max, prompt extract_v1) from the 300-dpi scan; stitched by page. Updated October 2026.