NLRB Stats Archive › Annual Reports › FY1969 › Size of Units in Representation Election Cases Closed, Fiscal Year 1969
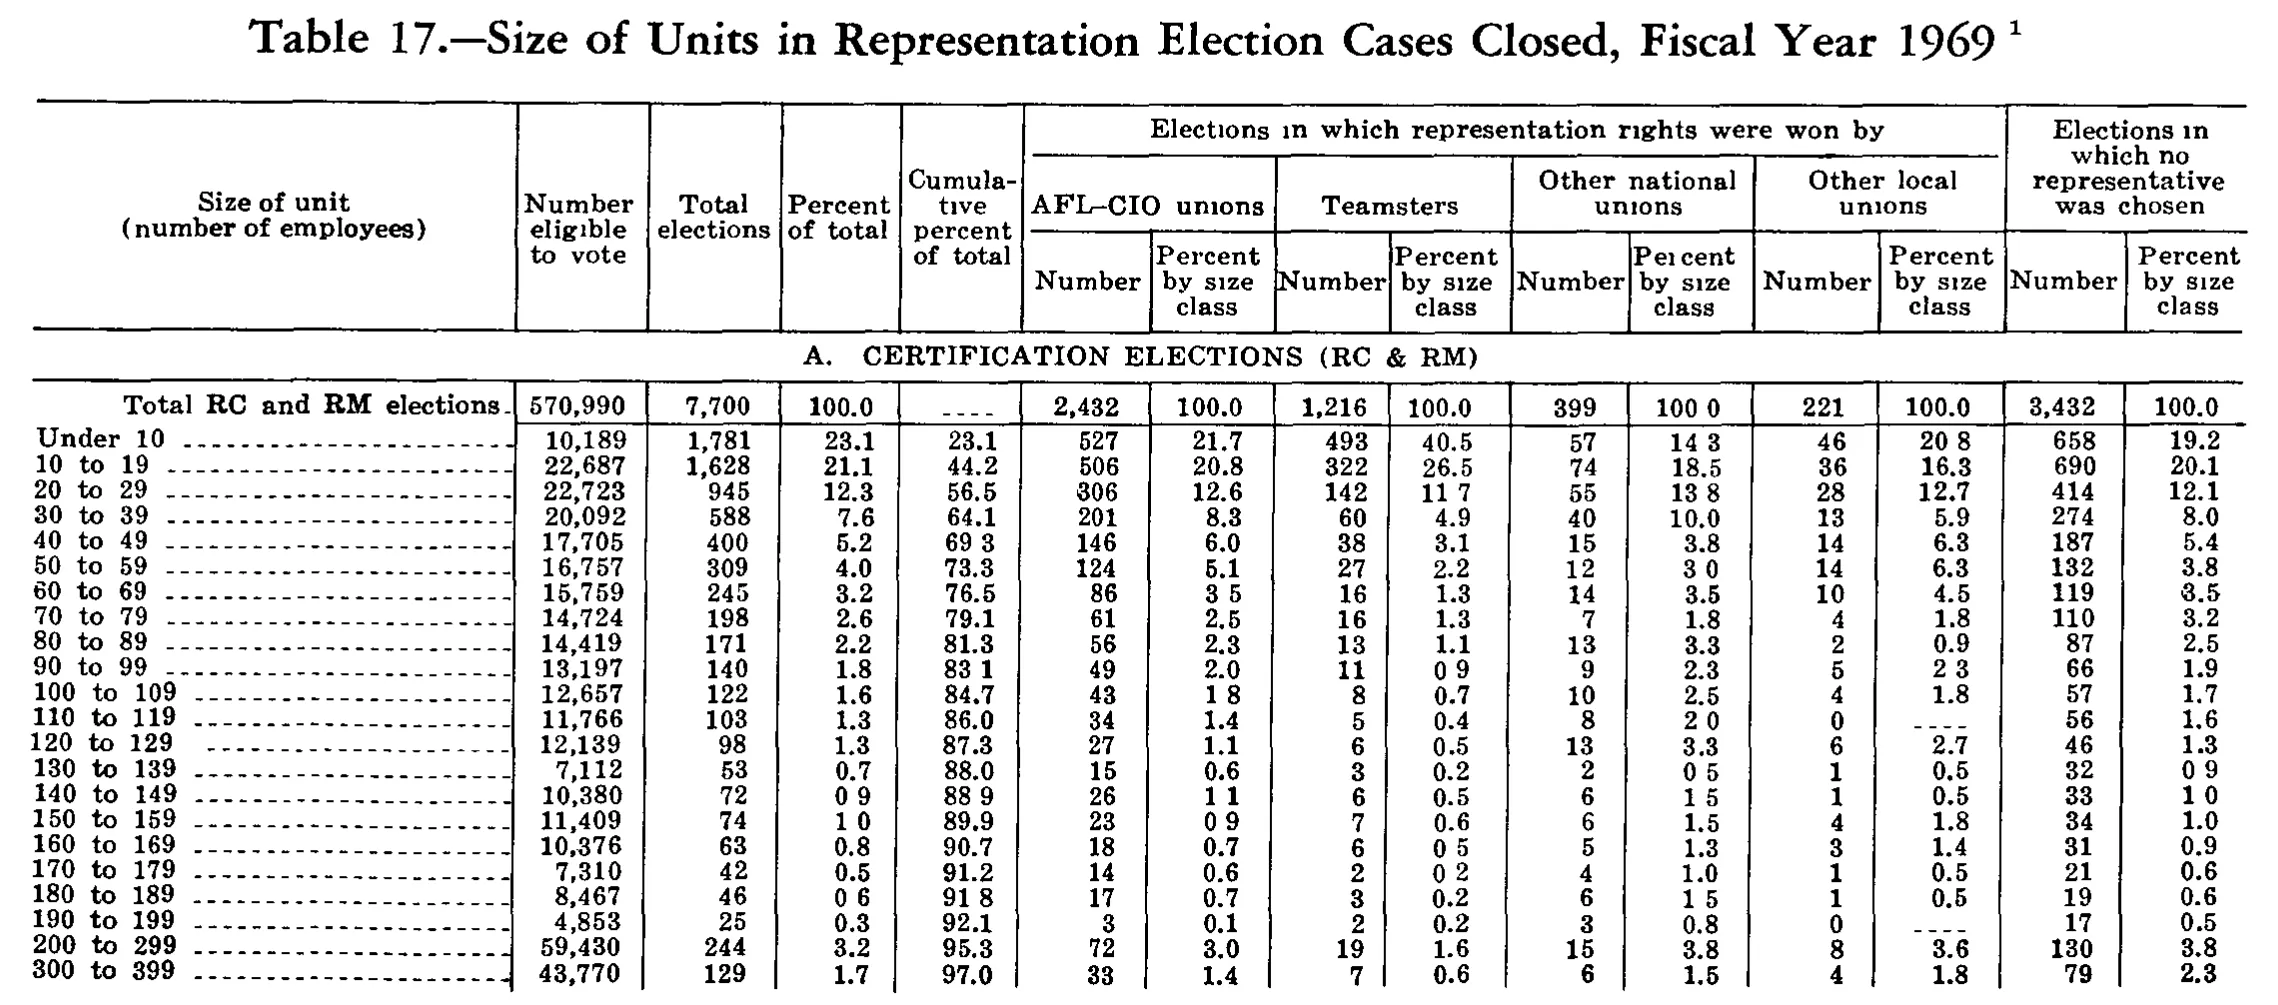
Size of Units in Representation Election Cases Closed, Fiscal Year 1969
Stitched from pp. 243–244.
| Size of unit (number of employees) | Number eligible to vote | Total elections | Percent of total | Cumulative percent of total | Elections in which representation rights were won by | Elections in which no representative was chosen | ||||||||
|---|---|---|---|---|---|---|---|---|---|---|---|---|---|---|
| Size of unit (number of employees) | Number eligible to vote | Total elections | Percent of total | Cumulative percent of total | AFL-CIO unions | Teamsters | Other national unions | Other local unions | Elections in which no representative was chosen | |||||
| Size of unit (number of employees) | Number eligible to vote | Total elections | Percent of total | Cumulative percent of total | Number | Percent by size class | Number | Percent by size class | Number | Percent by size class | Number | Percent by size class | Number | Percent by size class |
| A. CERTIFICATION ELECTIONS (RC & RM) | ||||||||||||||
| Total RC and RM elections | 570,990 | 7,700 | 100.0 | 2,432 | 100.0 | 1,216 | 100.0 | 399 | 100.0 | 221 | 100.0 | 3,432 | 100.0 | |
| Under 10 | 10,189 | 1,781 | 23.1 | 23.1 | 527 | 21.7 | 493 | 40.5 | 57 | 14.3 | 46 | 20.8 | 658 | 19.2 |
| 10 to 19 | 22,687 | 1,628 | 21.1 | 44.2 | 506 | 20.8 | 322 | 26.5 | 74 | 18.5 | 36 | 16.3 | 690 | 20.1 |
| 20 to 29 | 22,723 | 945 | 12.3 | 56.5 | 306 | 12.6 | 142 | 11.7 | 55 | 13.8 | 28 | 12.7 | 414 | 12.1 |
| 30 to 39 | 20,092 | 588 | 7.6 | 64.1 | 201 | 8.3 | 60 | 4.9 | 40 | 10.0 | 13 | 5.9 | 274 | 8.0 |
| 40 to 49 | 17,705 | 400 | 5.2 | 69.3 | 146 | 6.0 | 38 | 3.1 | 15 | 3.8 | 14 | 6.3 | 187 | 5.4 |
| 50 to 59 | 16,757 | 309 | 4.0 | 73.3 | 124 | 5.1 | 27 | 2.2 | 12 | 3.0 | 14 | 6.3 | 132 | 3.8 |
| 60 to 69 | 15,759 | 245 | 3.2 | 76.5 | 86 | 3.5 | 16 | 1.3 | 14 | 3.5 | 10 | 4.5 | 119 | 3.5 |
| 70 to 79 | 14,724 | 198 | 2.6 | 79.1 | 61 | 2.5 | 16 | 1.3 | 7 | 1.8 | 4 | 1.8 | 110 | 3.2 |
| 80 to 89 | 14,419 | 171 | 2.2 | 81.3 | 56 | 2.3 | 13 | 1.1 | 13 | 3.3 | 2 | 0.9 | 87 | 2.5 |
| 90 to 99 | 13,197 | 140 | 1.8 | 83.1 | 49 | 2.0 | 11 | 0.9 | 9 | 2.3 | 5 | 2.3 | 66 | 1.9 |
| 100 to 109 | 12,657 | 122 | 1.6 | 84.7 | 43 | 1.8 | 8 | 0.7 | 10 | 2.5 | 4 | 1.8 | 57 | 1.7 |
| 110 to 119 | 11,766 | 103 | 1.3 | 86.0 | 34 | 1.4 | 5 | 0.4 | 8 | 2.0 | 0 | 56 | 1.6 | |
| 120 to 129 | 12,139 | 98 | 1.3 | 87.3 | 27 | 1.1 | 6 | 0.5 | 13 | 3.3 | 6 | 2.7 | 46 | 1.3 |
| 130 to 139 | 7,112 | 53 | 0.7 | 88.0 | 15 | 0.6 | 3 | 0.2 | 2 | 0.5 | 1 | 0.5 | 32 | 0.9 |
| 140 to 149 | 10,380 | 72 | 0.9 | 88.9 | 26 | 1.1 | 6 | 0.5 | 6 | 1.5 | 1 | 0.5 | 33 | 1.0 |
| 150 to 159 | 11,409 | 74 | 1.0 | 89.9 | 23 | 0.9 | 7 | 0.6 | 6 | 1.5 | 4 | 1.8 | 34 | 1.0 |
| 160 to 169 | 10,376 | 63 | 0.8 | 90.7 | 18 | 0.7 | 6 | 0.5 | 5 | 1.3 | 3 | 1.4 | 31 | 0.9 |
| 170 to 179 | 7,310 | 42 | 0.5 | 91.2 | 14 | 0.6 | 2 | 0.2 | 4 | 1.0 | 1 | 0.5 | 21 | 0.6 |
| 180 to 189 | 8,467 | 46 | 0.6 | 91.8 | 17 | 0.7 | 3 | 0.2 | 6 | 1.5 | 1 | 0.5 | 19 | 0.6 |
| 190 to 199 | 4,853 | 25 | 0.3 | 92.1 | 3 | 0.1 | 2 | 0.2 | 3 | 0.8 | 0 | 17 | 0.5 | |
| 200 to 299 | 59,430 | 244 | 3.2 | 95.3 | 72 | 3.0 | 19 | 1.6 | 15 | 3.8 | 8 | 3.6 | 130 | 3.8 |
| 300 to 399 | 43,770 | 129 | 1.7 | 97.0 | 33 | 1.4 | 7 | 0.6 | 6 | 1.5 | 4 | 1.8 | 79 | 2.3 |
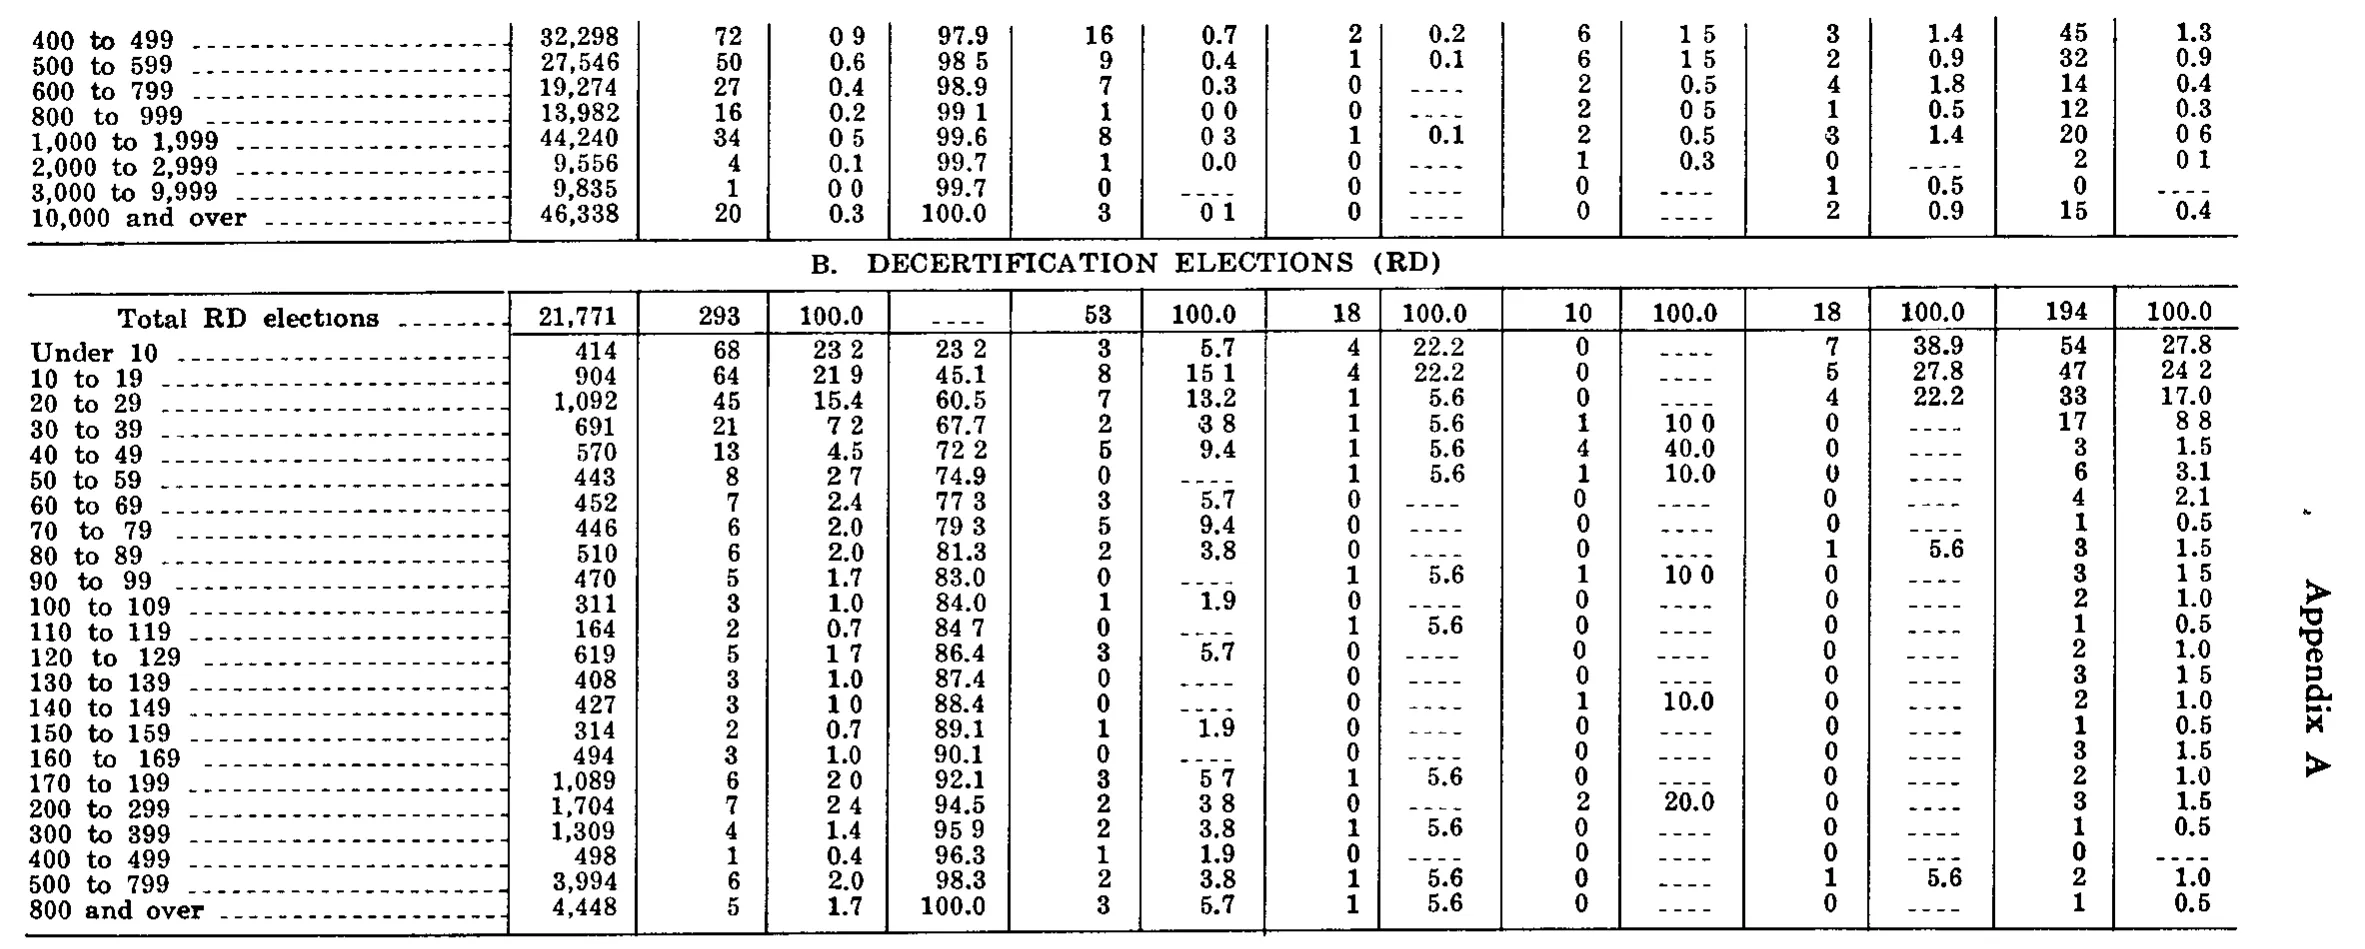
| 400 to 499 | 32,298 | 72 | 0.9 | 97.9 | 16 | 0.7 | 2 | 0.2 | 6 | 1.5 | 3 | 1.4 | 45 | 1.3 |
| 500 to 599 | 27,546 | 50 | 0.6 | 98.5 | 9 | 0.4 | 1 | 0.1 | 6 | 1.5 | 2 | 0.9 | 32 | 0.9 |
| 600 to 799 | 19,274 | 27 | 0.4 | 98.9 | 7 | 0.3 | 0 | 2 | 0.5 | 4 | 1.8 | 14 | 0.4 | |
| 800 to 999 | 13,982 | 16 | 0.2 | 99.1 | 1 | 0.0 | 0 | 2 | 0.5 | 1 | 0.5 | 12 | 0.3 | |
| 1,000 to 1,999 | 44,240 | 34 | 0.5 | 99.6 | 8 | 0.3 | 1 | 0.1 | 2 | 0.5 | 3 | 1.4 | 20 | 0.6 |
| 2,000 to 2,999 | 9,556 | 4 | 0.1 | 99.7 | 1 | 0.0 | 0 | 1 | 0.3 | 0 | 2 | 0.1 | ||
| 3,000 to 9,999 | 9,835 | 1 | 0.0 | 99.7 | 0 | 0 | 0 | 1 | 0.5 | 0 | ||||
| 10,000 and over | 46,338 | 20 | 0.3 | 100.0 | 3 | 0.1 | 0 | 0 | 2 | 0.9 | 15 | 0.4 | ||
| B. DECERTIFICATION ELECTIONS (RD) | ||||||||||||||
| Total RD elections | 21,771 | 293 | 100.0 | 53 | 100.0 | 18 | 100.0 | 10 | 100.0 | 18 | 100.0 | 194 | 100.0 | |
| Under 10 | 414 | 68 | 23.2 | 23.2 | 3 | 5.7 | 4 | 22.2 | 0 | 7 | 38.9 | 54 | 27.8 | |
| 10 to 19 | 904 | 64 | 21.9 | 45.1 | 8 | 15.1 | 4 | 22.2 | 0 | 5 | 27.8 | 47 | 24.2 | |
| 20 to 29 | 1,092 | 45 | 15.4 | 60.5 | 7 | 13.2 | 1 | 5.6 | 0 | 4 | 22.2 | 33 | 17.0 | |
| 30 to 39 | 691 | 21 | 7.2 | 67.7 | 2 | 3.8 | 1 | 5.6 | 1 | 10.0 | 0 | 17 | 8.8 | |
| 40 to 49 | 570 | 13 | 4.5 | 72.2 | 5 | 9.4 | 1 | 5.6 | 4 | 40.0 | 0 | 3 | 1.5 | |
| 50 to 59 | 443 | 8 | 2.7 | 74.9 | 0 | 1 | 5.6 | 1 | 10.0 | 0 | 6 | 3.1 | ||
| 60 to 69 | 452 | 7 | 2.4 | 77.3 | 3 | 5.7 | 0 | 0 | 0 | 4 | 2.1 | |||
| 70 to 79 | 446 | 6 | 2.0 | 79.3 | 5 | 9.4 | 0 | 0 | 0 | 1 | 0.5 | |||
| 80 to 89 | 510 | 6 | 2.0 | 81.3 | 2 | 3.8 | 0 | 0 | 1 | 5.6 | 3 | 1.5 | ||
| 90 to 99 | 470 | 5 | 1.7 | 83.0 | 0 | 1 | 5.6 | 1 | 10.0 | 0 | 3 | 1.5 | ||
| 100 to 109 | 311 | 3 | 1.0 | 84.0 | 1 | 1.9 | 0 | 0 | 0 | 2 | 1.0 | |||
| 110 to 119 | 164 | 2 | 0.7 | 84.7 | 0 | 1 | 5.6 | 0 | 0 | 1 | 0.5 | |||
| 120 to 129 | 619 | 5 | 1.7 | 86.4 | 3 | 5.7 | 0 | 0 | 0 | 2 | 1.0 | |||
| 130 to 139 | 408 | 3 | 1.0 | 87.4 | 0 | 0 | 0 | 0 | 3 | 1.5 | ||||
| 140 to 149 | 427 | 3 | 1.0 | 88.4 | 0 | 0 | 1 | 10.0 | 0 | 2 | 1.0 | |||
| 150 to 159 | 314 | 2 | 0.7 | 89.1 | 1 | 1.9 | 0 | 0 | 0 | 1 | 0.5 | |||
| 160 to 169 | 494 | 3 | 1.0 | 90.1 | 0 | 0 | 0 | 0 | 3 | 1.5 | ||||
| 170 to 199 | 1,089 | 6 | 2.0 | 92.1 | 3 | 5.7 | 1 | 5.6 | 0 | 0 | 2 | 1.0 | ||
| 200 to 299 | 1,704 | 7 | 2.4 | 94.5 | 2 | 3.8 | 0 | 2 | 20.0 | 0 | 3 | 1.5 | ||
| 300 to 399 | 1,309 | 4 | 1.4 | 95.9 | 2 | 3.8 | 1 | 5.6 | 0 | 0 | 1 | 0.5 | ||
| 400 to 499 | 498 | 1 | 0.4 | 96.3 | 1 | 1.9 | 0 | 0 | 0 | 0 | ||||
| 500 to 799 | 3,994 | 6 | 2.0 | 98.3 | 2 | 3.8 | 1 | 5.6 | 0 | 1 | 5.6 | 2 | 1.0 | |
| 800 and over | 4,448 | 5 | 1.7 | 100.0 | 3 | 5.7 | 1 | 5.6 | 0 | 0 | 1 | 0.5 | ||
320 of 320 figures sit in a row or column sum that works out.
Reader’s notes
p. 243. The crop is cut off at the bottom: the table clearly continues past the last transcribed row "300 to 399" (larger size classes, a panel B, and the footnote text keyed to the "1" marker on the caption are not on this image). No footnotes are printed on the crop, so the list is empty. The table has 15 printed columns: stub, "Number eligible to vote", "Total elections", "Percent of total", "Cumulative percent of total", then Number / Percent by size class for each of AFL-CIO unions, Teamsters, Other national unions, Other local unions, and finally Number / Percent by size class under "Elections in which no representative was chosen". Decimal points: in many percent cells the period is faint or has dropped out of the scan, printing as e.g. "100 0", "14 3", "20 8", "11 7", "13 8", "69 3", "3 0", "3 5", "83 1", "0 9", "2 3", "1 8", "2 0", "0 5", "88 9", "1 1", "1 5", "1 0", "0 2", "0 6", "91 8". All of these are one-decimal percentages in context (column alignment and the surrounding values confirm it), so they are transcribed with the decimal point restored, exactly parallel to the comma-with-space convention. Blank/dash cells transcribed as "": "Cumulative percent of total" in the "Total RC and RM elections" row (printed "- - - -"); "Other local unions / Percent by size class" in rows "110 to 119" and "190 to 199" (printed "- - - -" beside a printed 0 in the Number column, which is kept as "0"). Heading OCR artifacts: the "Percent by size class" head over Other national unions prints as "Pei cent by size class" in the scan; it is the same heading as the other four and is transcribed as "Percent by size class". The scan also renders many "i" dots faintly (e.g. "Elections in which", "AFL-CIO unions"); the wording is standard and unambiguous. The section line "A. CERTIFICATION ELECTIONS (RC & RM)" is carried as a label-only row. Doubtful cells: "60 to 69", "Elections in which no representative was chosen / Percent by size class" — the leading glyph is broken in the scan and reads as 3.5 (consistent with the column, since 119/3,432 = 3.5); "60 to 69", "AFL-CIO unions / Percent by size class" reads "3 5" = 3.5 (86/2,432 = 3.5). The stub label "60 to 69" also has a damaged leading 6.
p. 244. The crop carries no column headings (it continues a table from the preceding page), so header_rows is empty. The grid has 15 columns: the stub plus 14 numeric columns, which alternate count/percent except that column 4 is a cumulative-percent column paired with columns 2-3. The top eight rows (400 to 499 through 10,000 and over) finish a section begun on the previous page; the centered line "B. DECERTIFICATION ELECTIONS (RD)" is transcribed as a label-only row, and the rows below it belong to that section. Decimal points: this scan drops many decimal points in the percent columns, so the page literally shows "0 9", "98 5", "23 2", "10 0", "1 5", "8 8", etc. I restored the decimal point in every such cell (treating it as a printing/scanning dropout, like the comma-space case) rather than writing the digits run together. This is verifiable: in section B every restored percent equals the count divided by its column total (e.g. Under 10 = 68/293 = 23.2; 30 to 39 = 17/194 = 8.8; the "10 0" cells are 1/10 = 10.0). No digits were altered. Column placement was checked against the printed totals in the "Total RD elections" row: the count columns sum exactly to 293, 53, 18, 10, 18 and 194 respectively across the 23 size classes, so each value sits under the column shown. Dash rules ("----") are rendered as empty cells per the instructions. In the "50 to 59" row the column-11 zero is printed with a broken glyph that reads almost like "U"; it is a 0 (the column sums to the printed total of 18 with that reading). Printed figures that do not round from the counts, transcribed as printed: "10 to 19" column 3 is 21.9 (64/293 = 21.8); "400 to 499" (section B) column 3 is 0.4 (1/293 = 0.3); several cumulative percents in column 4 (60.5, 67.7, 74.9, 77.3, 79.3, 81.3, 83.0, 84.7, 92.1, 96.3) run a tenth off the running sum of the counts. The "Total RD elections" row has a dash rule, not a value, in the cumulative-percent column. The "Appendix A" text running vertically up the right margin is a running head and is excluded.
Source image
Source data: U.S. NLRB Annual Reports (public domain). Reconstruction by NLRB Stats Archive. Read by claude-opus-5 (effort max, prompt extract_v1) from the 300-dpi scan; stitched by page. Updated October 2026.