NLRB Stats Archive › Annual Reports › FY1969 › Industrial Distribution of Representation Elections Held in Cases Closed, Fiscal Year 1969
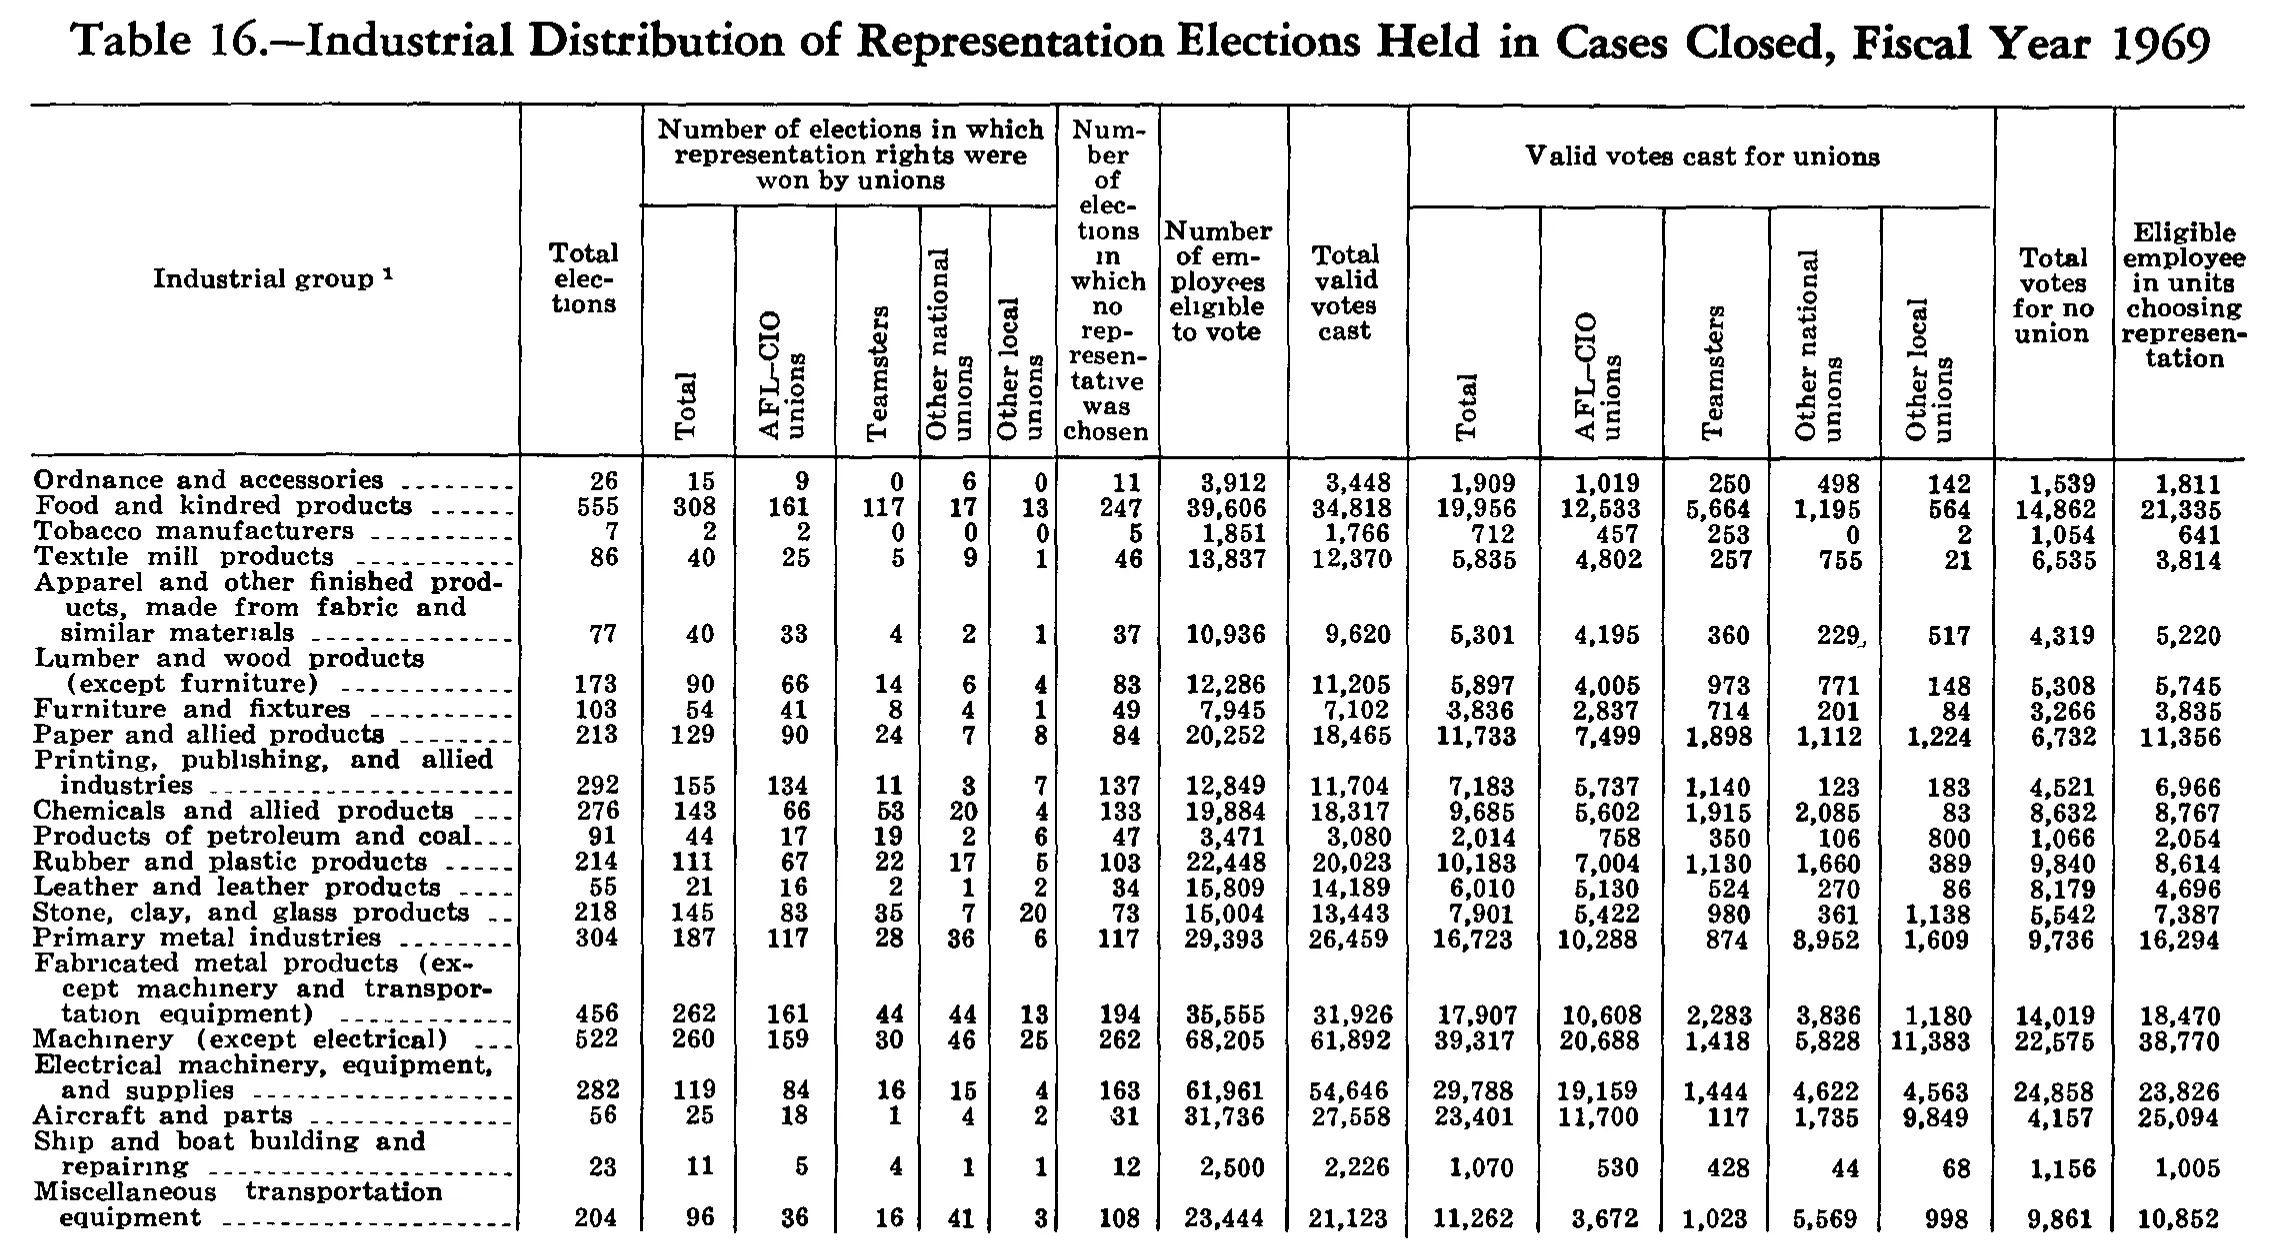
Industrial Distribution of Representation Elections Held in Cases Closed, Fiscal Year 1969
Stitched from pp. 241–242.
| Industrial group | Total elections | Number of elections in which representation rights were won by unions | Number of elections in which no representative was chosen | Number of employees eligible to vote | Total valid votes cast | Valid votes cast for unions | Total votes for no union | Eligible employee in units choosing representation | ||||||||
|---|---|---|---|---|---|---|---|---|---|---|---|---|---|---|---|---|
| Industrial group | Total elections | Total | AFL-CIO unions | Teamsters | Other national unions | Other local unions | Number of elections in which no representative was chosen | Number of employees eligible to vote | Total valid votes cast | Total | AFL-CIO unions | Teamsters | Other national unions | Other local unions | Total votes for no union | Eligible employee in units choosing representation |
| Ordnance and accessories | 26 | 15 | 9 | 0 | 6 | 0 | 11 | 3,912 | 3,448 | 1,909 | 1,019 | 250 | 498 | 142 | 1,539 | 1,811 |
| Food and kindred products | 555 | 308 | 161 | 117 | 17 | 13 | 247 | 39,606 | 34,818 | 19,956 | 12,533 | 5,664 | 1,195 | 564 | 14,862 | 21,335 |
| Tobacco manufacturers | 7 | 2 | 2 | 0 | 0 | 0 | 5 | 1,851 | 1,766 | 712 | 457 | 253 | 0 | 2 | 1,054 | 641 |
| Textile mill products | 86 | 40 | 25 | 5 | 9 | 1 | 46 | 13,837 | 12,370 | 5,835 | 4,802 | 257 | 755 | 21 | 6,535 | 3,814 |
| Apparel and other finished products, made from fabric and similar materials | 77 | 40 | 33 | 4 | 2 | 1 | 37 | 10,936 | 9,620 | 5,301 | 4,195 | 360 | 229 | 517 | 4,319 | 5,220 |
| Lumber and wood products (except furniture) | 173 | 90 | 66 | 14 | 6 | 4 | 83 | 12,286 | 11,205 | 5,897 | 4,005 | 973 | 771 | 148 | 5,308 | 5,745 |
| Furniture and fixtures | 103 | 54 | 41 | 8 | 4 | 1 | 49 | 7,945 | 7,102 | 3,836 | 2,837 | 714 | 201 | 84 | 3,266 | 3,835 |
| Paper and allied products | 213 | 129 | 90 | 24 | 7 | 8 | 84 | 20,252 | 18,465 | 11,733 | 7,499 | 1,898 | 1,112 | 1,224 | 6,732 | 11,356 |
| Printing, publishing, and allied industries | 292 | 155 | 134 | 11 | 3 | 7 | 137 | 12,849 | 11,704 | 7,183 | 5,737 | 1,140 | 123 | 183 | 4,521 | 6,966 |
| Chemicals and allied products | 276 | 143 | 66 | 53 | 20 | 4 | 133 | 19,884 | 18,317 | 9,685 | 5,602 | 1,915 | 2,085 | 83 | 8,632 | 8,767 |
| Products of petroleum and coal | 91 | 44 | 17 | 19 | 2 | 6 | 47 | 3,471 | 3,080 | 2,014 | 758 | 350 | 106 | 800 | 1,066 | 2,054 |
| Rubber and plastic products | 214 | 111 | 67 | 22 | 17 | 5 | 103 | 22,448 | 20,023 | 10,183 | 7,004 | 1,130 | 1,660 | 389 | 9,840 | 8,614 |
| Leather and leather products | 55 | 21 | 16 | 2 | 1 | 2 | 34 | 15,809 | 14,189 | 6,010 | 5,130 | 524 | 270 | 86 | 8,179 | 4,696 |
| Stone, clay, and glass products | 218 | 145 | 83 | 35 | 7 | 20 | 73 | 15,004 | 13,443 | 7,901 | 5,422 | 980 | 361 | 1,138 | 5,542 | 7,387 |
| Primary metal industries | 304 | 187 | 117 | 28 | 36 | 6 | 117 | 29,393 | 26,459 | 16,723 | 10,288 | 874 | 8,952 | 1,609 | 9,736 | 16,294 |
| Fabricated metal products (except machinery and transportation equipment) | 456 | 262 | 161 | 44 | 44 | 13 | 194 | 35,555 | 31,926 | 17,907 | 10,608 | 2,283 | 3,836 | 1,180 | 14,019 | 18,470 |
| Machinery (except electrical) | 522 | 260 | 159 | 30 | 46 | 25 | 262 | 68,205 | 61,892 | 39,317 | 20,688 | 1,418 | 5,828 | 11,383 | 22,575 | 38,770 |
| Electrical machinery, equipment, and supplies | 282 | 119 | 84 | 16 | 15 | 4 | 163 | 61,961 | 54,646 | 29,788 | 19,159 | 1,444 | 4,622 | 4,563 | 24,858 | 23,826 |
| Aircraft and parts | 56 | 25 | 18 | 1 | 4 | 2 | 31 | 31,736 | 27,558 | 23,401 | 11,700 | 117 | 1,735 | 9,849 | 4,157 | 25,094 |
| Ship and boat building and repairing | 23 | 11 | 5 | 4 | 1 | 1 | 12 | 2,500 | 2,226 | 1,070 | 530 | 428 | 44 | 68 | 1,156 | 1,005 |
| Miscellaneous transportation equipment | 204 | 96 | 36 | 16 | 41 | 3 | 108 | 23,444 | 21,123 | 11,262 | 3,672 | 1,023 | 5,569 | 998 | 9,861 | 10,852 |
| Professional, scientific, and controlling instruments | 62 | 26 | 14 | 7 | 4 | 1 | 36 | 6,927 | 6,413 | 2,911 | 1,883 | 619 | 364 | 45 | 3,502 | 1,392 |
| Miscellaneous manufacturing | 132 | 68 | 46 | 12 | 7 | 3 | 64 | 11,367 | 10,198 | 5,876 | 3,973 | 1,204 | 557 | 142 | 4,322 | 5,973 |
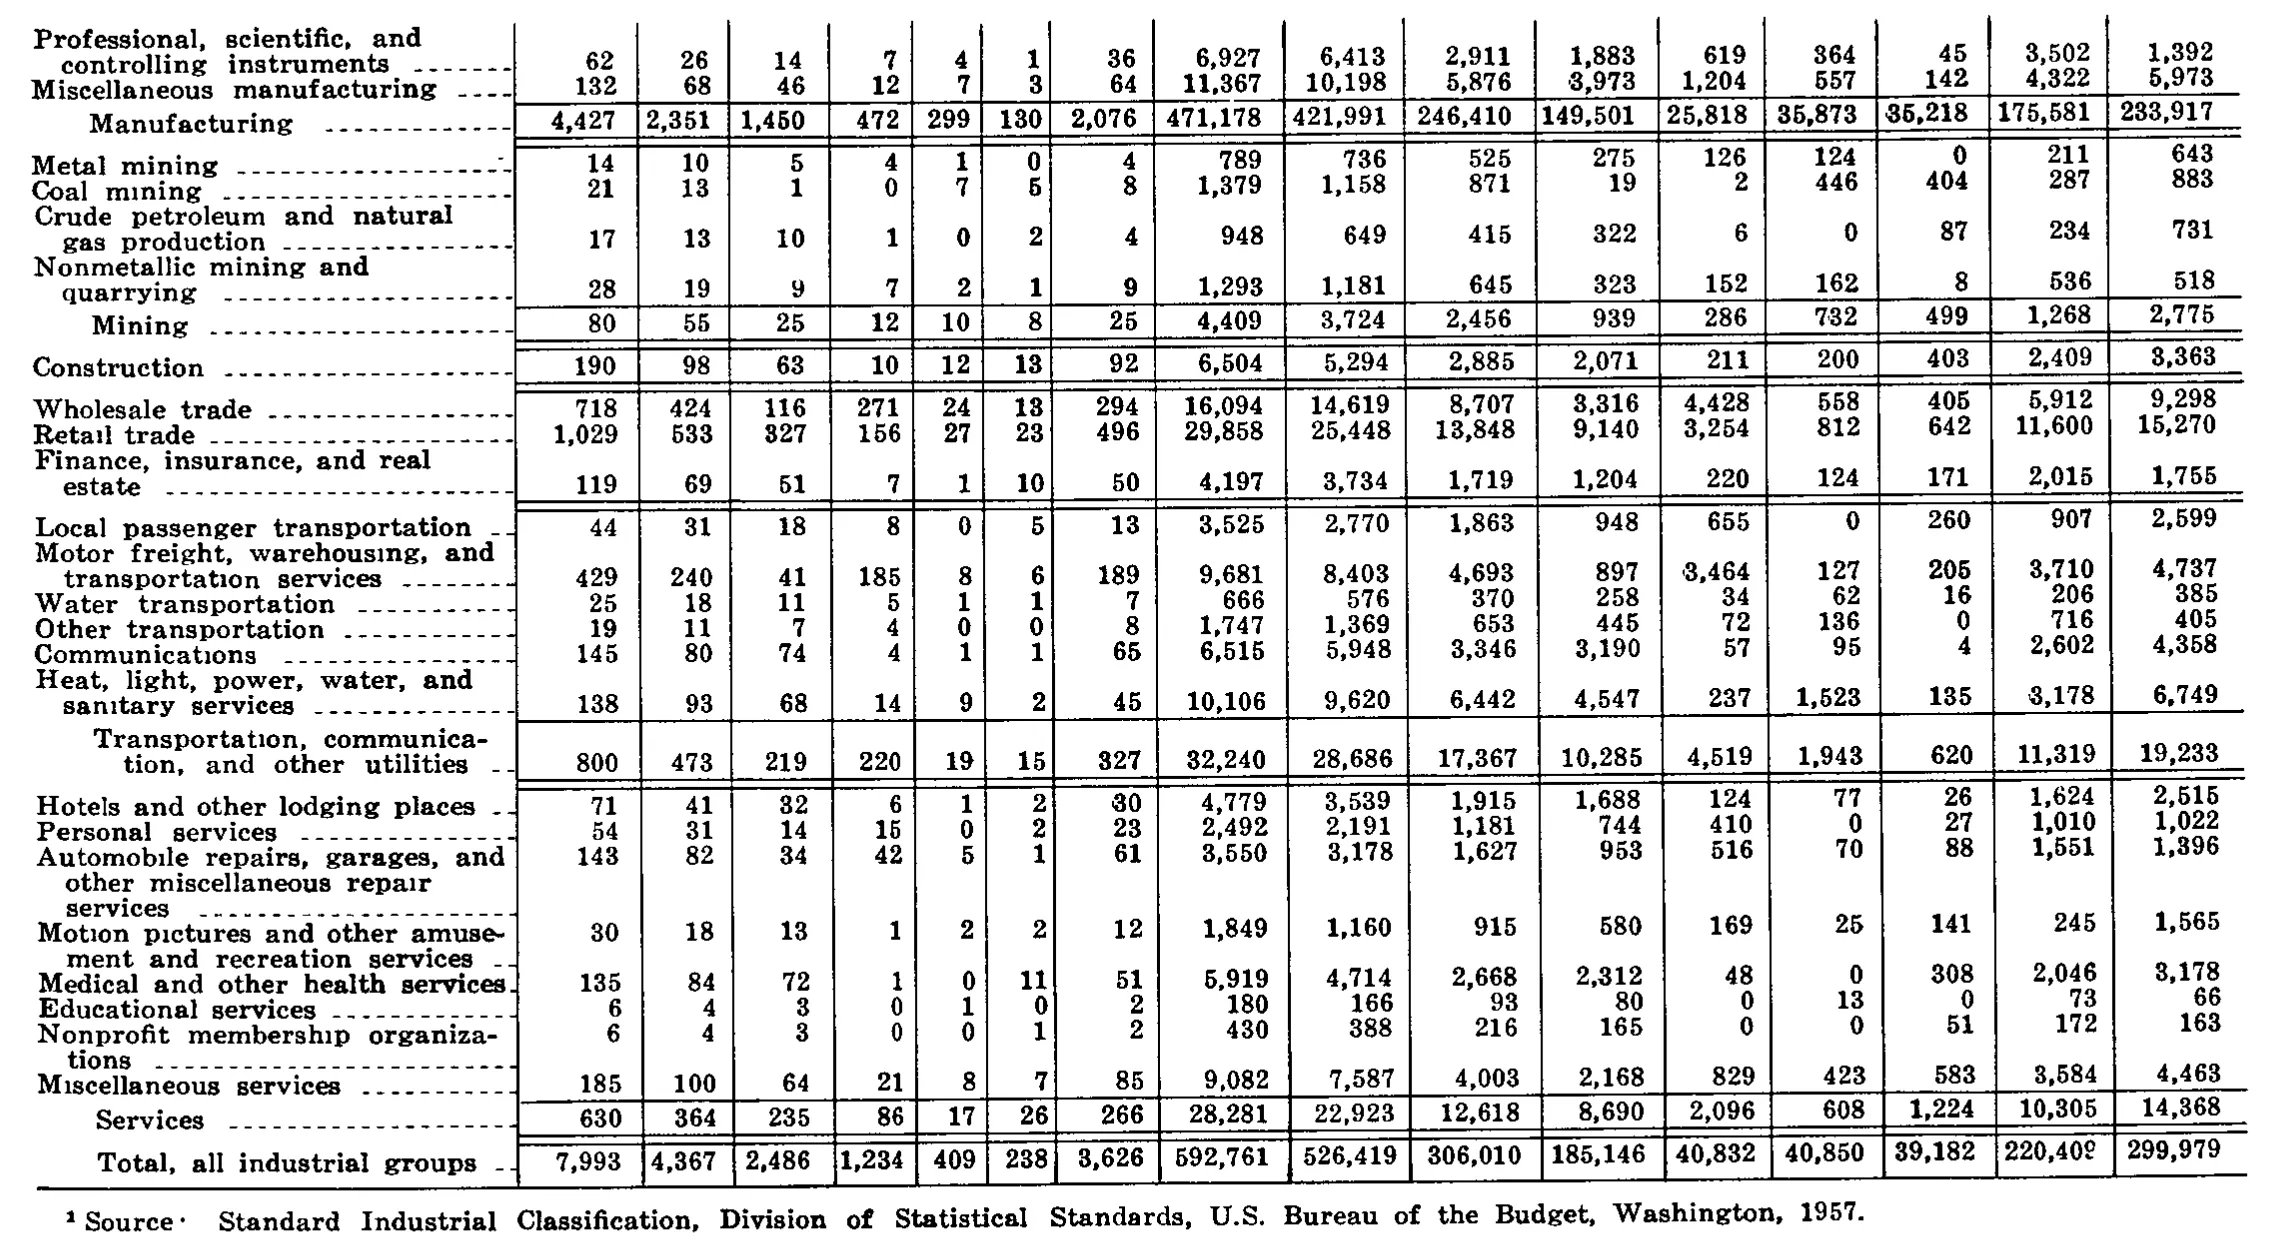
| Manufacturing | 4,427 | 2,351 | 1,450 | 472 | 299 | 130 | 2,076 | 471,178 | 421,991 | 246,410 | 149,501 | 25,818 | 35,873 | 35,218 | 175,581 | 233,917 |
| Metal mining | 14 | 10 | 5 | 4 | 1 | 0 | 4 | 789 | 736 | 525 | 275 | 126 | 124 | 0 | 211 | 643 |
| Coal mining | 21 | 13 | 1 | 0 | 7 | 5 | 8 | 1,379 | 1,158 | 871 | 19 | 2 | 446 | 404 | 287 | 883 |
| Crude petroleum and natural gas production | 17 | 13 | 10 | 1 | 0 | 2 | 4 | 948 | 649 | 415 | 322 | 6 | 0 | 87 | 234 | 731 |
| Nonmetallic mining and quarrying | 28 | 19 | 9 | 7 | 2 | 1 | 9 | 1,293 | 1,181 | 645 | 323 | 152 | 162 | 8 | 536 | 518 |
| Mining | 80 | 55 | 25 | 12 | 10 | 8 | 25 | 4,409 | 3,724 | 2,456 | 939 | 286 | 732 | 499 | 1,268 | 2,775 |
| Construction | 190 | 98 | 63 | 10 | 12 | 13 | 92 | 6,504 | 5,294 | 2,885 | 2,071 | 211 | 200 | 403 | 2,409 | 3,363 |
| Wholesale trade | 718 | 424 | 116 | 271 | 24 | 13 | 294 | 16,094 | 14,619 | 8,707 | 3,316 | 4,428 | 558 | 405 | 5,912 | 9,298 |
| Retail trade | 1,029 | 533 | 327 | 156 | 27 | 23 | 496 | 29,858 | 25,448 | 13,848 | 9,140 | 3,254 | 812 | 642 | 11,600 | 15,270 |
| Finance, insurance, and real estate | 119 | 69 | 51 | 7 | 1 | 10 | 50 | 4,197 | 3,734 | 1,719 | 1,204 | 220 | 124 | 171 | 2,015 | 1,755 |
| Local passenger transportation | 44 | 31 | 18 | 8 | 0 | 5 | 13 | 3,525 | 2,770 | 1,863 | 948 | 655 | 0 | 260 | 907 | 2,599 |
| Motor freight, warehousing, and transportation services | 429 | 240 | 41 | 185 | 8 | 6 | 189 | 9,681 | 8,403 | 4,693 | 897 | 3,464 | 127 | 205 | 3,710 | 4,737 |
| Water transportation | 25 | 18 | 11 | 5 | 1 | 1 | 7 | 666 | 576 | 370 | 258 | 34 | 62 | 16 | 206 | 385 |
| Other transportation | 19 | 11 | 7 | 4 | 0 | 0 | 8 | 1,747 | 1,369 | 653 | 445 | 72 | 136 | 0 | 716 | 405 |
| Communications | 145 | 80 | 74 | 4 | 1 | 1 | 65 | 6,515 | 5,948 | 3,346 | 3,190 | 57 | 95 | 4 | 2,602 | 4,358 |
| Heat, light, power, water, and sanitary services | 138 | 93 | 68 | 14 | 9 | 2 | 45 | 10,106 | 9,620 | 6,442 | 4,547 | 237 | 1,523 | 135 | 3,178 | 6,749 |
| Transportation, communication, and other utilities | 800 | 473 | 219 | 220 | 19 | 15 | 327 | 32,240 | 28,686 | 17,367 | 10,285 | 4,519 | 1,943 | 620 | 11,319 | 19,233 |
| Hotels and other lodging places | 71 | 41 | 32 | 6 | 1 | 2 | 30 | 4,779 | 3,539 | 1,915 | 1,688 | 124 | 77 | 26 | 1,624 | 2,515 |
| Personal services | 54 | 31 | 14 | 15 | 0 | 2 | 23 | 2,492 | 2,191 | 1,181 | 744 | 410 | 0 | 27 | 1,010 | 1,022 |
| Automobile repairs, garages, and other miscellaneous repair services | 143 | 82 | 34 | 42 | 5 | 1 | 61 | 3,550 | 3,178 | 1,627 | 953 | 516 | 70 | 88 | 1,551 | 1,396 |
| Motion pictures and other amusement and recreation services | 30 | 18 | 13 | 1 | 2 | 2 | 12 | 1,849 | 1,160 | 915 | 580 | 169 | 25 | 141 | 245 | 1,565 |
| Medical and other health services | 135 | 84 | 72 | 1 | 0 | 11 | 51 | 5,919 | 4,714 | 2,668 | 2,312 | 48 | 0 | 308 | 2,046 | 3,178 |
| Educational services | 6 | 4 | 3 | 0 | 1 | 0 | 2 | 180 | 166 | 93 | 80 | 0 | 13 | 0 | 73 | 66 |
| Nonprofit membership organizations | 6 | 4 | 3 | 0 | 0 | 1 | 2 | 430 | 388 | 216 | 165 | 0 | 0 | 51 | 172 | 163 |
| Miscellaneous services | 185 | 100 | 64 | 21 | 8 | 7 | 85 | 9,082 | 7,587 | 4,003 | 2,168 | 829 | 423 | 583 | 3,584 | 4,463 |
| Services | 630 | 364 | 235 | 86 | 17 | 26 | 266 | 28,281 | 22,923 | 12,618 | 8,690 | 2,096 | 608 | 1,224 | 10,305 | 14,368 |
| Total, all industrial groups | 7,993 | 4,367 | 2,486 | 1,234 | 409 | 238 | 3,626 | 592,761 | 526,419 | 306,010 | 185,146 | 40,832 | 40,850 | 39,182 | 220,409 | 299,979 |
- 1 Source: Standard Industrial Classification, Division of Statistical Standards, U.S. Bureau of the Budget, Washington, 1957.
771 of 772 figures sit in a row or column sum that works out. 2 cells break a sum: 'Primary metal industries', column 11: prints 16,723, columns 12 to 15 add to 21,723; 'Manufacturing', column 14: prints 35,873, rows 'Ordnance and accesso' to 'Miscellaneous manufa' add to 40,873.
Reader’s notes
p. 241. The crop shows the top portion of Table 16 only; the table continues past the bottom edge (the last visible row is "Miscellaneous transportation equipment"), so no footnote text is printed on this image even though the stub heading carries a raised 1 marker (transcribed as "Industrial group ^1"). Suspected misprint / doubtful cell: in "Primary metal industries", the "Valid votes cast for unions" components do not sum to the printed total 16,723 — as transcribed, 10,288 + 874 + 8,952 + 1,609 = 21,723. The "Other national unions" cell under "Valid votes cast for unions" is transcribed as printed, 8,952; if that glyph were 3,952 the row would reconcile exactly (16,723), and 16,723 + 9,736 = 26,459 matches the printed "Total valid votes cast". The leading digit is the only doubtful character; it reads as an 8 in this scan. Every other row's components reconcile with its printed totals (both the election counts and the vote counts). Heading wording is as printed: the last column reads "Eligible employee in units choosing representation" (singular "employee"). Column headings printed vertically ("Total", "AFL-CIO unions", "Teamsters", "Other national unions", "Other local unions") appear once under each of the two spanner headings and are repeated in the respective column groups. Row labels wrapping over two or three lines were joined and end-of-line hyphens repaired ("prod- ucts" → "products", "transpor- tation" → "transportation", "ex- cept" → "except").
p. 242. This crop is a continuation page: no column headings are printed on it, so header_rows is empty. The grid has a stub plus 16 data columns, counted from the column rules and confirmed against the "Total, all industrial groups" line. Doubtful cells: in the "Total, all industrial groups" row, the 15th data column prints as "220,40" followed by a broken/ink-filled final glyph; it reads most plausibly as 220,409 and that is what I transcribed, but the last digit is not crisp. In the same row the preceding column "39,182" and "40,850" are clear. Structural observation (as printed, not corrected): the trade section ("Wholesale trade", "Retail trade", "Finance, insurance, and real estate") carries no subtotal row, unlike the Manufacturing, Mining, Transportation and Services sections, which each end with one. There is a horizontal rule directly between "Finance, insurance, and real estate" and "Local passenger transportation" with no intervening total line. The footnote marker "1" belongs to a source note whose referent (an industry-classification heading) is on the earlier part of the table, above this crop. Several row labels wrap over two or three printed lines with the figures set on the first or an interior line (e.g. "Crude petroleum and natural gas production", "Nonmetallic mining and quarrying", "Automobile repairs, garages, and other miscellaneous repair services", "Motion pictures and other amusement and recreation services", "Nonprofit membership organizations"); these have been joined into single rows and end-of-line hyphens repaired. No totals were recomputed or adjusted; all values are as printed.
Source image
Source data: U.S. NLRB Annual Reports (public domain). Reconstruction by NLRB Stats Archive. Read by claude-opus-5 (effort max, prompt extract_v1) from the 300-dpi scan; stitched by page. Updated October 2026.