NLRB Stats Archive › Annual Reports › FY1969 › Geographic Distribution of Representation Elections Held in Cases Closed, Fiscal Year 1969
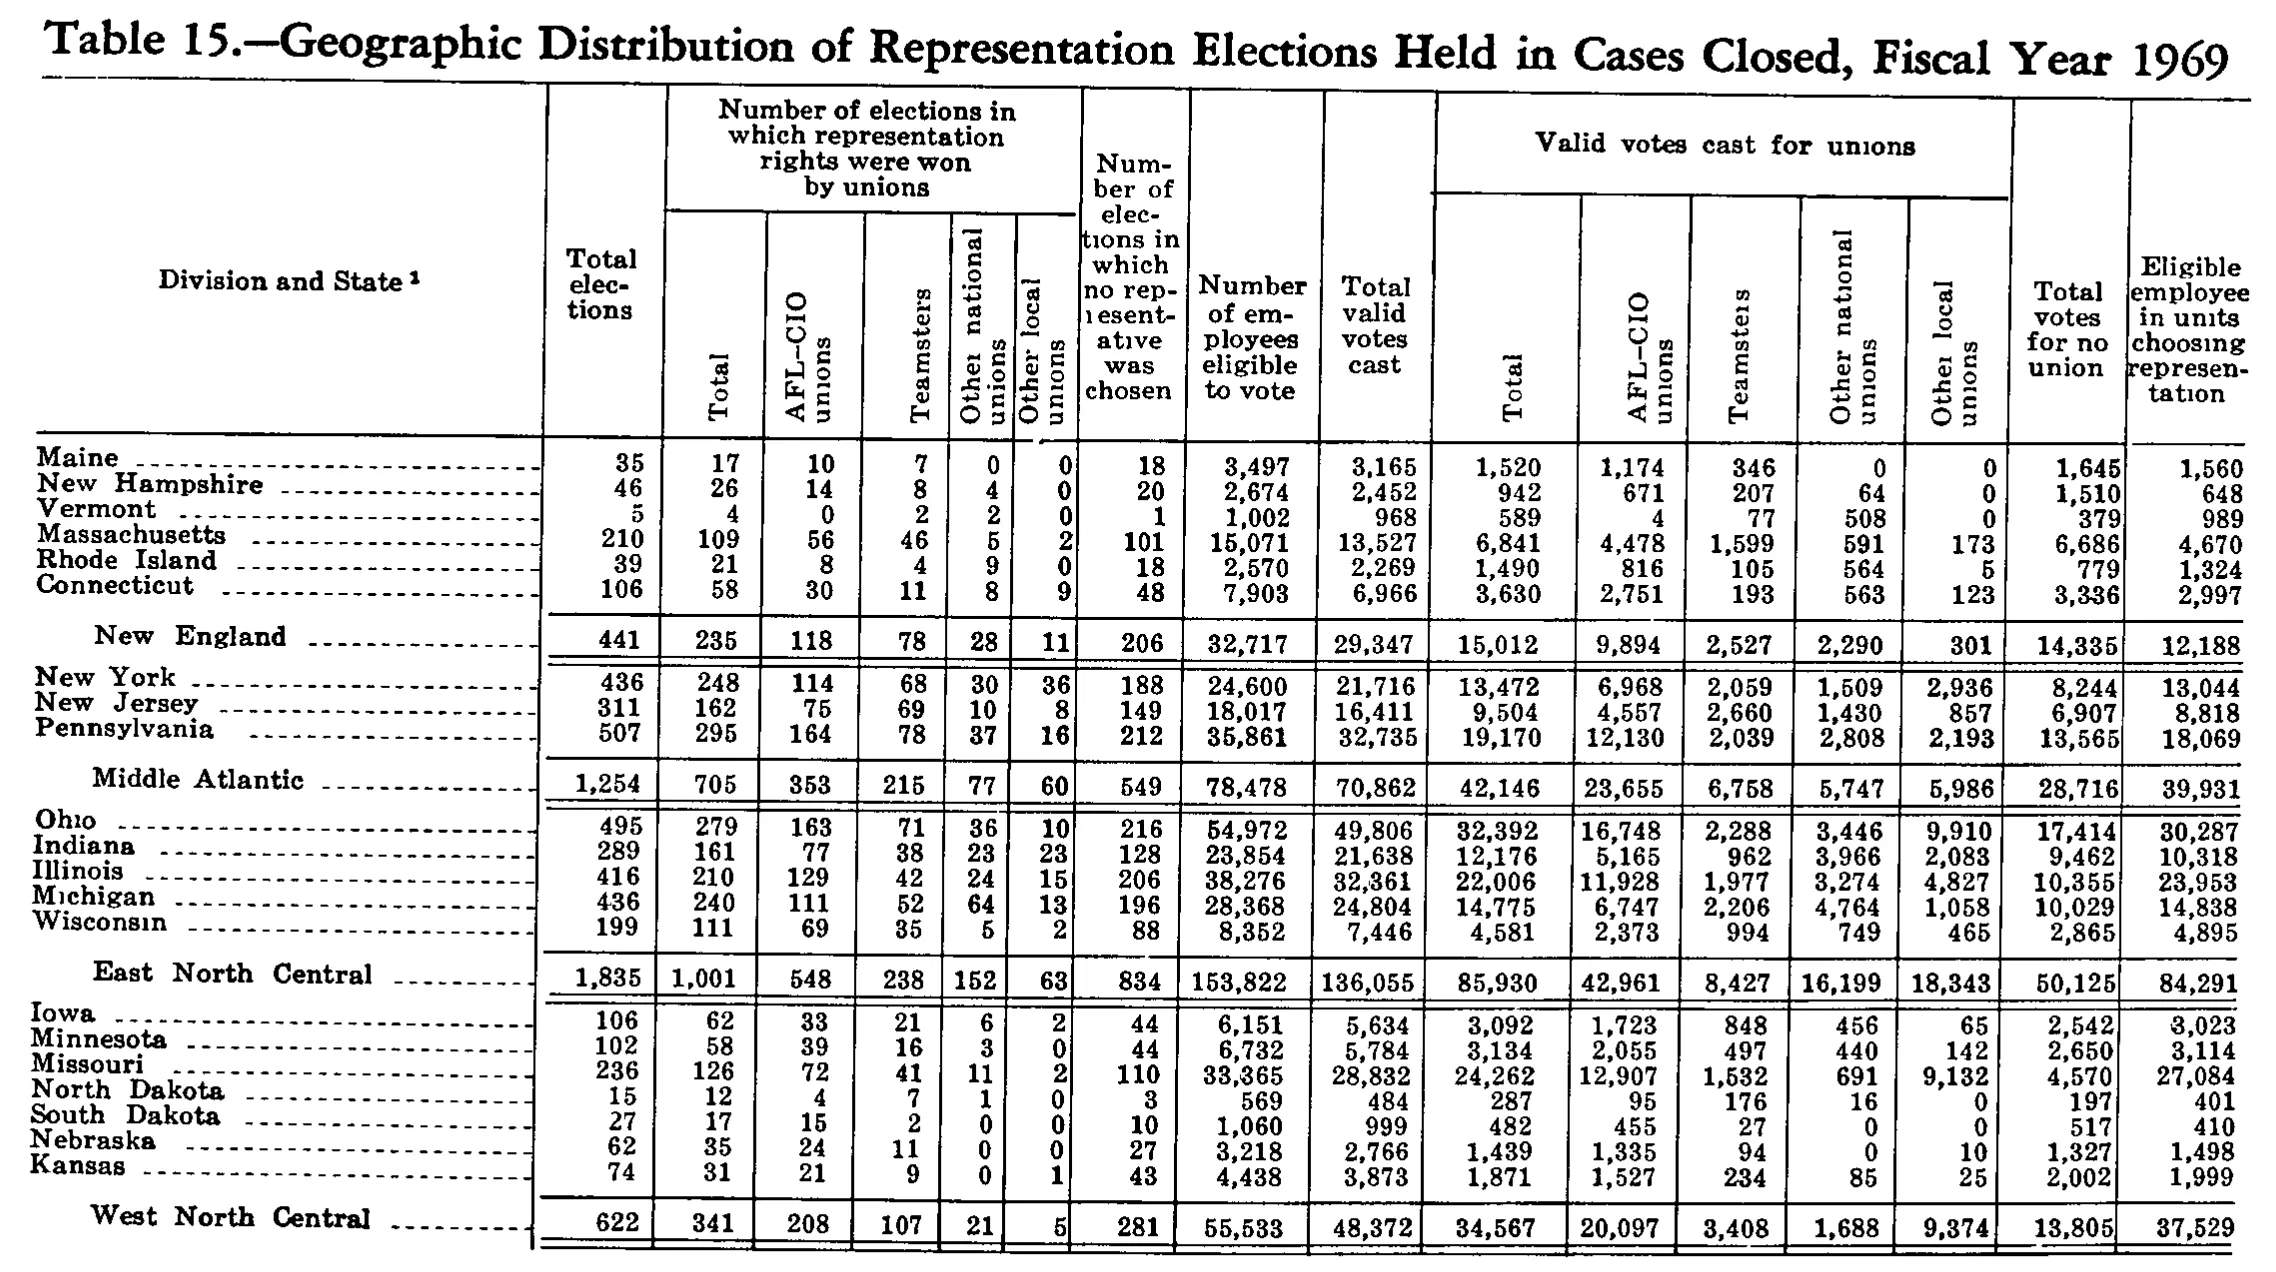
Geographic Distribution of Representation Elections Held in Cases Closed, Fiscal Year 1969
Stitched from pp. 239–240.
| Division and State | Total elections | Number of elections in which representation rights were won by unions | Number of elections in which no representative was chosen | Number of employees eligible to vote | Total valid votes cast | Valid votes cast for unions | Total votes for no union | Eligible employee in units choosing representation | ||||||||
|---|---|---|---|---|---|---|---|---|---|---|---|---|---|---|---|---|
| Division and State | Total elections | Total | AFL-CIO unions | Teamsters | Other national unions | Other local unions | Number of elections in which no representative was chosen | Number of employees eligible to vote | Total valid votes cast | Total | AFL-CIO unions | Teamsters | Other national unions | Other local unions | Total votes for no union | Eligible employee in units choosing representation |
| Maine | 35 | 17 | 10 | 7 | 0 | 0 | 18 | 3,497 | 3,165 | 1,520 | 1,174 | 346 | 0 | 0 | 1,645 | 1,560 |
| New Hampshire | 46 | 26 | 14 | 8 | 4 | 0 | 20 | 2,674 | 2,452 | 942 | 671 | 207 | 64 | 0 | 1,510 | 648 |
| Vermont | 5 | 4 | 0 | 2 | 2 | 0 | 1 | 1,002 | 968 | 589 | 4 | 77 | 508 | 0 | 379 | 989 |
| Massachusetts | 210 | 109 | 56 | 46 | 5 | 2 | 101 | 15,071 | 13,527 | 6,841 | 4,478 | 1,599 | 591 | 173 | 6,686 | 4,670 |
| Rhode Island | 39 | 21 | 8 | 4 | 9 | 0 | 18 | 2,570 | 2,269 | 1,490 | 816 | 105 | 564 | 5 | 779 | 1,324 |
| Connecticut | 106 | 58 | 30 | 11 | 8 | 9 | 48 | 7,903 | 6,966 | 3,630 | 2,751 | 193 | 563 | 123 | 3,336 | 2,997 |
| New England | 441 | 235 | 118 | 78 | 28 | 11 | 206 | 32,717 | 29,347 | 15,012 | 9,894 | 2,527 | 2,290 | 301 | 14,335 | 12,188 |
| New York | 436 | 248 | 114 | 68 | 30 | 36 | 188 | 24,600 | 21,716 | 13,472 | 6,968 | 2,059 | 1,509 | 2,936 | 8,244 | 13,044 |
| New Jersey | 311 | 162 | 75 | 69 | 10 | 8 | 149 | 18,017 | 16,411 | 9,504 | 4,557 | 2,660 | 1,430 | 857 | 6,907 | 8,818 |
| Pennsylvania | 507 | 295 | 164 | 78 | 37 | 16 | 212 | 35,861 | 32,735 | 19,170 | 12,130 | 2,039 | 2,808 | 2,193 | 13,565 | 18,069 |
| Middle Atlantic | 1,254 | 705 | 353 | 215 | 77 | 60 | 549 | 78,478 | 70,862 | 42,146 | 23,655 | 6,758 | 5,747 | 5,986 | 28,716 | 39,931 |
| Ohio | 495 | 279 | 163 | 71 | 36 | 10 | 216 | 54,972 | 49,806 | 32,392 | 16,748 | 2,288 | 3,446 | 9,910 | 17,414 | 30,287 |
| Indiana | 289 | 161 | 77 | 38 | 23 | 23 | 128 | 23,854 | 21,638 | 12,176 | 5,165 | 962 | 3,966 | 2,083 | 9,462 | 10,318 |
| Illinois | 416 | 210 | 129 | 42 | 24 | 15 | 206 | 38,276 | 32,361 | 22,006 | 11,928 | 1,977 | 3,274 | 4,827 | 10,355 | 23,953 |
| Michigan | 436 | 240 | 111 | 52 | 64 | 13 | 196 | 28,368 | 24,804 | 14,775 | 6,747 | 2,206 | 4,764 | 1,058 | 10,029 | 14,838 |
| Wisconsin | 199 | 111 | 69 | 35 | 5 | 2 | 88 | 8,352 | 7,446 | 4,581 | 2,373 | 994 | 749 | 465 | 2,865 | 4,895 |
| East North Central | 1,835 | 1,001 | 548 | 238 | 152 | 63 | 834 | 153,822 | 136,055 | 85,930 | 42,961 | 8,427 | 16,199 | 18,343 | 50,125 | 84,291 |
| Iowa | 106 | 62 | 33 | 21 | 6 | 2 | 44 | 6,151 | 5,634 | 3,092 | 1,723 | 848 | 456 | 65 | 2,542 | 3,023 |
| Minnesota | 102 | 58 | 39 | 16 | 3 | 0 | 44 | 6,732 | 5,784 | 3,134 | 2,055 | 497 | 440 | 142 | 2,650 | 3,114 |
| Missouri | 236 | 126 | 72 | 41 | 11 | 2 | 110 | 33,365 | 28,832 | 24,262 | 12,907 | 1,532 | 691 | 9,132 | 4,570 | 27,084 |
| North Dakota | 15 | 12 | 4 | 7 | 1 | 0 | 3 | 569 | 484 | 287 | 95 | 176 | 16 | 0 | 197 | 401 |
| South Dakota | 27 | 17 | 15 | 2 | 0 | 0 | 10 | 1,060 | 999 | 482 | 455 | 27 | 0 | 0 | 517 | 410 |
| Nebraska | 62 | 35 | 24 | 11 | 0 | 0 | 27 | 3,218 | 2,766 | 1,439 | 1,335 | 94 | 0 | 10 | 1,327 | 1,498 |
| Kansas | 74 | 31 | 21 | 9 | 0 | 1 | 43 | 4,438 | 3,873 | 1,871 | 1,527 | 234 | 85 | 25 | 2,002 | 1,999 |
| West North Central | 622 | 341 | 208 | 107 | 21 | 5 | 281 | 55,533 | 48,372 | 34,567 | 20,097 | 3,408 | 1,688 | 9,374 | 13,805 | 37,529 |
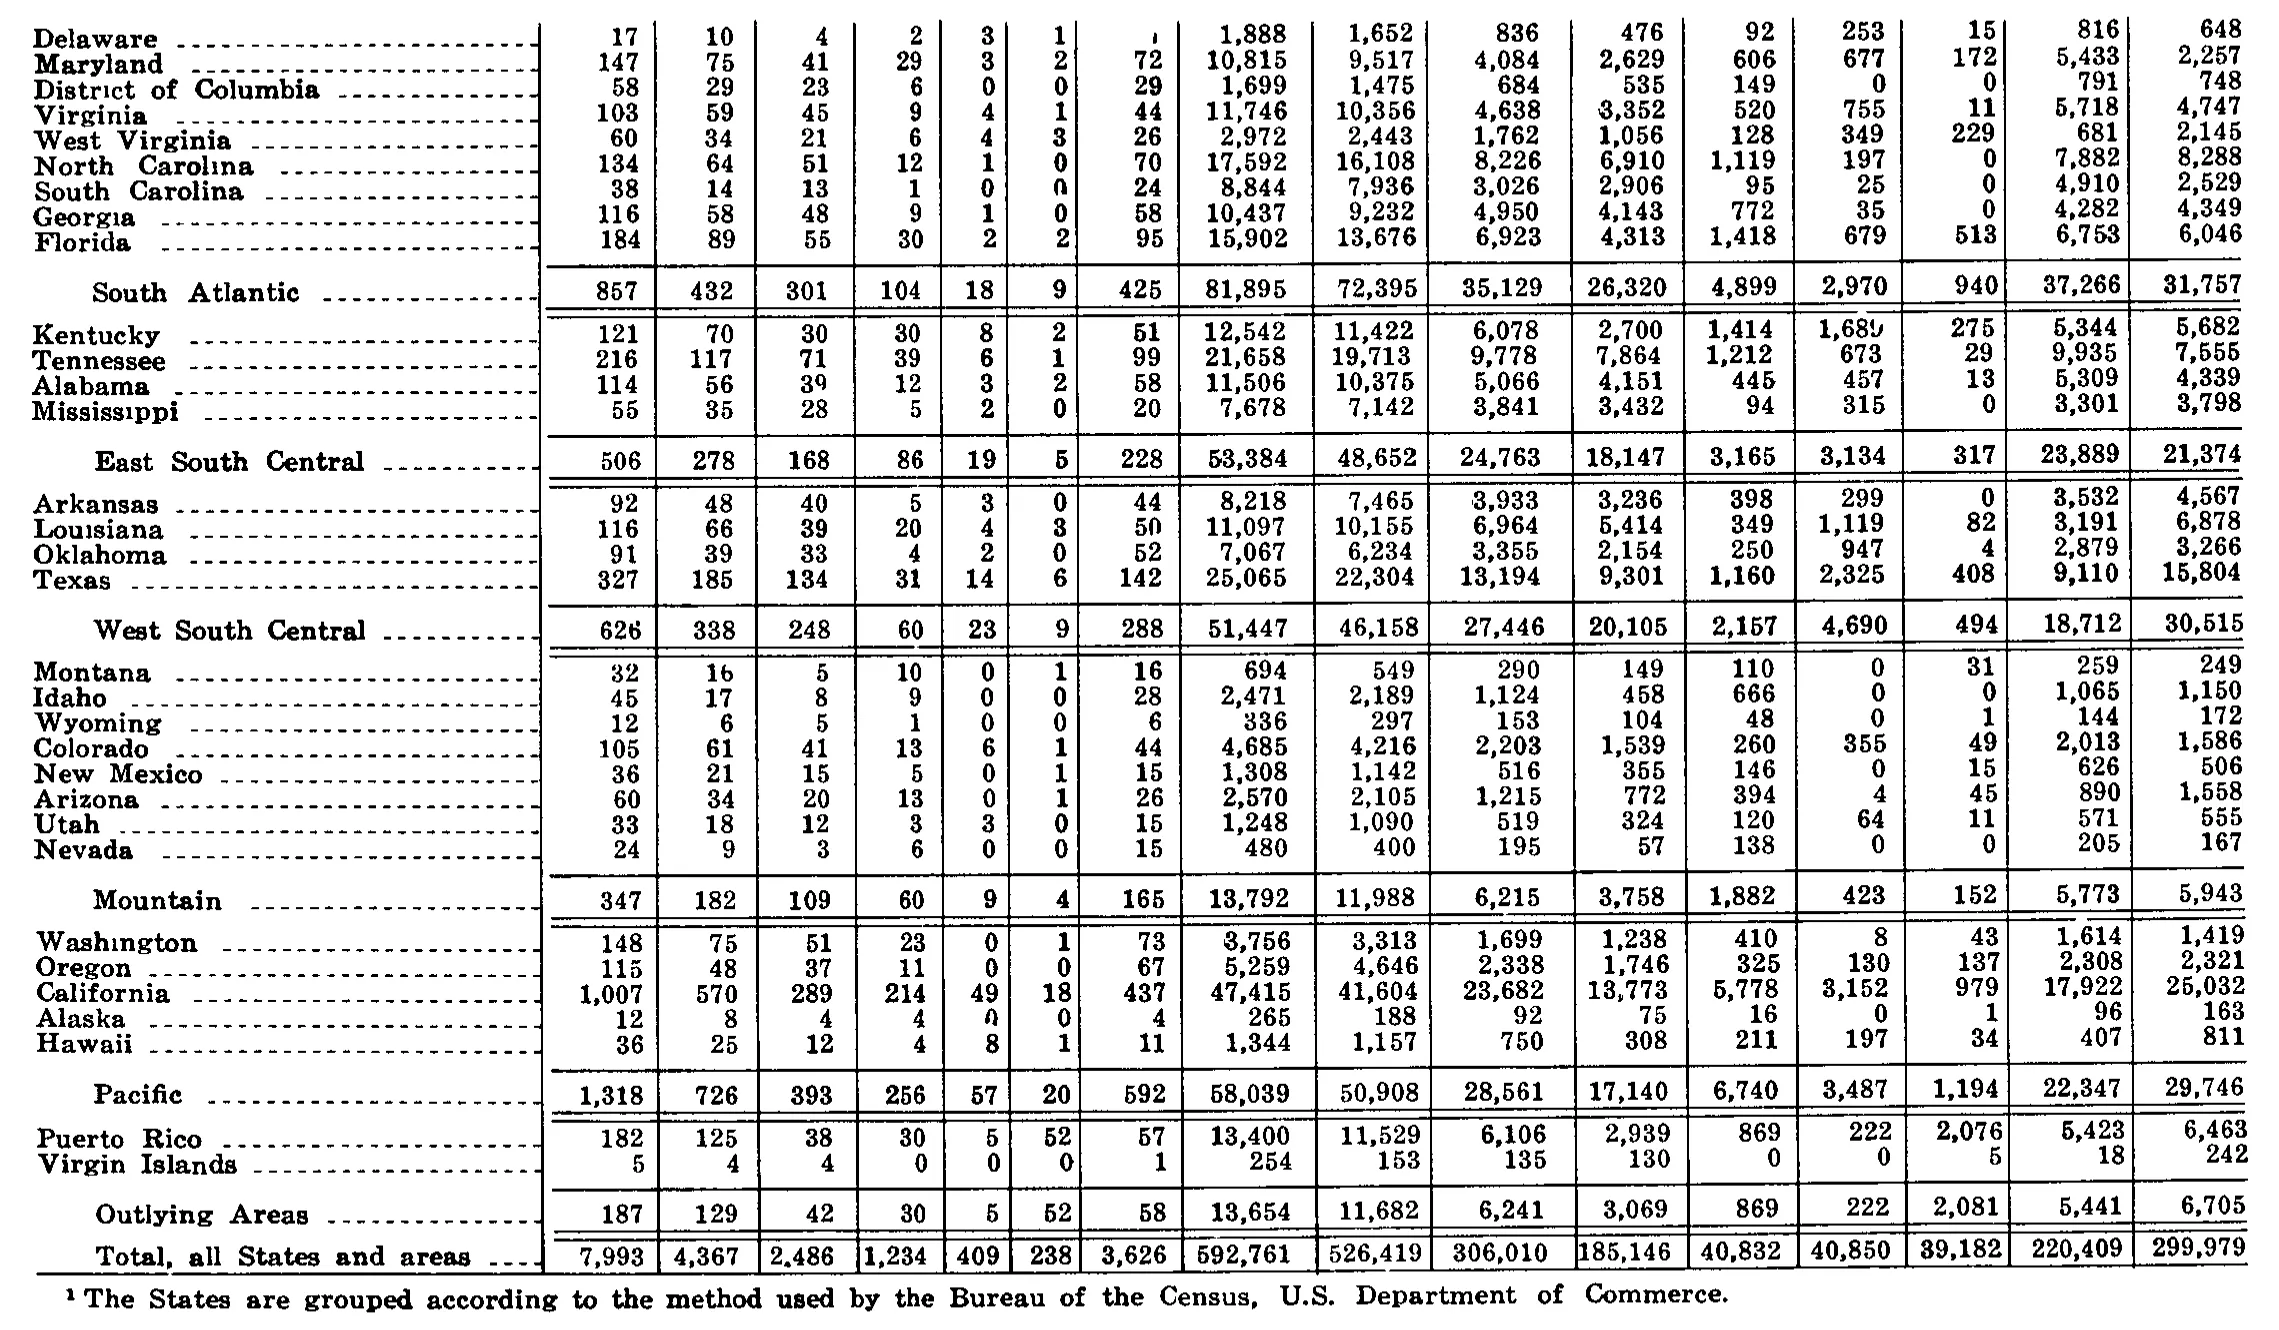
| Delaware | 17 | 10 | 4 | 2 | 3 | 1 | 7 | 1,888 | 1,652 | 836 | 476 | 92 | 253 | 15 | 816 | 648 |
| Maryland | 147 | 75 | 41 | 29 | 3 | 2 | 72 | 10,815 | 9,517 | 4,084 | 2,629 | 606 | 677 | 172 | 5,433 | 2,257 |
| District of Columbia | 58 | 29 | 23 | 6 | 0 | 0 | 29 | 1,699 | 1,475 | 684 | 535 | 149 | 0 | 0 | 791 | 748 |
| Virginia | 103 | 59 | 45 | 9 | 4 | 1 | 44 | 11,746 | 10,356 | 4,638 | 3,352 | 520 | 755 | 11 | 5,718 | 4,747 |
| West Virginia | 60 | 34 | 21 | 6 | 4 | 3 | 26 | 2,972 | 2,443 | 1,762 | 1,056 | 128 | 349 | 229 | 681 | 2,145 |
| North Carolina | 134 | 64 | 51 | 12 | 1 | 0 | 70 | 17,592 | 16,108 | 8,226 | 6,910 | 1,119 | 197 | 0 | 7,882 | 8,288 |
| South Carolina | 38 | 14 | 13 | 1 | 0 | 0 | 24 | 8,844 | 7,936 | 3,026 | 2,906 | 95 | 25 | 0 | 4,910 | 2,529 |
| Georgia | 116 | 58 | 48 | 9 | 1 | 0 | 58 | 10,437 | 9,232 | 4,950 | 4,143 | 772 | 35 | 0 | 4,282 | 4,349 |
| Florida | 184 | 89 | 55 | 30 | 2 | 2 | 95 | 15,902 | 13,676 | 6,923 | 4,313 | 1,418 | 679 | 513 | 6,753 | 6,046 |
| South Atlantic | 857 | 432 | 301 | 104 | 18 | 9 | 425 | 81,895 | 72,395 | 35,129 | 26,320 | 4,899 | 2,970 | 940 | 37,266 | 31,757 |
| Kentucky | 121 | 70 | 30 | 30 | 8 | 2 | 51 | 12,542 | 11,422 | 6,078 | 2,700 | 1,414 | 1,689 | 275 | 5,344 | 5,682 |
| Tennessee | 216 | 117 | 71 | 39 | 6 | 1 | 99 | 21,658 | 19,713 | 9,778 | 7,864 | 1,212 | 673 | 29 | 9,935 | 7,555 |
| Alabama | 114 | 56 | 39 | 12 | 3 | 2 | 58 | 11,506 | 10,375 | 5,066 | 4,151 | 445 | 457 | 13 | 5,309 | 4,339 |
| Mississippi | 55 | 35 | 28 | 5 | 2 | 0 | 20 | 7,678 | 7,142 | 3,841 | 3,432 | 94 | 315 | 0 | 3,301 | 3,798 |
| East South Central | 506 | 278 | 168 | 86 | 19 | 5 | 228 | 53,384 | 48,652 | 24,763 | 18,147 | 3,165 | 3,134 | 317 | 23,889 | 21,374 |
| Arkansas | 92 | 48 | 40 | 5 | 3 | 0 | 44 | 8,218 | 7,465 | 3,933 | 3,236 | 398 | 299 | 0 | 3,532 | 4,567 |
| Louisiana | 116 | 66 | 39 | 20 | 4 | 3 | 50 | 11,097 | 10,155 | 6,964 | 5,414 | 349 | 1,119 | 82 | 3,191 | 6,878 |
| Oklahoma | 91 | 39 | 33 | 4 | 2 | 0 | 52 | 7,067 | 6,234 | 3,355 | 2,154 | 250 | 947 | 4 | 2,879 | 3,266 |
| Texas | 327 | 185 | 134 | 31 | 14 | 6 | 142 | 25,065 | 22,304 | 13,194 | 9,301 | 1,160 | 2,325 | 408 | 9,110 | 15,804 |
| West South Central | 626 | 338 | 248 | 60 | 23 | 9 | 288 | 51,447 | 46,158 | 27,446 | 20,105 | 2,157 | 4,690 | 494 | 18,712 | 30,515 |
| Montana | 32 | 16 | 5 | 10 | 0 | 1 | 16 | 694 | 549 | 290 | 149 | 110 | 0 | 31 | 259 | 249 |
| Idaho | 45 | 17 | 8 | 9 | 0 | 0 | 28 | 2,471 | 2,189 | 1,124 | 458 | 666 | 0 | 0 | 1,065 | 1,150 |
| Wyoming | 12 | 6 | 5 | 1 | 0 | 0 | 6 | 336 | 297 | 153 | 104 | 48 | 0 | 1 | 144 | 172 |
| Colorado | 105 | 61 | 41 | 13 | 6 | 1 | 44 | 4,685 | 4,216 | 2,203 | 1,539 | 260 | 355 | 49 | 2,013 | 1,586 |
| New Mexico | 36 | 21 | 15 | 5 | 0 | 1 | 15 | 1,308 | 1,142 | 516 | 355 | 146 | 0 | 15 | 626 | 506 |
| Arizona | 60 | 34 | 20 | 13 | 0 | 1 | 26 | 2,570 | 2,105 | 1,215 | 772 | 394 | 4 | 45 | 890 | 1,558 |
| Utah | 33 | 18 | 12 | 3 | 3 | 0 | 15 | 1,248 | 1,090 | 519 | 324 | 120 | 64 | 11 | 571 | 555 |
| Nevada | 24 | 9 | 3 | 6 | 0 | 0 | 15 | 480 | 400 | 195 | 57 | 138 | 0 | 0 | 205 | 167 |
| Mountain | 347 | 182 | 109 | 60 | 9 | 4 | 165 | 13,792 | 11,988 | 6,215 | 3,758 | 1,882 | 423 | 152 | 5,773 | 5,943 |
| Washington | 148 | 75 | 51 | 23 | 0 | 1 | 73 | 3,756 | 3,313 | 1,699 | 1,238 | 410 | 8 | 43 | 1,614 | 1,419 |
| Oregon | 115 | 48 | 37 | 11 | 0 | 0 | 67 | 5,259 | 4,646 | 2,338 | 1,746 | 325 | 130 | 137 | 2,308 | 2,321 |
| California | 1,007 | 570 | 289 | 214 | 49 | 18 | 437 | 47,415 | 41,604 | 23,682 | 13,773 | 5,778 | 3,152 | 979 | 17,922 | 25,032 |
| Alaska | 12 | 8 | 4 | 4 | 0 | 0 | 4 | 265 | 188 | 92 | 75 | 16 | 0 | 1 | 96 | 163 |
| Hawaii | 36 | 25 | 12 | 4 | 8 | 1 | 11 | 1,344 | 1,157 | 750 | 308 | 211 | 197 | 34 | 407 | 811 |
| Pacific | 1,318 | 726 | 393 | 256 | 57 | 20 | 592 | 58,039 | 50,908 | 28,561 | 17,140 | 6,740 | 3,487 | 1,194 | 22,347 | 29,746 |
| Puerto Rico | 182 | 125 | 38 | 30 | 5 | 52 | 57 | 13,400 | 11,529 | 6,106 | 2,939 | 869 | 222 | 2,076 | 5,423 | 6,463 |
| Virgin Islands | 5 | 4 | 4 | 0 | 0 | 0 | 1 | 254 | 153 | 135 | 130 | 0 | 0 | 5 | 18 | 242 |
| Outlying Areas | 187 | 129 | 42 | 30 | 5 | 52 | 58 | 13,654 | 11,682 | 6,241 | 3,069 | 869 | 222 | 2,081 | 5,441 | 6,705 |
| Total, all States and areas | 7,993 | 4,367 | 2,486 | 1,234 | 409 | 238 | 3,626 | 592,761 | 526,419 | 306,010 | 185,146 | 40,832 | 40,850 | 39,182 | 220,409 | 299,979 |
- 1 The States are grouped according to the method used by the Bureau of the Census, U.S. Department of Commerce.
957 of 959 figures sit in a row or column sum that works out. 5 cells break a sum: 'Ohio', column 3: prints 279, columns 4 to 7 add to 280; 'West South Central', column 3: prints 338, columns 4 to 7 add to 340; 'West South Central', column 4: prints 248, rows 'Arkansas' to 'Texas' add to 246; 'East North Central', column 4: prints 548, rows 'Ohio' to 'Wisconsin' add to 549; 'Total, all States and areas', column 4: prints 2,486, the subtotals in rows 'New England' to 'Outlying Areas' add to 2,488.
Reader’s notes
p. 239. 17 columns: stub, "Total elections", a five-column "Number of elections in which representation rights were won by unions" block, three tall single columns, a five-column "Valid votes cast for unions" block, and two tall single columns. Crop coverage: the table ends mid-way at the "West North Central" division total; the remaining divisions (South Atlantic onward) and the United States total continue on the following page(s). The marker "1" on the stub heading "Division and State" has no footnote text printed within this crop, so `footnotes` is empty. Doubtful cell — Ohio, "AFL-CIO unions" under elections won (column 3): transcribed as printed-looking "163", but this is the one cell in the crop that fails the table's internal arithmetic in two independent ways. Ohio's own row of union breakdowns gives 163+71+36+10 = 280 against a printed row total of 279, and the East North Central column gives 163+77+129+111+69 = 549 against a printed column total of 548. Both checks are satisfied by 162, so the true printed digit is very likely "2" and my reading of "3" is probably a scan artifact; I left it as read rather than correcting it. Every other row and column in the crop cross-foots exactly (union-breakdown rows to their totals, vote columns to division totals, union votes plus no-union votes to total valid votes, and elections won plus no-representative to total elections). Last column heading: printed in a narrow column as "Eligible employee in units choosing representa-tion"; the word before "in units" reads as singular "employee" at this resolution, though the usual wording in this report series is "employees" — transcribed as read. Minor: the scan renders several "i" characters in the headings and state names (e.g. "unions", "elections", "Ohio", "Michigan", "Wisconsin") with a faint or missing dot; these are ordinary letters and were transcribed normally.
p. 240. This crop is a continuation page: no column headings or caption are printed on it, so header_rows is empty. The grid has 17 columns (stub plus 16 numeric columns), fixed by the column rules and confirmed throughout by the printed subtotals. Doubtful cells: - Delaware, column 7 (the column that holds 72 for Maryland, 29 for District of Columbia): the glyph is almost entirely broken away in the scan, leaving only a short stroke. I read it as 7, which is what both the row's own structure (17 minus 10) and the South Atlantic subtotal of 425 require. Treat the character as inferred rather than clearly legible. - Kentucky, column 13 (the column that holds 253 for Delaware): printed 1,689; the final digit is blotted and could be misread as 0 or 6. The East South Central subtotal of 3,134 supports 1,689. Suspected misprint, transcribed as printed and not corrected: - West South Central, column 3 (the column that holds 4 for Delaware, 301 for South Atlantic): printed 248, but the four member States in that column (Arkansas 40, Louisiana 39, Oklahoma 33, Texas 134) sum to 246. Every other cell of the West South Central line agrees with its member States, and each of those four State rows is internally consistent (columns 3+4+5+6 equal column 2), so the discrepancy sits in the printed subtotal itself. I re-examined the glyph on a second pass and it still reads 248. All other rows and regional subtotals cross-check without exception, both down the State columns and across each row (column 3+4+5+6 = column 2; column 1 minus column 2 = column 7; columns 11+12+13+14 = column 10; column 9 minus column 10 = column 15). Row labels carry scanning artifacts where a dotted i has lost its dot (Mississippi, Washington, Carolina, Virginia, Alabama); I have spelled them conventionally.
Source image
Source data: U.S. NLRB Annual Reports (public domain). Reconstruction by NLRB Stats Archive. Read by claude-opus-5 (effort max, prompt extract_v1) from the 300-dpi scan; stitched by page. Updated October 2026.