NLRB Stats Archive › Annual Reports › FY1969 › Cases closed
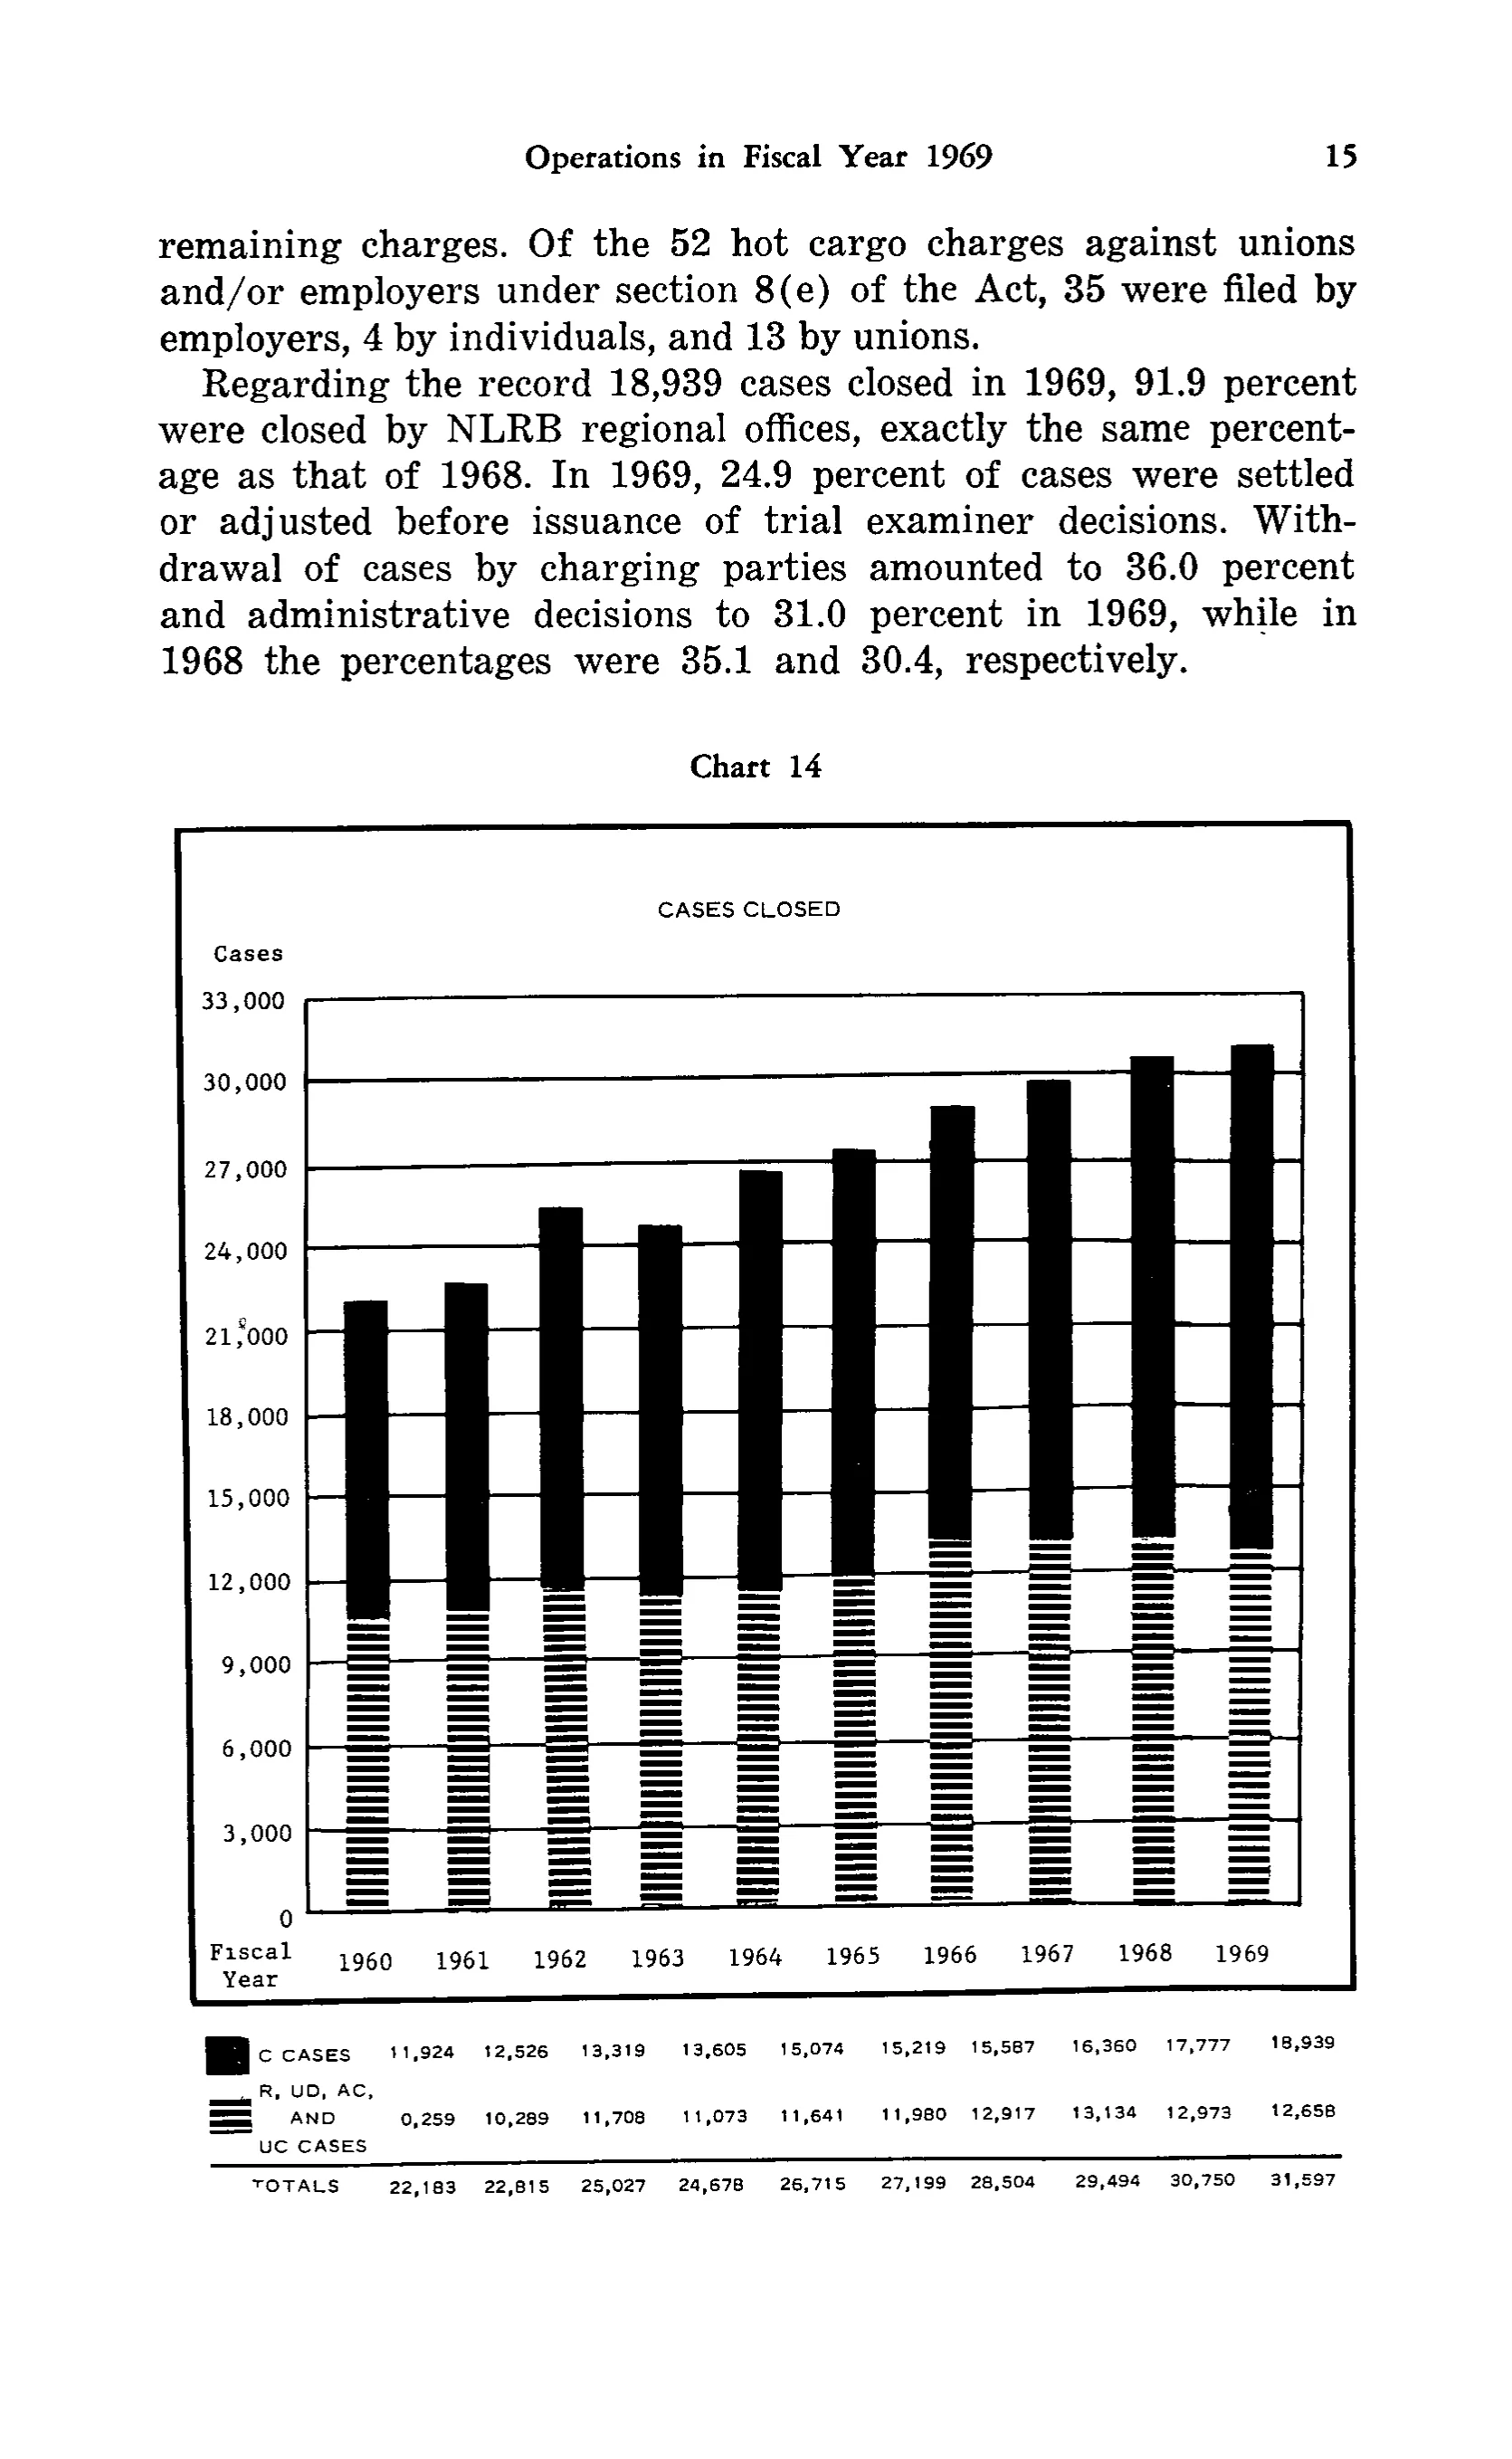
Cases closed
| Fiscal Year | 1960 | 1961 | 1962 | 1963 | 1964 | 1965 | 1966 | 1967 | 1968 | 1969 |
|---|---|---|---|---|---|---|---|---|---|---|
| C CASES | 11,924 | 12,526 | 13,319 | 13,605 | 15,074 | 15,219 | 15,587 | 16,360 | 17,777 | 18,939 |
| R, UD, AC, AND UC CASES | 0,259 | 10,289 | 11,708 | 11,073 | 11,641 | 11,980 | 12,917 | 13,134 | 12,973 | 12,658 |
| TOTALS | 22,183 | 22,815 | 25,027 | 24,678 | 26,715 | 27,199 | 28,504 | 29,494 | 30,750 | 31,597 |
27 of 30 figures sit in a row or column sum that works out. 1 cell breaks a sum: 'TOTALS', column 2: prints 22,183, rows 'C CASES' to 'R, UD, AC, AND UC CA' add to 12,183.
Reader’s notes
p. 26. The transcribed grid is the data legend/table printed beneath Chart 14 ("CASES CLOSED"); the bar graph itself (y-axis scale 0-33,000 and the stacked bars) is not transcribed. The column headings are the "Fiscal Year" axis labels 1960-1969, which head the columns of the data table below. Row 2 ("R, UD, AC, AND UC CASES") is printed on three lines ("R, UD, AC," / "AND" / "UC CASES") and joined here. Suspected misprint: the 1960 cell of "R, UD, AC, AND UC CASES" is printed as "0,259" — the leading digit appears to have dropped out in printing, since 22,183 - 11,924 = 10,259; transcribed as printed. Every other column's two components sum exactly to the printed TOTALS.
Source image
Source data: U.S. NLRB Annual Reports (public domain). Reconstruction by NLRB Stats Archive. Read by claude-opus-5 (effort max, prompt extract_v1) from the 300-dpi scan; stitched by page. Updated October 2026.