NLRB Stats Archive › Annual Reports › FY1969 › Decisions issued
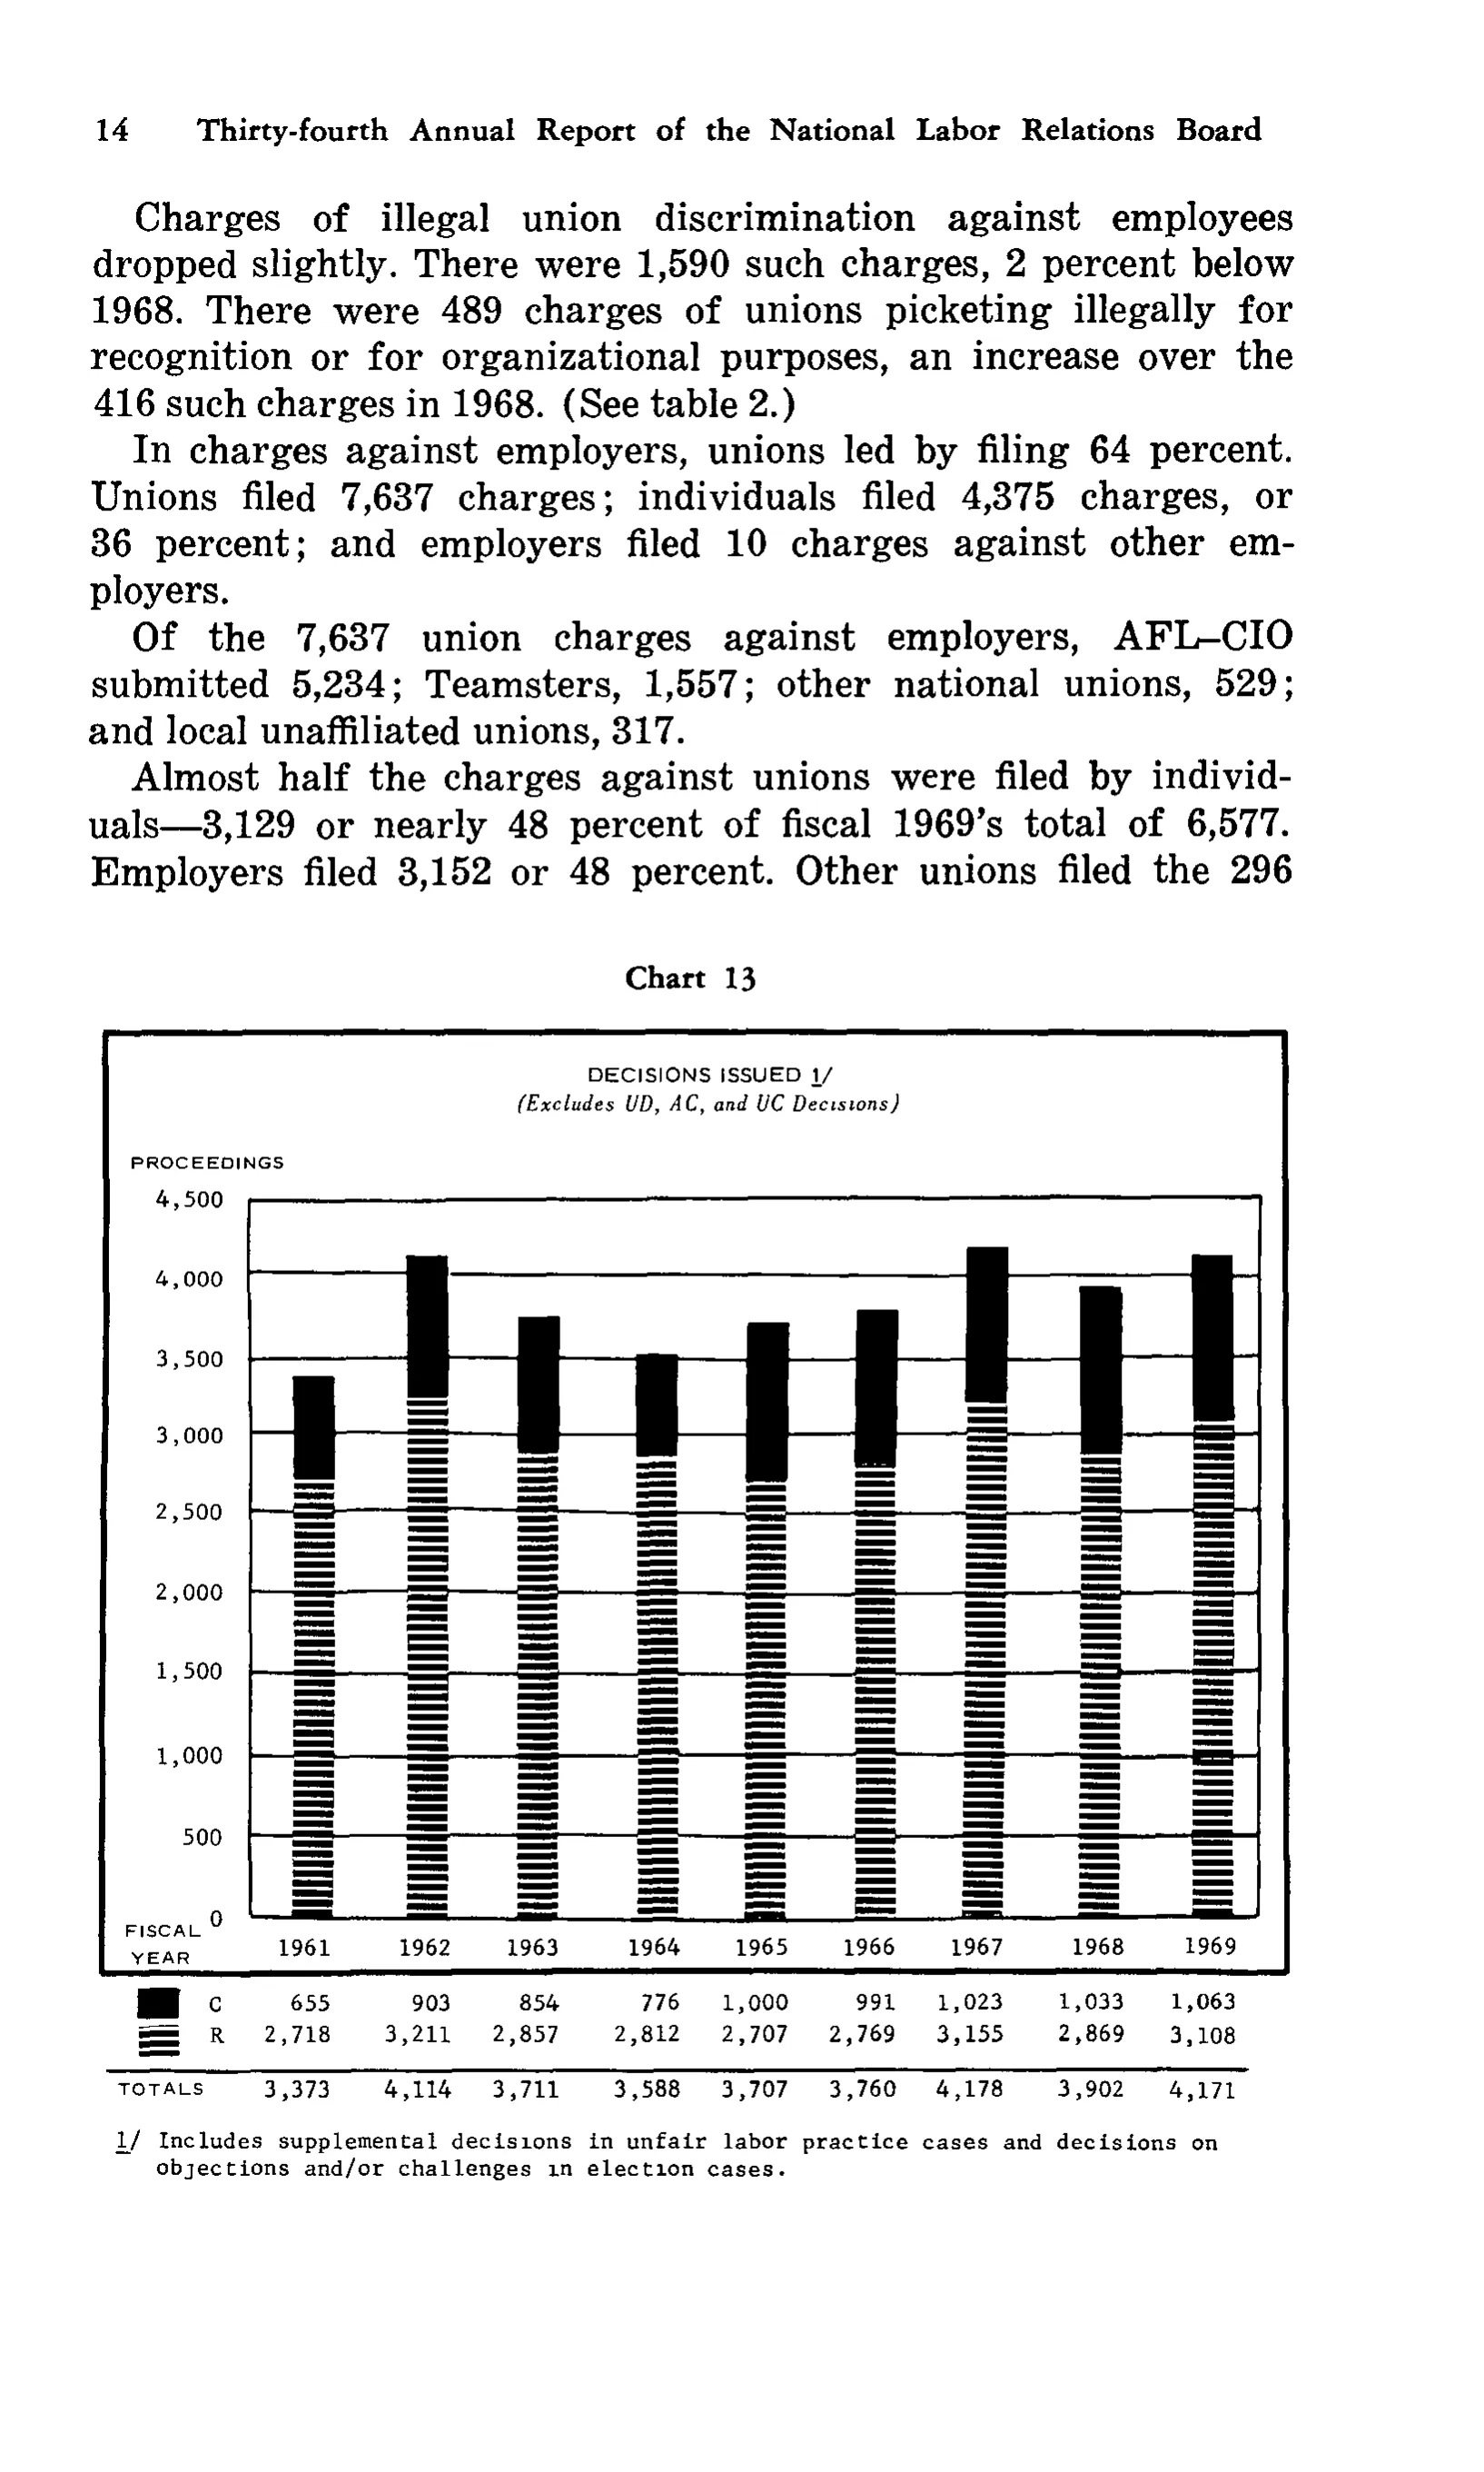
Decisions issued
| FISCAL YEAR | 1961 | 1962 | 1963 | 1964 | 1965 | 1966 | 1967 | 1968 | 1969 |
|---|---|---|---|---|---|---|---|---|---|
| C | 655 | 903 | 854 | 776 | 1,000 | 991 | 1,023 | 1,033 | 1,063 |
| R | 2,718 | 3,211 | 2,857 | 2,812 | 2,707 | 2,769 | 3,155 | 2,869 | 3,108 |
| TOTALS | 3,373 | 4,114 | 3,711 | 3,588 | 3,707 | 3,760 | 4,178 | 3,902 | 4,171 |
- 1/ Includes supplemental decisions in unfair labor practice cases and decisions on objections and/or challenges in election cases.
27 of 27 figures sit in a row or column sum that works out.
Reader’s notes
p. 25. The crop is a full report page: body text at the top, then Chart 13. The only tabular matter is the data block printed under the bars of the chart, which is what is transcribed here. The chart's own title lines, "DECISIONS ISSUED 1/" and "(Excludes UD, AC, and UC Decisions)", are treated as the caption and omitted; the footnote marker 1/ in that title is the one answered by the footnote below the chart. The stub heading is printed on two lines as "FISCAL / YEAR" at the left of the year axis labels; it is joined to "FISCAL YEAR". In the stub, each of the C and R labels is preceded by a small legend swatch (a solid black block for C, a horizontally striped block for R) matching the bar segments; the swatches are graphic keys, not a separate text column, so they are not transcribed. The TOTALS row is set off by a horizontal rule above it. All values are legible; each year's C + R equals the printed TOTALS.
Source image
Source data: U.S. NLRB Annual Reports (public domain). Reconstruction by NLRB Stats Archive. Read by claude-opus-5 (effort max, prompt extract_v1) from the 300-dpi scan; stitched by page. Updated October 2026.