NLRB Stats Archive › Annual Reports › FY1969 › Board case backlog
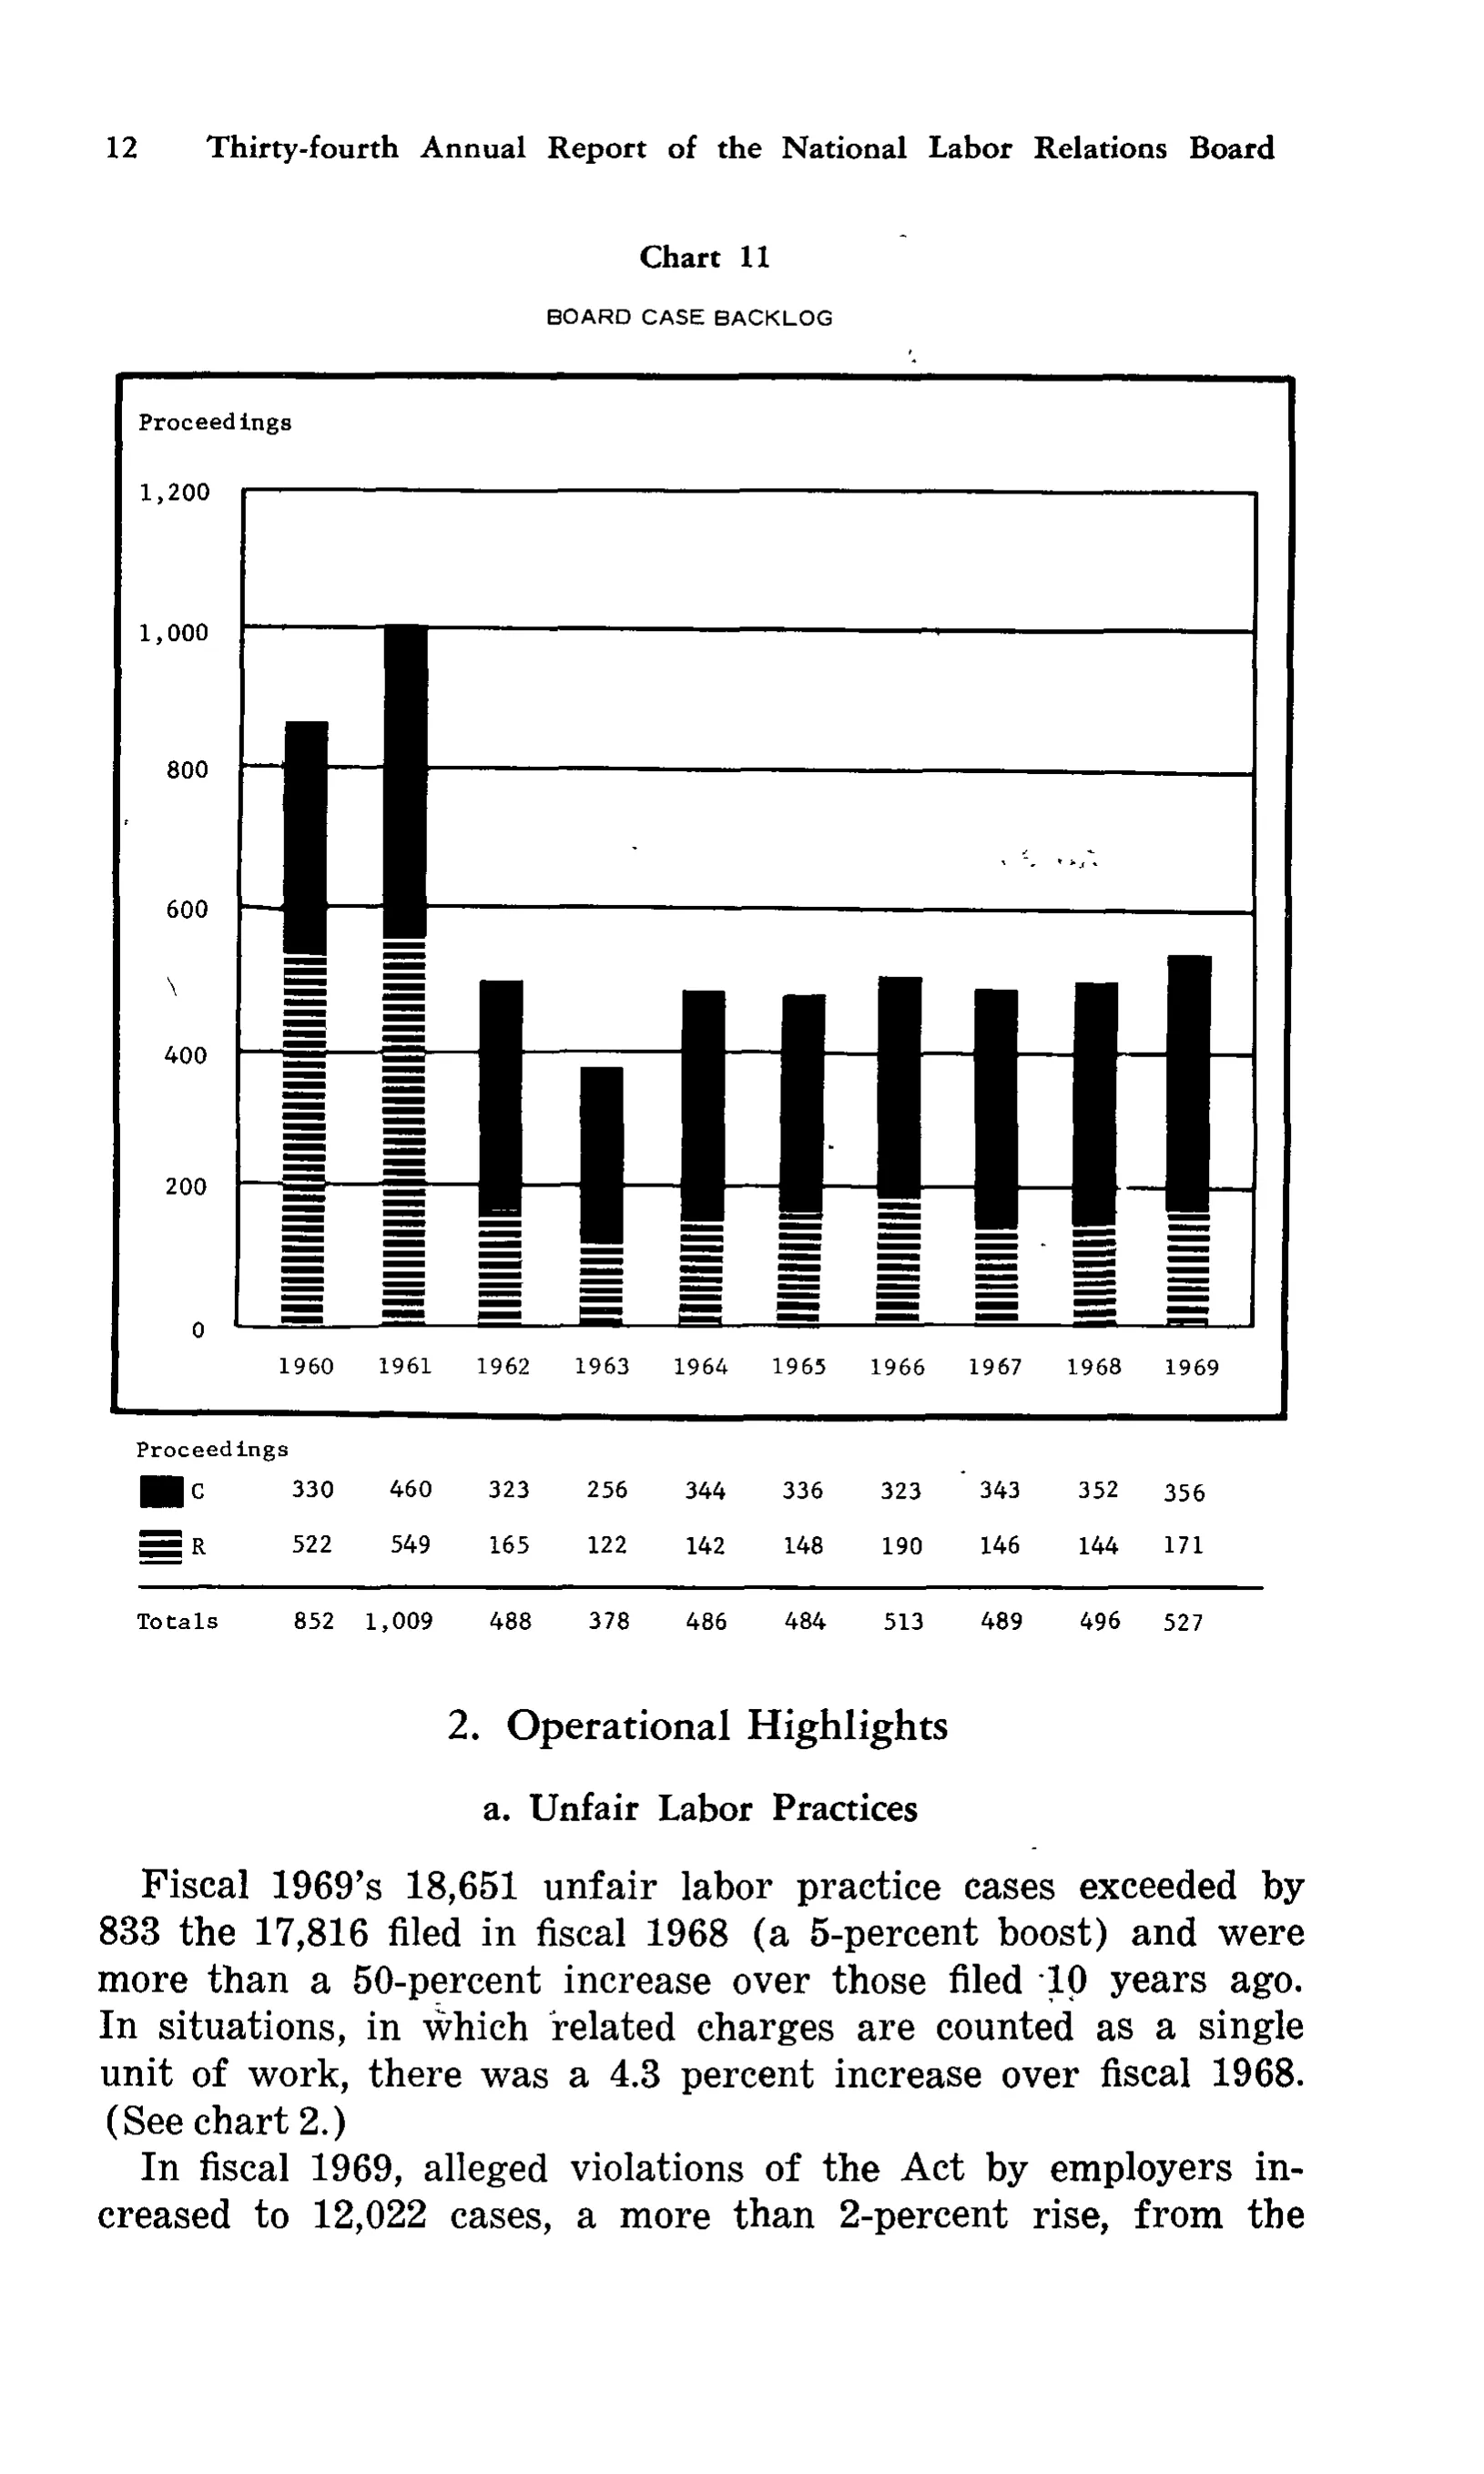
Board case backlog
| Proceedings | 1960 | 1961 | 1962 | 1963 | 1964 | 1965 | 1966 | 1967 | 1968 | 1969 |
|---|---|---|---|---|---|---|---|---|---|---|
| C | 330 | 460 | 323 | 256 | 344 | 336 | 323 | 343 | 352 | 356 |
| R | 522 | 549 | 165 | 122 | 142 | 148 | 190 | 146 | 144 | 171 |
| Totals | 852 | 1,009 | 488 | 378 | 486 | 484 | 513 | 489 | 496 | 527 |
30 of 30 figures sit in a row or column sum that works out.
Reader’s notes
p. 23. This crop is a chart page: the "table" is the small data strip printed under Chart 11 (BOARD CASE BACKLOG), which tabulates the plotted bars. The column headings 1960-1969 are the year labels printed on the chart's horizontal axis immediately above the data strip; each data value sits squarely under its year, so they are transcribed as the single heading level. "Proceedings" is printed at the left above the row labels (it is also repeated as the y-axis label inside the chart box) and is taken here as the stub heading / unit label. The row labels "C" and "R" are each preceded by a printed legend swatch (solid black for C, horizontal-hatched for R); the swatches are graphics, not text, so they are not transcribed. A horizontal rule separates the R row from the Totals row. There is a small stray tick mark printed just above the "343" cell (row C, 1967 column) and a few scattered specks in the chart area; these appear to be scanning artifacts, not footnote markers, and the page prints no footnotes. All ten column totals equal C + R as printed.
Source image
Source data: U.S. NLRB Annual Reports (public domain). Reconstruction by NLRB Stats Archive. Read by claude-opus-5 (effort max, prompt extract_v1) from the 300-dpi scan; stitched by page. Updated October 2026.