NLRB Stats Archive › Annual Reports › FY1969 › Trial examiner hearings and decisions
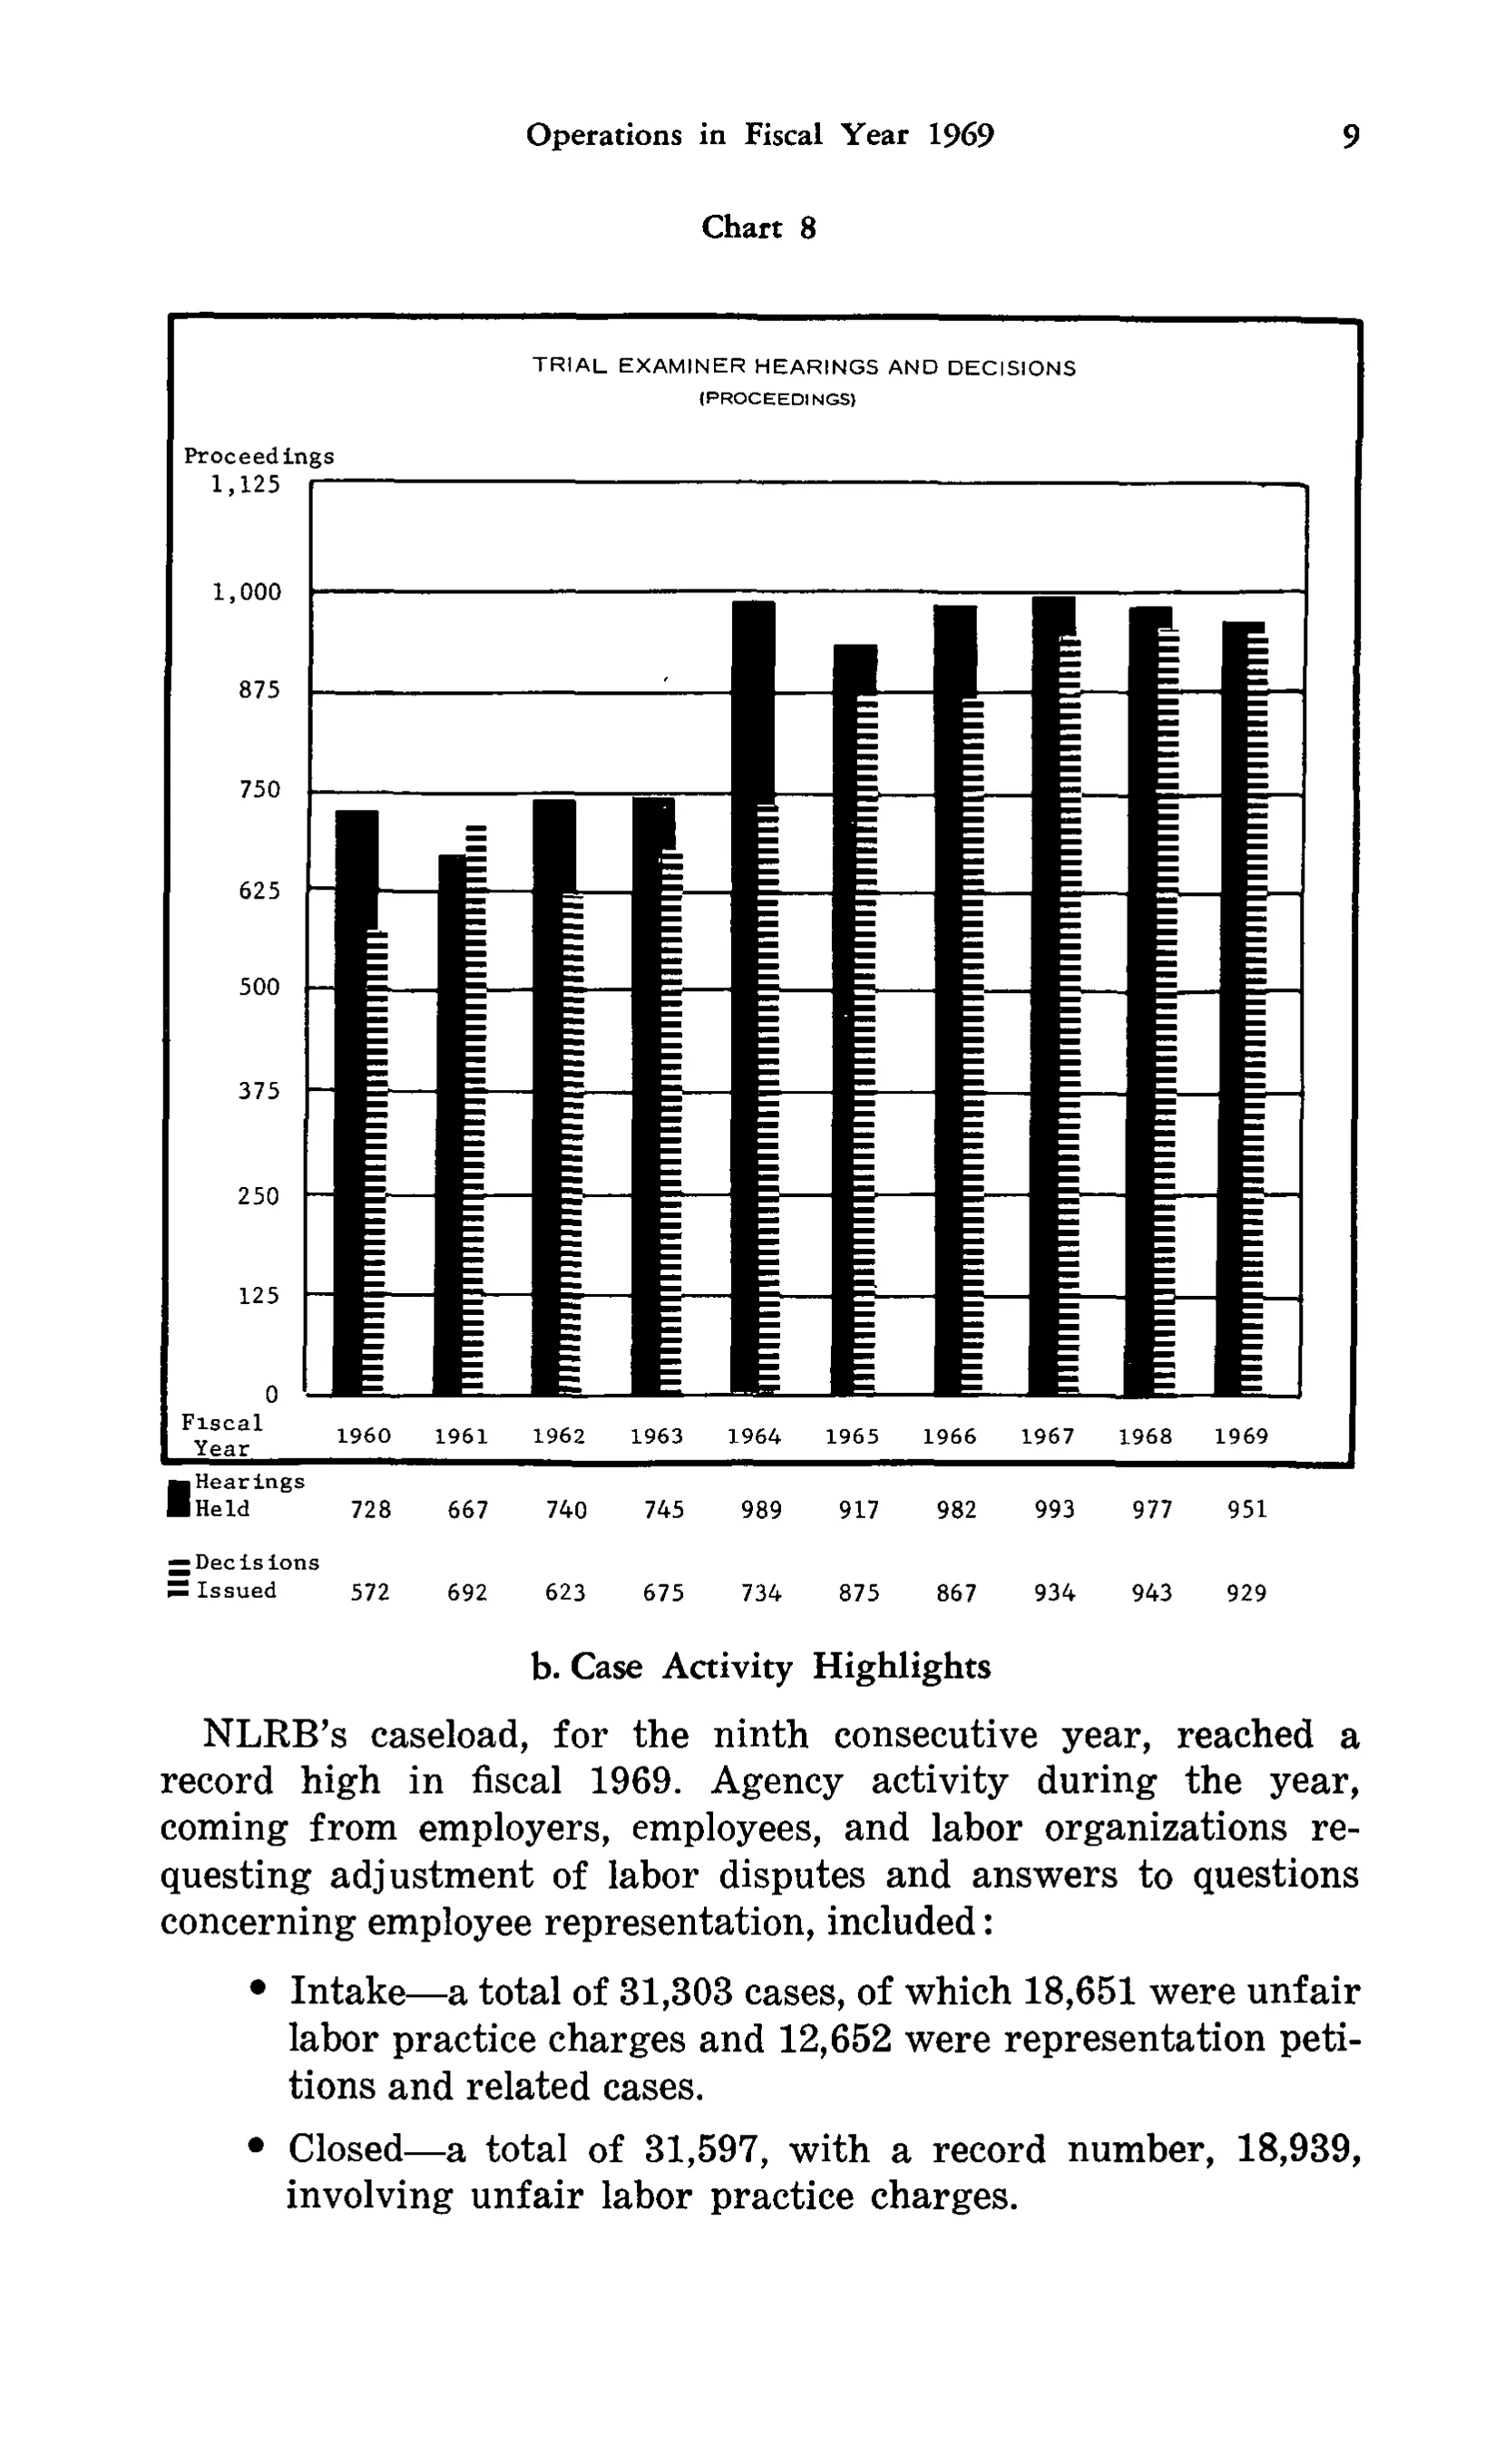
Trial examiner hearings and decisions
| Fiscal Year | 1960 | 1961 | 1962 | 1963 | 1964 | 1965 | 1966 | 1967 | 1968 | 1969 |
|---|---|---|---|---|---|---|---|---|---|---|
| Hearings Held | 728 | 667 | 740 | 745 | 989 | 917 | 982 | 993 | 977 | 951 |
| Decisions Issued | 572 | 692 | 623 | 675 | 734 | 875 | 867 | 934 | 943 | 929 |
0 of 20 figures sit in a row or column sum that works out.
Reader’s notes
p. 20. The crop is Chart 8, a bar chart ("TRIAL EXAMINER HEARINGS AND DECISIONS (PROCEEDINGS)"), with a small data panel printed beneath the plot; that data panel is what is transcribed here. The chart's y-axis label "Proceedings" and its scale ticks (1,125 / 1,000 / 875 / 750 / 625 / 500 / 375 / 250 / 125 / 0) are plot furniture and are not part of the grid. "Fiscal Year" is printed at the left of the row of year labels and is taken as the stub heading. Each row label is preceded by a small legend patch (solid black block for "Hearings Held", striped block for "Decisions Issued"); these are legend keys, not footnote markers, and are omitted. The page also carries unrelated running text ("b. Case Activity Highlights" and following paragraphs) below the chart, which is not tabular and is not transcribed. All digits in the data panel are clearly printed; the 1966 "Decisions Issued" value (867) sits lower than the drawn striped bar appears to suggest, but it is transcribed as printed.
Source image
Source data: U.S. NLRB Annual Reports (public domain). Reconstruction by NLRB Stats Archive. Read by claude-opus-5 (effort max, prompt extract_v1) from the 300-dpi scan; stitched by page. Updated October 2026.