NLRB Stats Archive › Annual Reports › FY1969 › Unfair labor practice merit factor
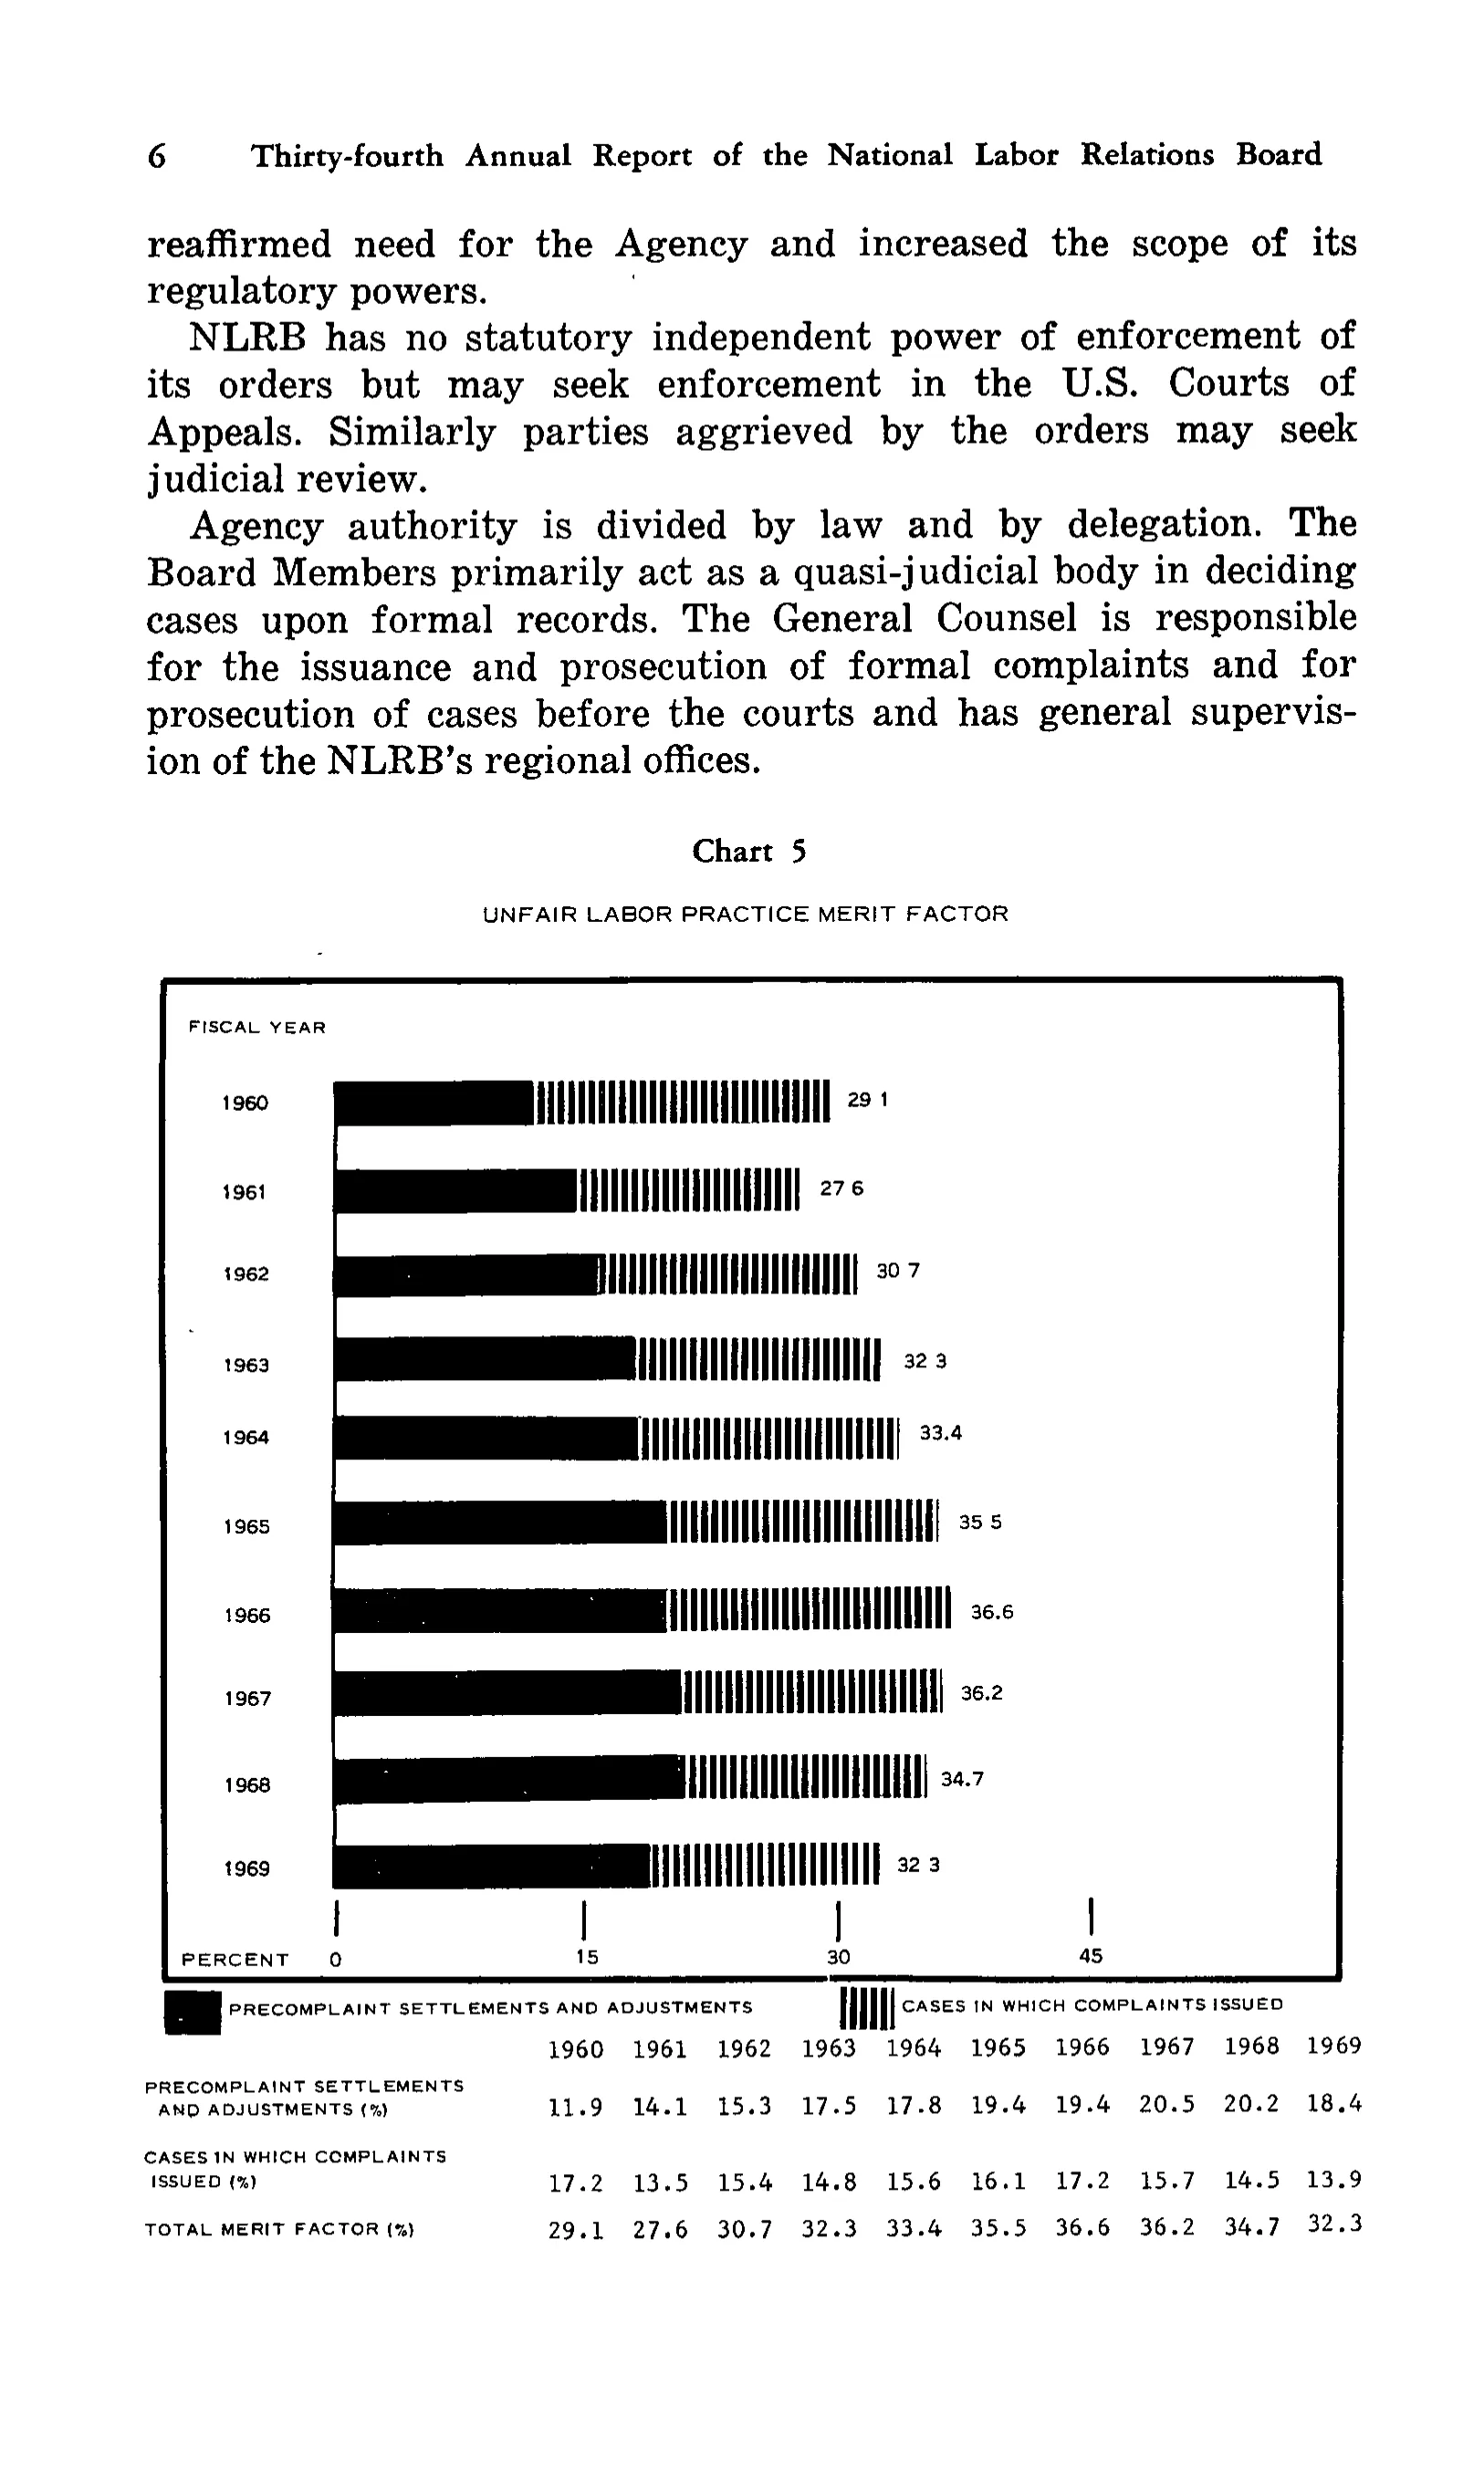
Unfair labor practice merit factor
| 1960 | 1961 | 1962 | 1963 | 1964 | 1965 | 1966 | 1967 | 1968 | 1969 | |
|---|---|---|---|---|---|---|---|---|---|---|
| PRECOMPLAINT SETTLEMENTS AND ADJUSTMENTS (%) | 11.9 | 14.1 | 15.3 | 17.5 | 17.8 | 19.4 | 19.4 | 20.5 | 20.2 | 18.4 |
| CASES IN WHICH COMPLAINTS ISSUED (%) | 17.2 | 13.5 | 15.4 | 14.8 | 15.6 | 16.1 | 17.2 | 15.7 | 14.5 | 13.9 |
| TOTAL MERIT FACTOR (%) | 29.1 | 27.6 | 30.7 | 32.3 | 33.4 | 35.5 | 36.6 | 36.2 | 34.7 | 32.3 |
Reader’s notes
p. 17. The crop is a text page whose only tabular matter is the small data table printed beneath Chart 5 ("UNFAIR LABOR PRACTICE MERIT FACTOR"); that table is what is transcribed here. The stub cell of the year header is blank on the page. The two legend captions printed just above the year headings ("PRECOMPLAINT SETTLEMENTS AND ADJUSTMENTS" with a solid-black key, "CASES IN WHICH COMPLAINTS ISSUED" with a hatched key) belong to the chart legend, not to the table body, so they are not entered as rows; the same two categories appear as the first two data rows with "(%)" appended. Each row label is printed on two lines except "TOTAL MERIT FACTOR (%)"; the lines are joined. The bar-end annotations inside the chart (29 1, 27 6, 30 7, 32 3, 33.4, 35 5, 36.6, 36.2, 34.7, 32 3) duplicate the TOTAL MERIT FACTOR row; the decimal points in several of them are lost in the scan, but the table row below prints them clearly and is the source used. All ten columns check out as the sum of the first two rows equalling the third, so no misprint is suspected. Chart 5 itself is a bar graph, not a grid, and is not transcribed.
Source image
Source data: U.S. NLRB Annual Reports (public domain). Reconstruction by NLRB Stats Archive. Read by claude-opus-5 (effort max, prompt extract_v1) from the 300-dpi scan; stitched by page. Updated October 2026.