NLRB Stats Archive › Annual Reports › FY1968 › Proceedings Decided by Circuit Courts of Appeals on Petitions for Enforcement and/or Review of Board Orders, Fiscal Year 1968 Compared With 5-Year Cumulative Totals, Fiscal Years 1963 Through 1967
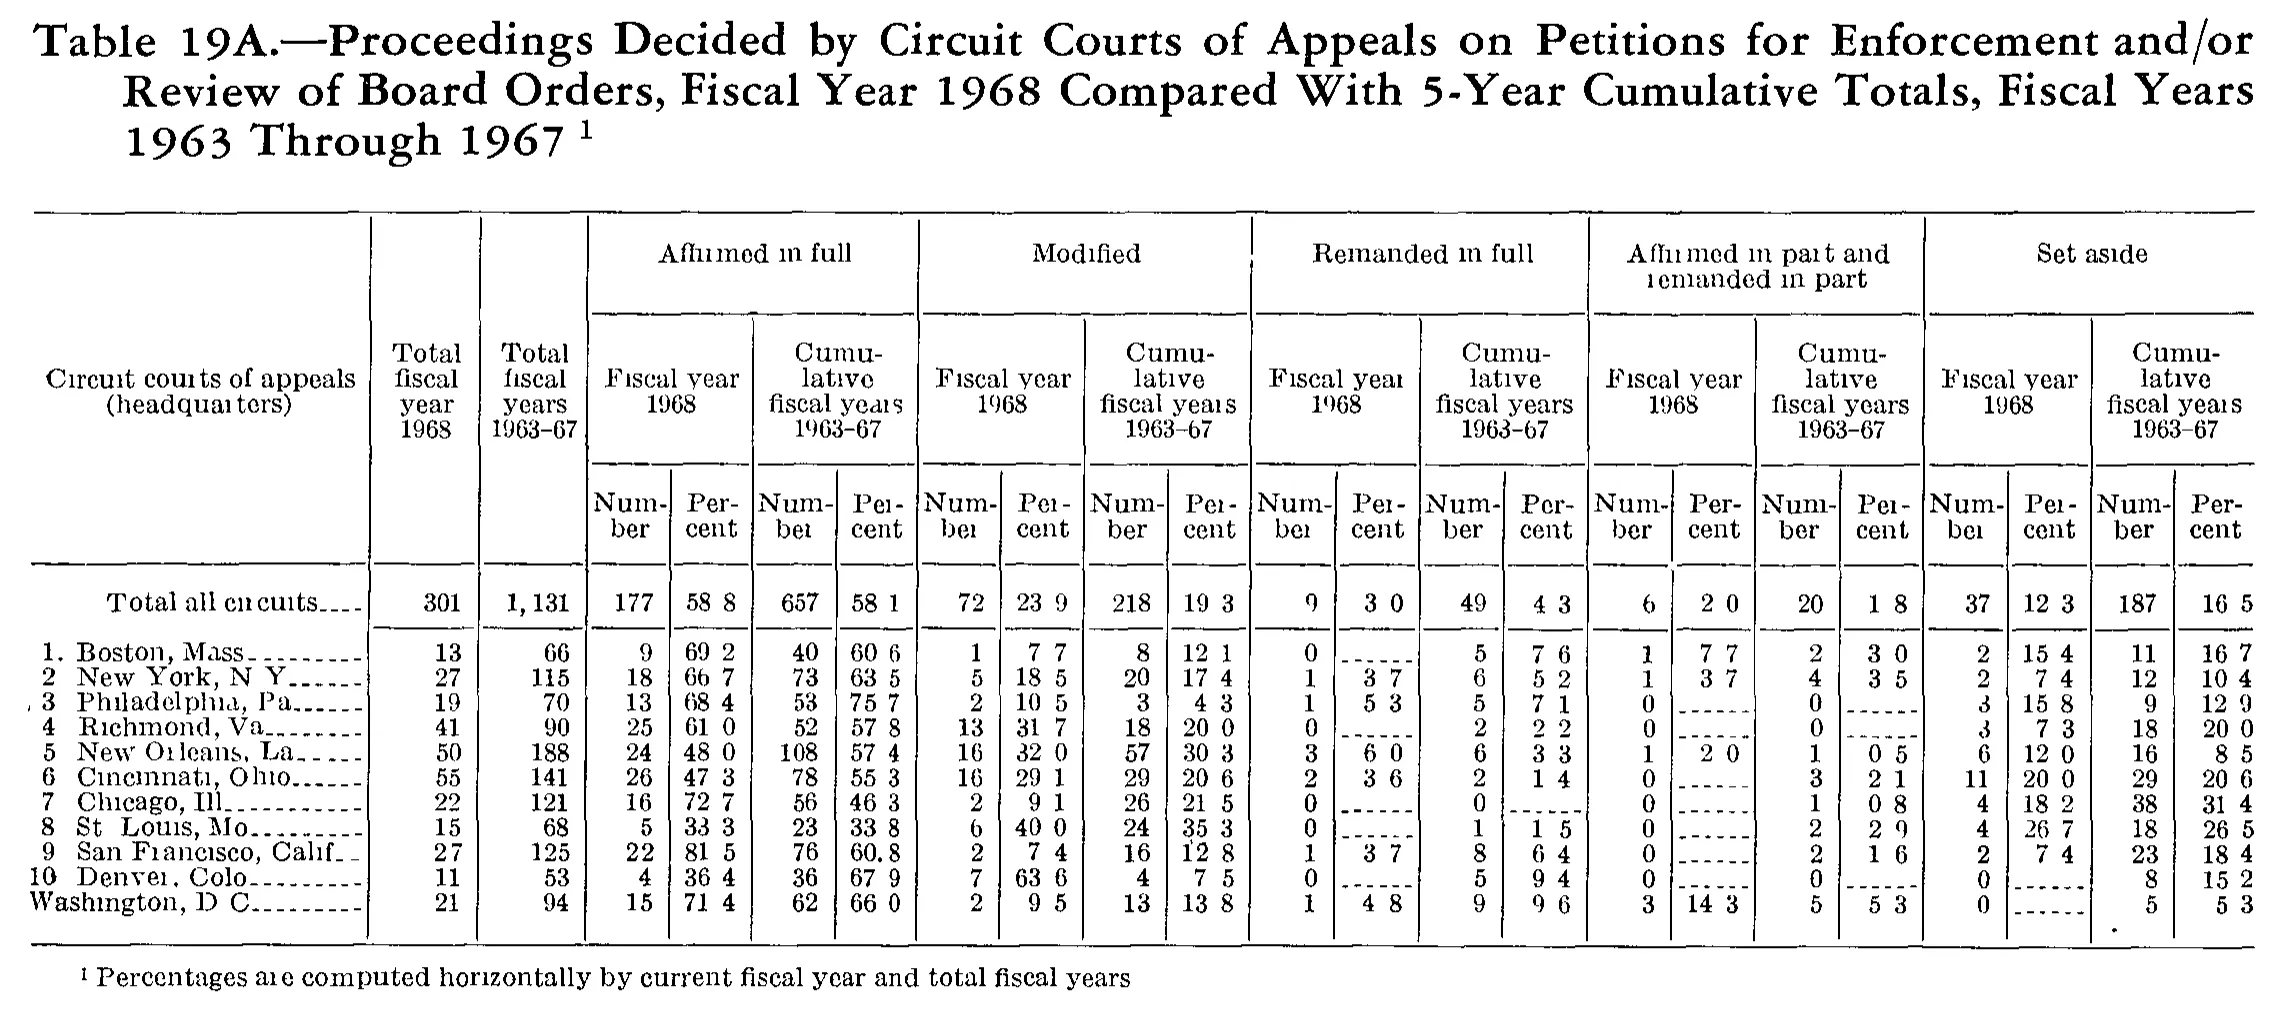
Proceedings Decided by Circuit Courts of Appeals on Petitions for Enforcement and/or Review of Board Orders, Fiscal Year 1968 Compared With 5-Year Cumulative Totals, Fiscal Years 1963 Through 1967
| Circuit courts of appeals (headquarters) | Total fiscal year 1968 | Total fiscal years 1963-67 | Affirmed in full | Modified | Remanded in full | Affirmed in part and remanded in part | Set aside | |||||||||||||||
|---|---|---|---|---|---|---|---|---|---|---|---|---|---|---|---|---|---|---|---|---|---|---|
| Circuit courts of appeals (headquarters) | Total fiscal year 1968 | Total fiscal years 1963-67 | Fiscal year 1968 | Cumulative fiscal years 1963-67 | Fiscal year 1968 | Cumulative fiscal years 1963-67 | Fiscal year 1968 | Cumulative fiscal years 1963-67 | Fiscal year 1968 | Cumulative fiscal years 1963-67 | Fiscal year 1968 | Cumulative fiscal years 1963-67 | ||||||||||
| Circuit courts of appeals (headquarters) | Total fiscal year 1968 | Total fiscal years 1963-67 | Number | Percent | Number | Percent | Number | Percent | Number | Percent | Number | Percent | Number | Percent | Number | Percent | Number | Percent | Number | Percent | Number | Percent |
| Total all circuits | 301 | 1,131 | 177 | 58.8 | 657 | 58.1 | 72 | 23.9 | 218 | 19.3 | 9 | 3.0 | 49 | 4.3 | 6 | 2.0 | 20 | 1.8 | 37 | 12.3 | 187 | 16.5 |
| 1. Boston, Mass. | 13 | 66 | 9 | 69.2 | 40 | 60.6 | 1 | 7.7 | 8 | 12.1 | 0 | 5 | 7.6 | 1 | 7.7 | 2 | 3.0 | 2 | 15.4 | 11 | 16.7 | |
| 2. New York, N.Y. | 27 | 115 | 18 | 66.7 | 73 | 63.5 | 5 | 18.5 | 20 | 17.4 | 1 | 3.7 | 6 | 5.2 | 1 | 3.7 | 4 | 3.5 | 2 | 7.4 | 12 | 10.4 |
| 3. Philadelphia, Pa. | 19 | 70 | 13 | 68.4 | 53 | 75.7 | 2 | 10.5 | 3 | 4.3 | 1 | 5.3 | 5 | 7.1 | 0 | 0 | 3 | 15.8 | 9 | 12.9 | ||
| 4. Richmond, Va. | 41 | 90 | 25 | 61.0 | 52 | 57.8 | 13 | 31.7 | 18 | 20.0 | 0 | 2 | 2.2 | 0 | 0 | 3 | 7.3 | 18 | 20.0 | |||
| 5. New Orleans, La. | 50 | 188 | 24 | 48.0 | 108 | 57.4 | 16 | 32.0 | 57 | 30.3 | 3 | 6.0 | 6 | 3.3 | 1 | 2.0 | 1 | 0.5 | 6 | 12.0 | 16 | 8.5 |
| 6. Cincinnati, Ohio | 55 | 141 | 26 | 47.3 | 78 | 55.3 | 16 | 29.1 | 29 | 20.6 | 2 | 3.6 | 2 | 1.4 | 0 | 3 | 2.1 | 11 | 20.0 | 29 | 20.6 | |
| 7. Chicago, Ill. | 22 | 121 | 16 | 72.7 | 56 | 46.3 | 2 | 9.1 | 26 | 21.5 | 0 | 0 | 0 | 1 | 0.8 | 4 | 18.2 | 38 | 31.4 | |||
| 8. St. Louis, Mo. | 15 | 68 | 5 | 33.3 | 23 | 33.8 | 6 | 40.0 | 24 | 35.3 | 0 | 1 | 1.5 | 0 | 2 | 2.9 | 4 | 26.7 | 18 | 26.5 | ||
| 9. San Francisco, Calif. | 27 | 125 | 22 | 81.5 | 76 | 60.8 | 2 | 7.4 | 16 | 12.8 | 1 | 3.7 | 8 | 6.4 | 0 | 2 | 1.6 | 2 | 7.4 | 23 | 18.4 | |
| 10. Denver, Colo. | 11 | 53 | 4 | 36.4 | 36 | 67.9 | 7 | 63.6 | 4 | 7.5 | 0 | 5 | 9.4 | 0 | 0 | 0 | 8 | 15.2 | ||||
| Washington, D.C. | 21 | 94 | 15 | 71.4 | 62 | 66.0 | 2 | 9.5 | 13 | 13.8 | 1 | 4.8 | 9 | 9.6 | 3 | 14.3 | 5 | 5.3 | 0 | 5 | 5.3 | |
- 1 Percentages are computed horizontally by current fiscal year and total fiscal years
126 of 126 figures sit in a row or column sum that works out.
Reader’s notes
p. 254. 23 columns: stub, two total columns, then five outcome groups (Affirmed in full; Modified; Remanded in full; Affirmed in part and remanded in part; Set aside), each with a fiscal-year-1968 Number/Percent pair and a cumulative-1963-67 Number/Percent pair. Decimal points: the scan is a worn 1-bit image in which the period of each percentage is mostly lost, so values print as e.g. "58 8". Every percent column in this table carries one decimal place (one surviving example, San Francisco / Affirmed in full / Cumulative, prints clearly as "60.8"), and each value equals Number/Total to one decimal, so I have transcribed them with the decimal point restored, e.g. "58.8". Likewise "1, 131" is written "1,131". Verification: every circuit row's five FY1968 Numbers sum to its Total fiscal year 1968, every row's five cumulative Numbers sum to its Total fiscal years 1963-67, and all eleven circuits sum to the "Total all circuits" line in all 22 numeric columns. That confirms the column placement of every figure. Doubtful cells (second decimal digit only): - "5. New Orleans, La." / Remanded in full / Cumulative fiscal years 1963-67 / Percent: I read "3.3", but 6 of 188 is 3.2. Either a misprint or a worn 2; transcribed as read. - "10. Denver, Colo." / Set aside / Cumulative fiscal years 1963-67 / Percent: I read "15.2", but 8 of 53 is 15.1. Same situation; transcribed as read. Percent cells are empty wherever the matching Number is 0; most are printed as a dash rule ("------") and a few are simply blank, and all are given as "". The one such cell I am least sure of is "1. Boston, Mass." / Remanded in full / Fiscal year 1968 / Percent, where the dash rule sits low in the row, close to the New York line; the arithmetic (Boston 0, New York 1 of 27 = 3.7) fixes the reading used here. The last row is printed without a sequence number (just "Washington, D.C."), unlike circuits 1-10. There is a stray ink dot under the "Set aside / Cumulative" Number column on the Washington line; it is not a digit or a footnote marker and is ignored. Nothing is cut off by the crop.
Source image
Source data: U.S. NLRB Annual Reports (public domain). Reconstruction by NLRB Stats Archive. Read by claude-opus-5 (effort max, prompt extract_v1) from the 300-dpi scan; stitched by page. Updated October 2026.