NLRB Stats Archive › Annual Reports › FY1968 › Distribution of Unfair Labor Practice Situations Received, by Number of Employees in Establishment, Fiscal Year 1968
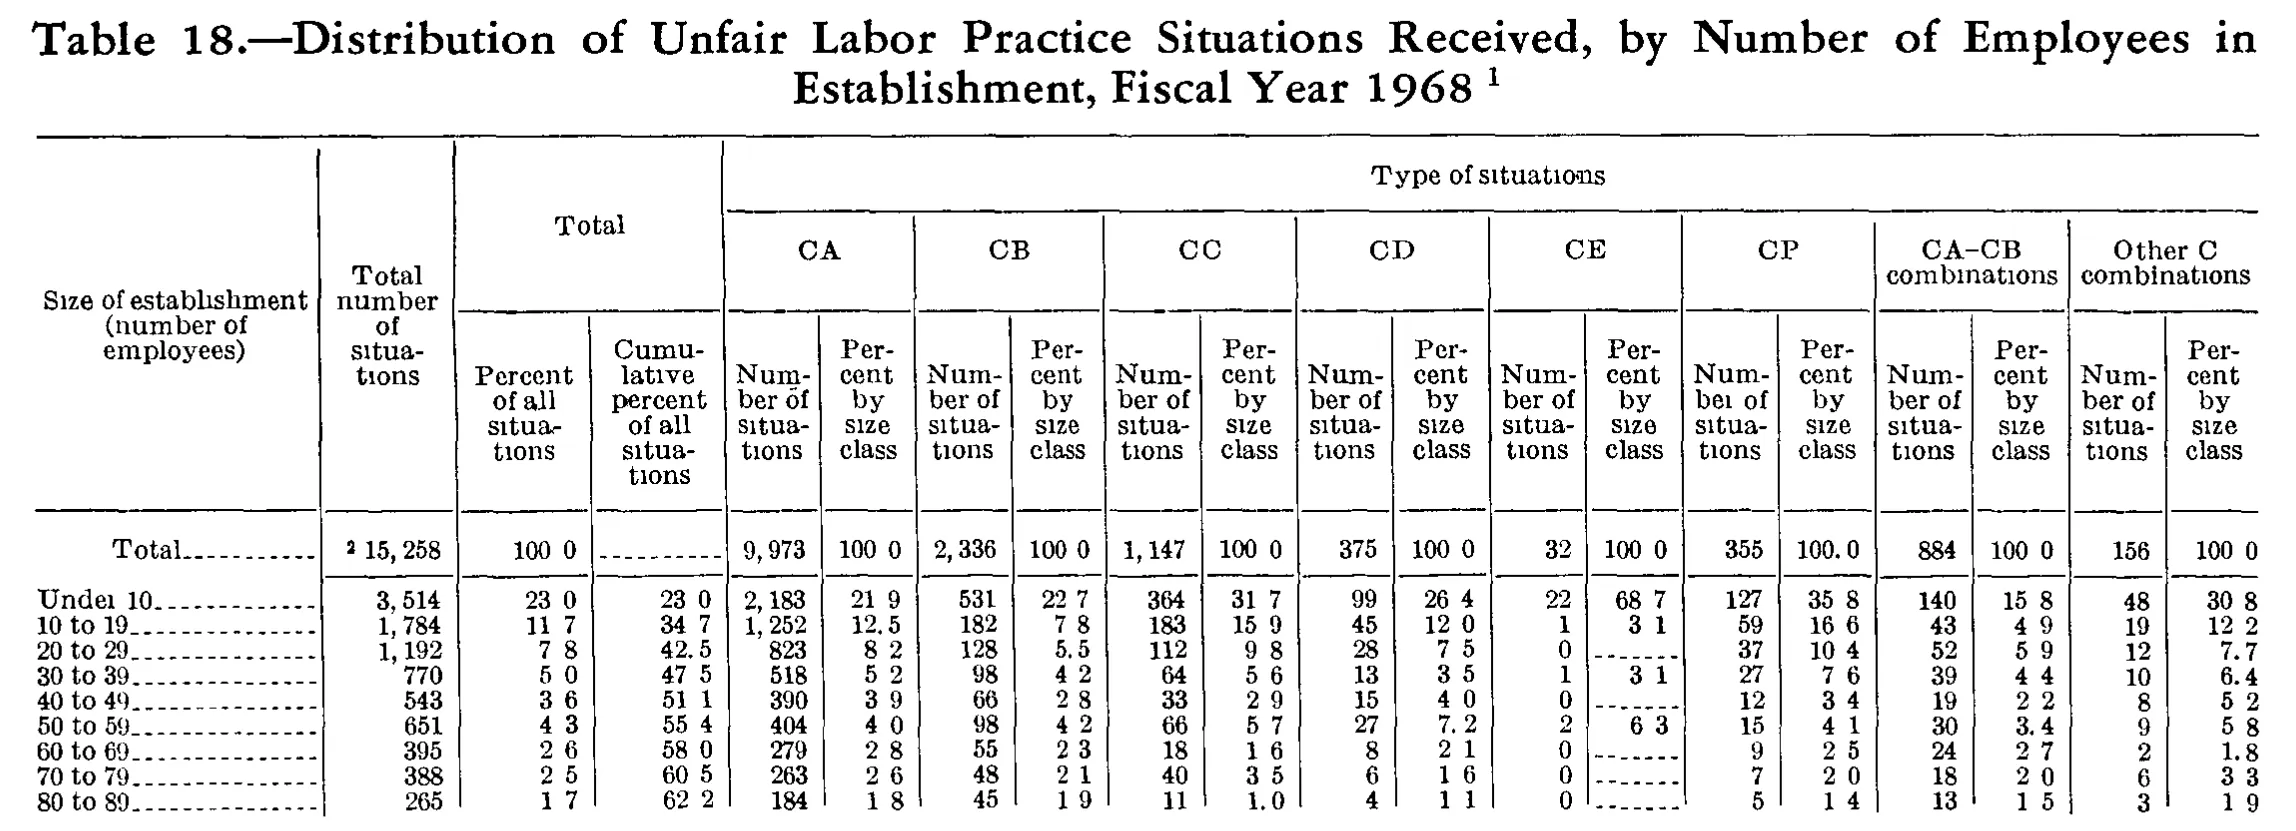
Distribution of Unfair Labor Practice Situations Received, by Number of Employees in Establishment, Fiscal Year 1968
Stitched from pp. 251–252.
| Size of establishment (number of employees) | Total number of situations | Total | Type of situations | ||||||||||||||||
|---|---|---|---|---|---|---|---|---|---|---|---|---|---|---|---|---|---|---|---|
| Size of establishment (number of employees) | Total number of situations | Total | CA | CB | CC | CD | CE | CP | CA-CB combinations | Other C combinations | |||||||||
| Size of establishment (number of employees) | Total number of situations | Percent of all situations | Cumulative percent of all situations | Number of situations | Percent by size class | Number of situations | Percent by size class | Number of situations | Percent by size class | Number of situations | Percent by size class | Number of situations | Percent by size class | Number of situations | Percent by size class | Number of situations | Percent by size class | Number of situations | Percent by size class |
| Total | 15,258 | 100.0 | 9,973 | 100.0 | 2,336 | 100.0 | 1,147 | 100.0 | 375 | 100.0 | 32 | 100.0 | 355 | 100.0 | 884 | 100.0 | 156 | 100.0 | |
| Under 10 | 3,514 | 23.0 | 23.0 | 2,183 | 21.9 | 531 | 22.7 | 364 | 31.7 | 99 | 26.4 | 22 | 68.7 | 127 | 35.8 | 140 | 15.8 | 48 | 30.8 |
| 10 to 19 | 1,784 | 11.7 | 34.7 | 1,252 | 12.5 | 182 | 7.8 | 183 | 15.9 | 45 | 12.0 | 1 | 3.1 | 59 | 16.6 | 43 | 4.9 | 19 | 12.2 |
| 20 to 29 | 1,192 | 7.8 | 42.5 | 823 | 8.2 | 128 | 5.5 | 112 | 9.8 | 28 | 7.5 | 0 | 37 | 10.4 | 52 | 5.9 | 12 | 7.7 | |
| 30 to 39 | 770 | 5.0 | 47.5 | 518 | 5.2 | 98 | 4.2 | 64 | 5.6 | 13 | 3.5 | 1 | 3.1 | 27 | 7.6 | 39 | 4.4 | 10 | 6.4 |
| 40 to 49 | 543 | 3.6 | 51.1 | 390 | 3.9 | 66 | 2.8 | 33 | 2.9 | 15 | 4.0 | 0 | 12 | 3.4 | 19 | 2.2 | 8 | 5.2 | |
| 50 to 59 | 651 | 4.3 | 55.4 | 404 | 4.0 | 98 | 4.2 | 66 | 5.7 | 27 | 7.2 | 2 | 6.3 | 15 | 4.1 | 30 | 3.4 | 9 | 5.8 |
| 60 to 69 | 395 | 2.6 | 58.0 | 279 | 2.8 | 55 | 2.3 | 18 | 1.6 | 8 | 2.1 | 0 | 9 | 2.5 | 24 | 2.7 | 2 | 1.8 | |
| 70 to 79 | 388 | 2.5 | 60.5 | 263 | 2.6 | 48 | 2.1 | 40 | 3.5 | 6 | 1.6 | 0 | 7 | 2.0 | 18 | 2.0 | 6 | 3.3 | |
| 80 to 89 | 265 | 1.7 | 62.2 | 184 | 1.8 | 45 | 1.9 | 11 | 1.0 | 4 | 1.1 | 0 | 5 | 1.4 | 13 | 1.5 | 3 | 1.9 | |
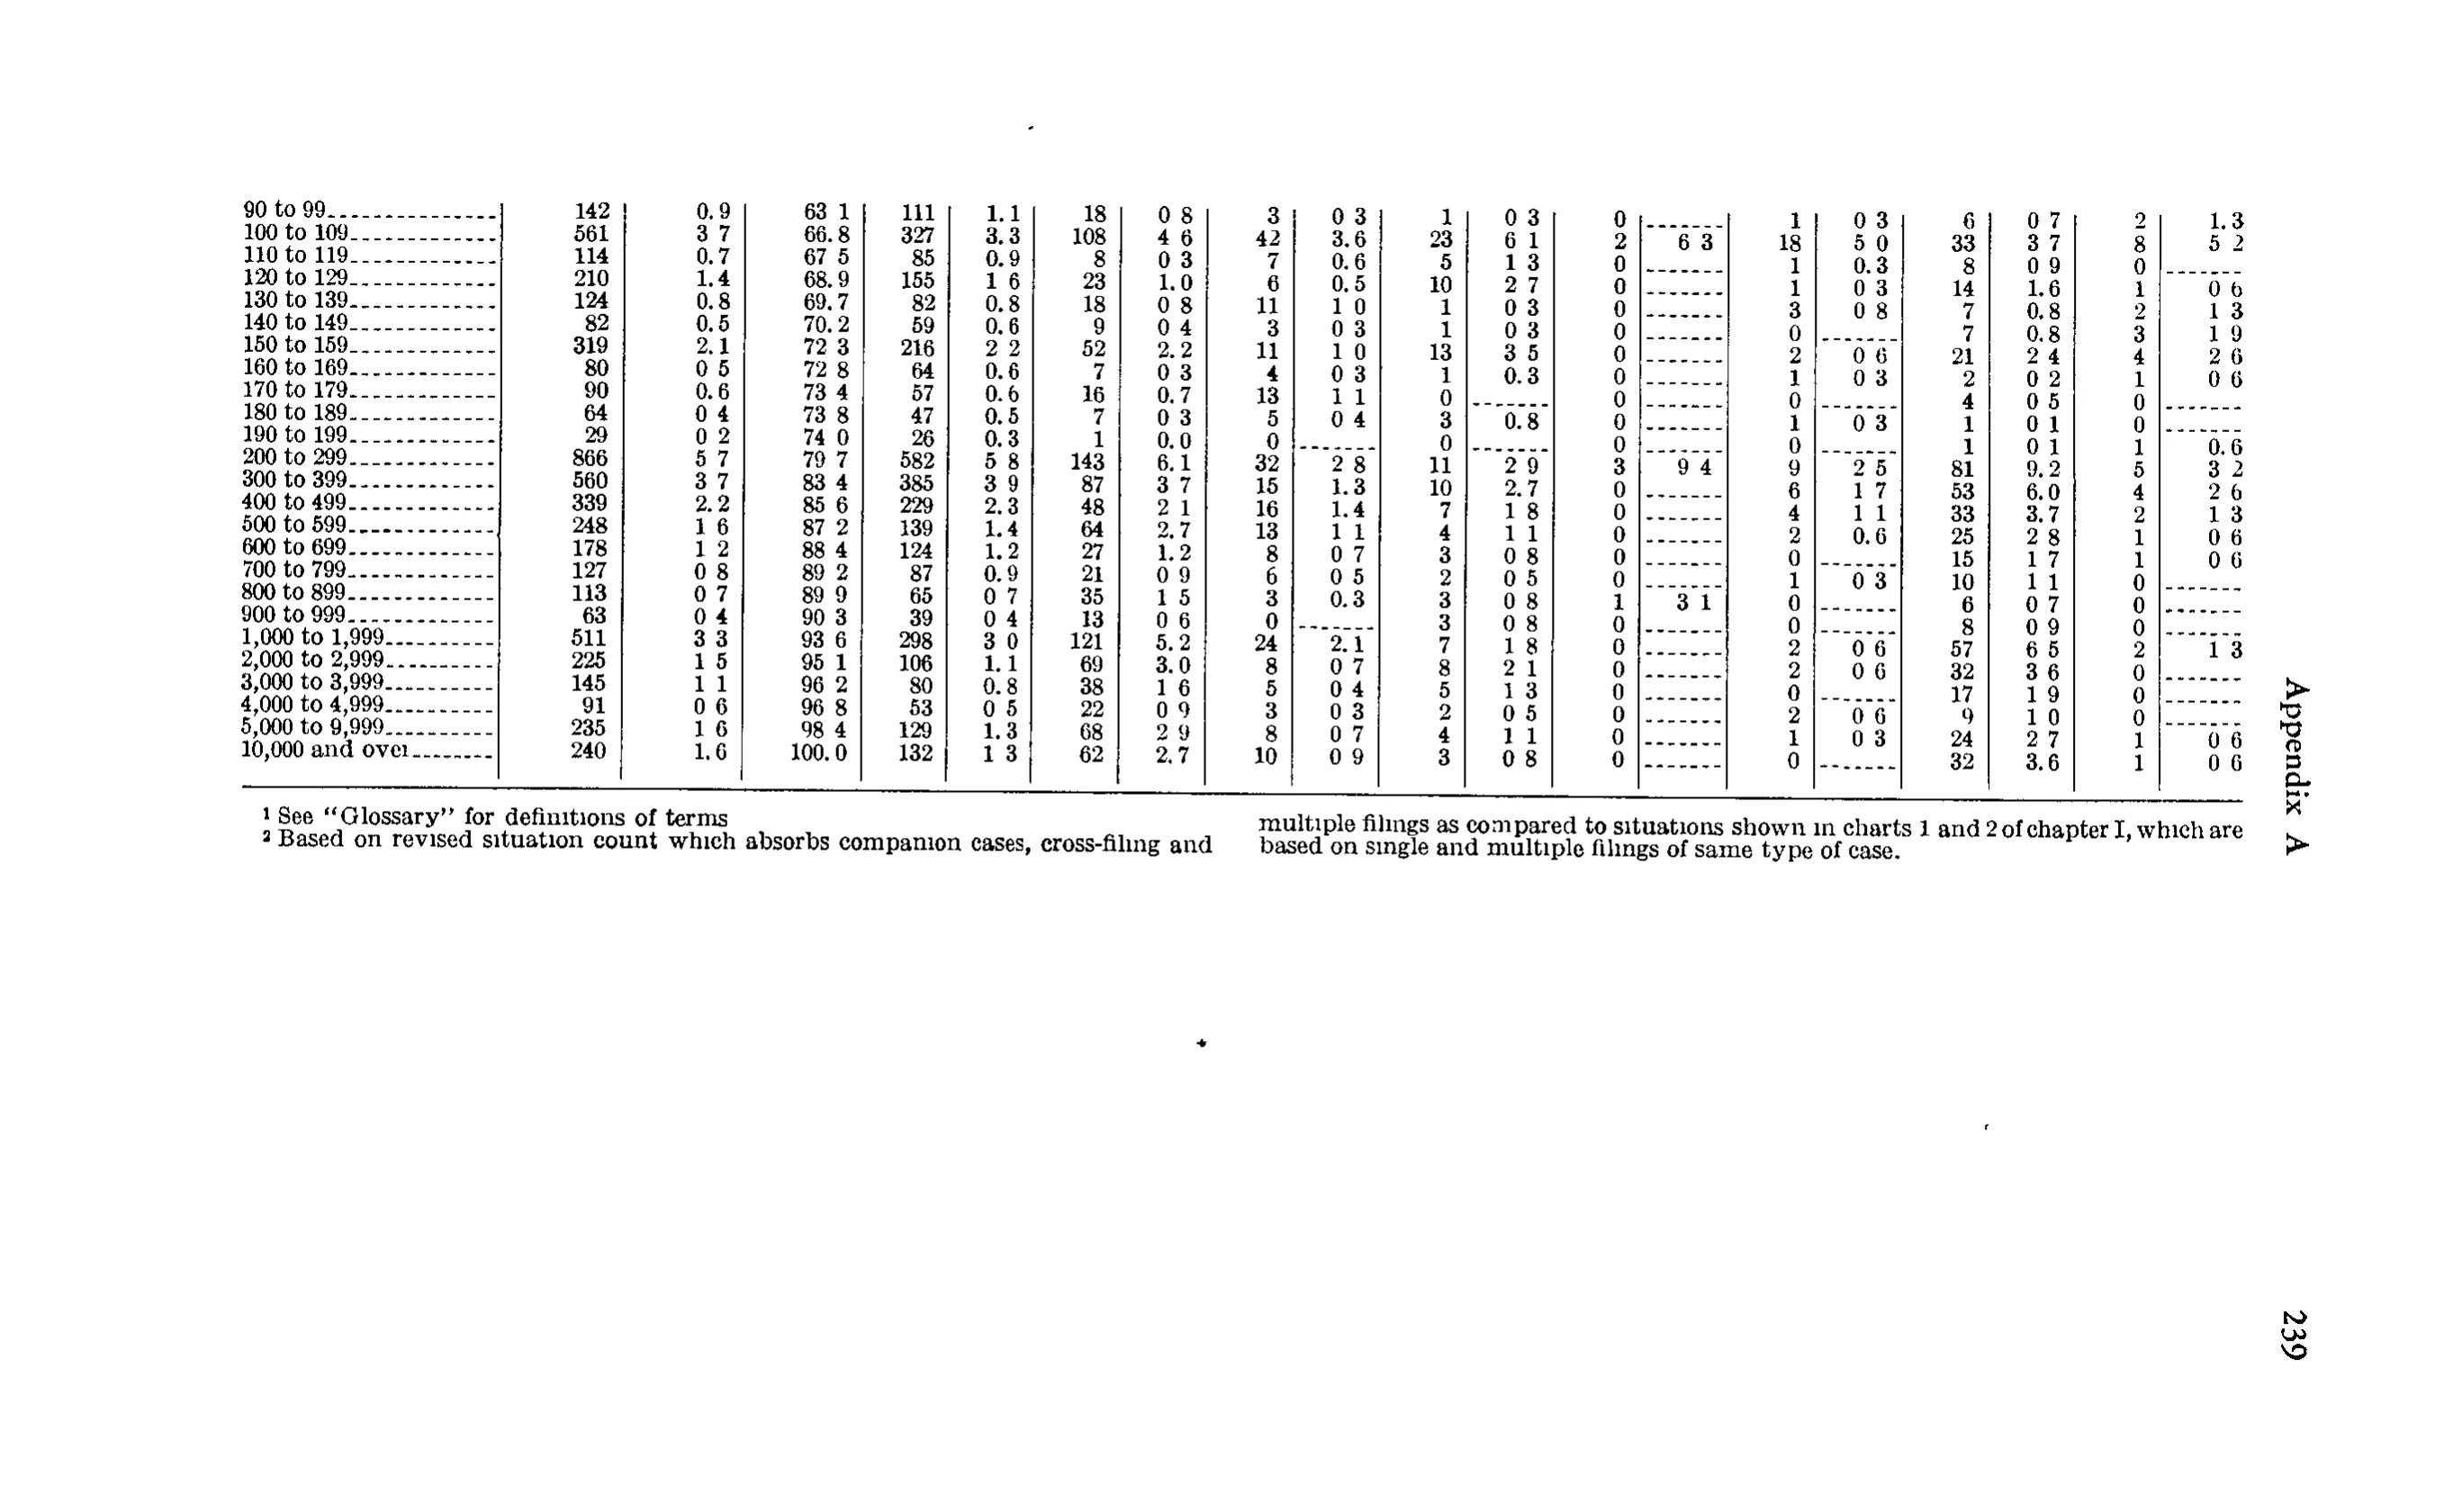
| 90 to 99 | 142 | 0.9 | 63.1 | 111 | 1.1 | 18 | 0.8 | 3 | 0.3 | 1 | 0.3 | 0 | 1 | 0.3 | 6 | 0.7 | 2 | 1.3 | |
| 100 to 109 | 561 | 3.7 | 66.8 | 327 | 3.3 | 108 | 4.6 | 42 | 3.6 | 23 | 6.1 | 2 | 6.3 | 18 | 5.0 | 33 | 3.7 | 8 | 5.2 |
| 110 to 119 | 114 | 0.7 | 67.5 | 85 | 0.9 | 8 | 0.3 | 7 | 0.6 | 5 | 1.3 | 0 | 1 | 0.3 | 8 | 0.9 | 0 | ||
| 120 to 129 | 210 | 1.4 | 68.9 | 155 | 1.6 | 23 | 1.0 | 6 | 0.5 | 10 | 2.7 | 0 | 1 | 0.3 | 14 | 1.6 | 1 | 0.6 | |
| 130 to 139 | 124 | 0.8 | 69.7 | 82 | 0.8 | 18 | 0.8 | 11 | 1.0 | 1 | 0.3 | 0 | 3 | 0.8 | 7 | 0.8 | 2 | 1.3 | |
| 140 to 149 | 82 | 0.5 | 70.2 | 59 | 0.6 | 9 | 0.4 | 3 | 0.3 | 1 | 0.3 | 0 | 0 | 7 | 0.8 | 3 | 1.9 | ||
| 150 to 159 | 319 | 2.1 | 72.3 | 216 | 2.2 | 52 | 2.2 | 11 | 1.0 | 13 | 3.5 | 0 | 2 | 0.6 | 21 | 2.4 | 4 | 2.6 | |
| 160 to 169 | 80 | 0.5 | 72.8 | 64 | 0.6 | 7 | 0.3 | 4 | 0.3 | 1 | 0.3 | 0 | 1 | 0.3 | 2 | 0.2 | 1 | 0.6 | |
| 170 to 179 | 90 | 0.6 | 73.4 | 57 | 0.6 | 16 | 0.7 | 13 | 1.1 | 0 | 0 | 0 | 4 | 0.5 | 0 | ||||
| 180 to 189 | 64 | 0.4 | 73.8 | 47 | 0.5 | 7 | 0.3 | 5 | 0.4 | 3 | 0.8 | 0 | 1 | 0.3 | 1 | 0.1 | 0 | ||
| 190 to 199 | 29 | 0.2 | 74.0 | 26 | 0.3 | 1 | 0.0 | 0 | 0 | 0 | 0 | 1 | 0.1 | 1 | 0.6 | ||||
| 200 to 299 | 866 | 5.7 | 79.7 | 582 | 5.8 | 143 | 6.1 | 32 | 2.8 | 11 | 2.9 | 3 | 9.4 | 9 | 2.5 | 81 | 9.2 | 5 | 3.2 |
| 300 to 399 | 560 | 3.7 | 83.4 | 385 | 3.9 | 87 | 3.7 | 15 | 1.3 | 10 | 2.7 | 0 | 6 | 1.7 | 53 | 6.0 | 4 | 2.6 | |
| 400 to 499 | 339 | 2.2 | 85.6 | 229 | 2.3 | 48 | 2.1 | 16 | 1.4 | 7 | 1.8 | 0 | 4 | 1.1 | 33 | 3.7 | 2 | 1.3 | |
| 500 to 599 | 248 | 1.6 | 87.2 | 139 | 1.4 | 64 | 2.7 | 13 | 1.1 | 4 | 1.1 | 0 | 2 | 0.6 | 25 | 2.8 | 1 | 0.6 | |
| 600 to 699 | 178 | 1.2 | 88.4 | 124 | 1.2 | 27 | 1.2 | 8 | 0.7 | 3 | 0.8 | 0 | 0 | 15 | 1.7 | 1 | 0.6 | ||
| 700 to 799 | 127 | 0.8 | 89.2 | 87 | 0.9 | 21 | 0.9 | 6 | 0.5 | 2 | 0.5 | 0 | 1 | 0.3 | 10 | 1.1 | 0 | ||
| 800 to 899 | 113 | 0.7 | 89.9 | 65 | 0.7 | 35 | 1.5 | 3 | 0.3 | 3 | 0.8 | 1 | 3.1 | 0 | 6 | 0.7 | 0 | ||
| 900 to 999 | 63 | 0.4 | 90.3 | 39 | 0.4 | 13 | 0.6 | 0 | 3 | 0.8 | 0 | 0 | 8 | 0.9 | 0 | ||||
| 1,000 to 1,999 | 511 | 3.3 | 93.6 | 298 | 3.0 | 121 | 5.2 | 24 | 2.1 | 7 | 1.8 | 0 | 2 | 0.6 | 57 | 6.5 | 2 | 1.3 | |
| 2,000 to 2,999 | 225 | 1.5 | 95.1 | 106 | 1.1 | 69 | 3.0 | 8 | 0.7 | 8 | 2.1 | 0 | 2 | 0.6 | 32 | 3.6 | 0 | ||
| 3,000 to 3,999 | 145 | 1.1 | 96.2 | 80 | 0.8 | 38 | 1.6 | 5 | 0.4 | 5 | 1.3 | 0 | 0 | 17 | 1.9 | 0 | |||
| 4,000 to 4,999 | 91 | 0.6 | 96.8 | 53 | 0.5 | 22 | 0.9 | 3 | 0.3 | 2 | 0.5 | 0 | 2 | 0.6 | 9 | 1.0 | 0 | ||
| 5,000 to 9,999 | 235 | 1.6 | 98.4 | 129 | 1.3 | 68 | 2.9 | 8 | 0.7 | 4 | 1.1 | 0 | 1 | 0.3 | 24 | 2.7 | 1 | 0.6 | |
| 10,000 and over | 240 | 1.6 | 100.0 | 132 | 1.3 | 62 | 2.7 | 10 | 0.9 | 3 | 0.8 | 0 | 0 | 32 | 3.6 | 1 | 0.6 | ||
- 1 See "Glossary" for definitions of terms
- 2 Based on revised situation count which absorbs companion cases, cross-filing and multiple filings as compared to situations shown in charts 1 and 2 of chapter I, which are based on single and multiple filings of same type of case.
267 of 267 figures sit in a row or column sum that works out.
Reader’s notes
p. 251. The crop is cut off at the bottom: the body ends mid-table at "80 to 89" (cumulative percent only 62.2), so further size classes and any closing total/footnote block continue on the rest of the page and are not in this image. Footnote markers appear on the caption ("Fiscal Year 1968 1") and on the Total row's "Total number of situations" cell (raised 2 before 15,258, transcribed as 15,258^2), but no footnote text is visible in the crop, so `footnotes` is empty. Decimal points: this is a degraded 1-bit scan in which the decimal point in the percentage columns frequently fails to render, so most percentages appear as e.g. "100 0", "23 0", "11 7" with a gap where the point belongs, while a handful print clearly ("100.0" for CP Total, "12.5", "5.5", "7.2", "3.4", "1.0"). I have transcribed all of them with the decimal point, since the point is printed but faint rather than absent. This is confirmed arithmetically: the cumulative-percent column is the running sum of the percent-of-all-situations column read as one decimal place (23.0+11.7=34.7, +7.8=42.5, +5.0=47.5, +3.6=51.1, +4.3=55.4, +2.6=58.0, +2.5=60.5, +1.7=62.2). Empty cells: the Total row's "Cumulative percent" cell and the CE "Percent by size class" cells for 20 to 29, 40 to 49, 60 to 69, 70 to 79 and 80 to 89 hold a dash rule only, transcribed as "". The corresponding CE "Number of situations" cells hold a printed 0 and are kept as "0". The first data row's label is scanned as "Undei 10"; the broken letter is plainly an "r" and it is transcribed "Under 10". Likewise "Number of situations" in the CP column heading scans as "Numbei of situations" and "Type of situations"/"Size of establishment" show broken dotless i's; all read as the standard wording. No arithmetic problems found: every size-class row's eight type-of-situation counts sum exactly to its "Total number of situations" (e.g. Under 10 = 3,514; 10 to 19 = 1,784; 50 to 59 = 651), and the Total row's eight type counts sum to 15,258, which supports the column assignment of every number in the grid.
p. 252. Continuation crop: no column headings are printed on this image, so header_rows is empty. The table runs on from the previous page (the smaller size classes, any section headings and the total row are not in this crop); the body here ends at the closing rule above the footnotes. The grid has 20 columns: the stub, then a Number / Percent / Cumulative-percent triplet, then eight Number / Percent pairs. Decimal points: this is a coarse bitonal scan and the decimal point in the percentage columns very often fails to reproduce, so the same column shows both "0.9" and "3 7" or "08" for what is printed as 3.7 and 0.8. I have restored the points rather than writing the gap as a space. Every restored value is corroborated arithmetically: the cumulative-percent column (column 3) advances by exactly the percent column (column 2) in all 25 rows, from 63.1 to 100.0, and each percent reproduces its count divided by the (off-crop) column total to the printed rounding. No digits were altered. Column assignment check: in all 25 rows the eight case-type counts (columns 4, 6, 8, 10, 12, 14, 16, 18) sum exactly to the row total in column 1 — e.g. row "90 to 99", 111+18+3+1+0+1+6+2 = 142; row "200 to 299", 582+143+32+11+3+9+81+5 = 866. No printed total appears to be in error. Dash-rule cells (printed "------" against a 0 count) are given as "". Footnote 2's text is set in two blocks side by side beneath the table; I have joined them into one footnote in reading order (left block "...cross-filing and" continuing into the right block "multiple filings as compared to..."). Footnote 1 is printed without a closing period. Doubtful cells, all minor and all ink-degradation rather than ambiguity of value: the last row label prints as "10,000 and ovei" — the final r is broken — transcribed as "10,000 and over". Footnote markers 1 and 2 are referenced only from the headings, which are not on this crop, so no marker appears on any cell here.
Source image
Source data: U.S. NLRB Annual Reports (public domain). Reconstruction by NLRB Stats Archive. Read by claude-opus-5 (effort max, prompt extract_v1) from the 300-dpi scan; stitched by page. Updated October 2026.