NLRB Stats Archive › Annual Reports › FY1968 › Results of Union-Shop Deauthorization Polls in Cases Closed, Fiscal Year 1968
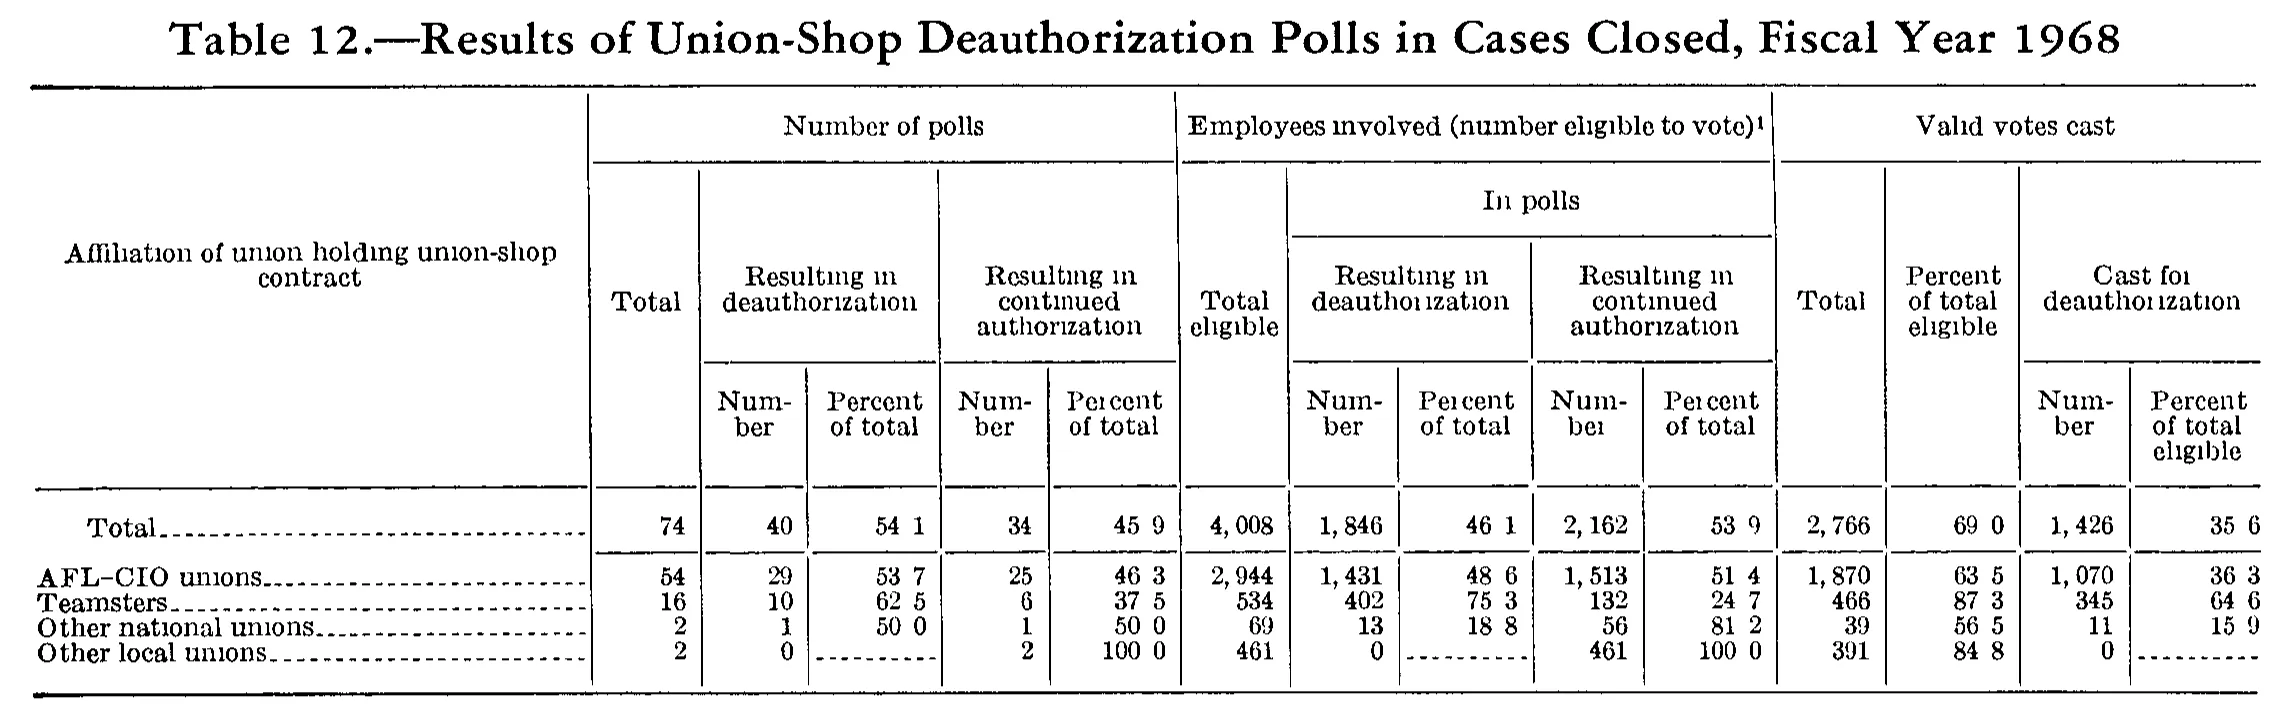
Results of Union-Shop Deauthorization Polls in Cases Closed, Fiscal Year 1968
| Affiliation of union holding union-shop contract | Number of polls | Employees involved (number eligible to vote) | Valid votes cast | |||||||||||
|---|---|---|---|---|---|---|---|---|---|---|---|---|---|---|
| Affiliation of union holding union-shop contract | Total | Resulting in deauthorization | Resulting in continued authorization | Total eligible | In polls | Total | Percent of total eligible | Cast for deauthorization | ||||||
| Affiliation of union holding union-shop contract | Total | Resulting in deauthorization | Resulting in continued authorization | Total eligible | Resulting in deauthorization | Resulting in continued authorization | Total | Percent of total eligible | Cast for deauthorization | |||||
| Affiliation of union holding union-shop contract | Total | Number | Percent of total | Number | Percent of total | Total eligible | Number | Percent of total | Number | Percent of total | Total | Percent of total eligible | Number | Percent of total eligible |
| Total | 74 | 40 | 54.1 | 34 | 45.9 | 4,008 | 1,846 | 46.1 | 2,162 | 53.9 | 2,766 | 69.0 | 1,426 | 35.6 |
| AFL-CIO unions | 54 | 29 | 53.7 | 25 | 46.3 | 2,944 | 1,431 | 48.6 | 1,513 | 51.4 | 1,870 | 63.5 | 1,070 | 36.3 |
| Teamsters | 16 | 10 | 62.5 | 6 | 37.5 | 534 | 402 | 75.3 | 132 | 24.7 | 466 | 87.3 | 345 | 64.6 |
| Other national unions | 2 | 1 | 50.0 | 1 | 50.0 | 69 | 13 | 18.8 | 56 | 81.2 | 39 | 56.5 | 11 | 15.9 |
| Other local unions | 2 | 0 | 2 | 100.0 | 461 | 0 | 461 | 100.0 | 391 | 84.8 | 0 | |||
37 of 37 figures sit in a row or column sum that works out.
Reader’s notes
p. 235. Footnote marker: a raised 1 is printed on the spanner heading "Employees involved (number eligible to vote)", recorded as ^1. The text of footnote 1 is not printed inside this crop (the crop ends at the table's bottom rule), so `footnotes` is empty. Decimal points: in all percent columns the decimal point is printed but reproduces very faintly in this 1-bit scan, so the values read visually as "54 1", "45 9", "100 0" etc. They are transcribed with the decimal point ("54.1", "45.9", "100.0"). This is supported by arithmetic: 54.1+45.9=100.0, 46.1+53.9=100.0, 48.6+51.4=100.0, 75.3+24.7=100.0, 18.8+81.2=100.0, and each percent equals the corresponding Number divided by its Total (e.g. 40/74=54.1, 1,431/2,944=48.6, 2,766/4,008=69.0). Dash rules: in the "Other local unions" row the three percent cells that would correspond to a zero count — Number of polls / Resulting in deauthorization / Percent of total; Employees involved / Resulting in deauthorization / Percent of total; and Valid votes cast / Cast for deauthorization / Percent of total eligible — are printed as a dash rule (------) and are transcribed as "". The adjacent Number cells in those three places are a printed 0 and are kept as "0". Internal consistency: no misprints detected. Column sums of the four affiliation rows reproduce the Total row exactly in every count column (74, 40, 34, 4,008, 1,846, 2,162, 2,766, 1,426). No column headings were reconstructed; all four heading levels are printed on this image. "Total" (Number of polls), "Total eligible", "Total" and "Percent of total eligible" (Valid votes cast) are tall single headings spanning the lower levels, and the stub heading spans all four, so each is repeated down its levels per the convention.
Source image
Source data: U.S. NLRB Annual Reports (public domain). Reconstruction by NLRB Stats Archive. Read by claude-opus-5 (effort max, prompt extract_v1) from the 300-dpi scan; stitched by page. Updated October 2026.