NLRB Stats Archive › Annual Reports › FY1968 › Unfair labor practice merit factor
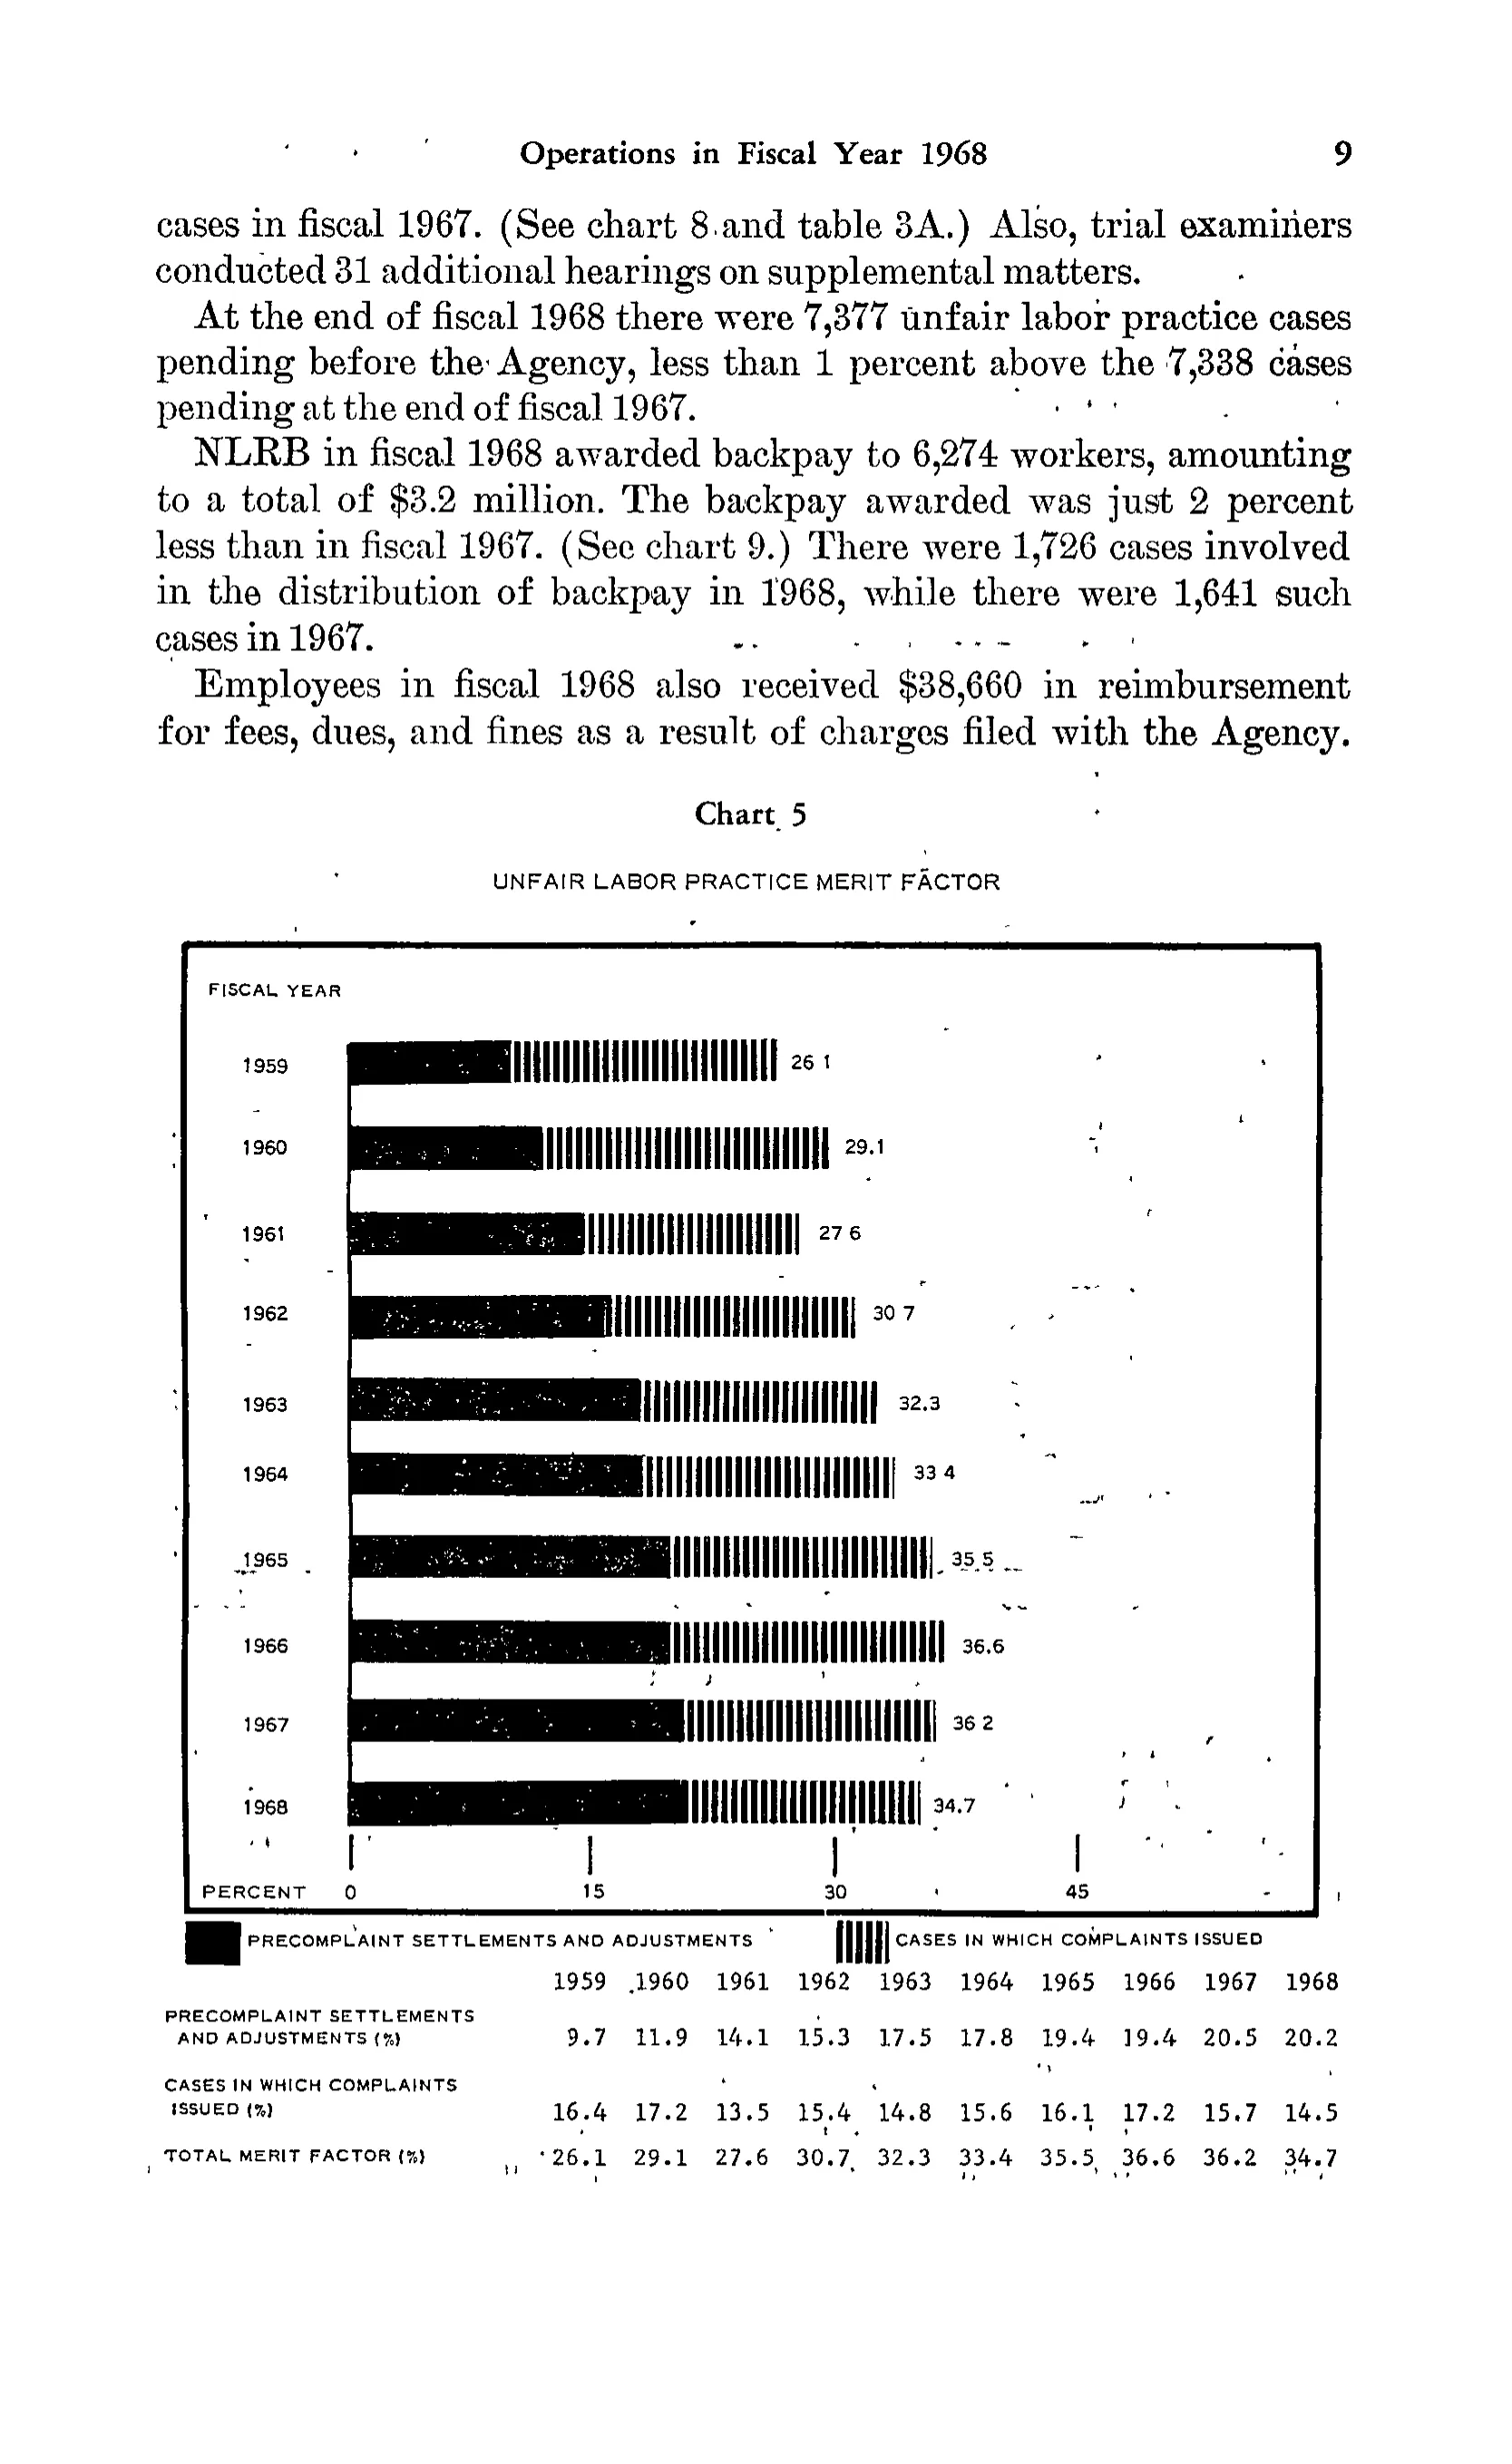
Unfair labor practice merit factor
| 1959 | 1960 | 1961 | 1962 | 1963 | 1964 | 1965 | 1966 | 1967 | 1968 | |
|---|---|---|---|---|---|---|---|---|---|---|
| PRECOMPLAINT SETTLEMENTS AND ADJUSTMENTS (%) | 9.7 | 11.9 | 14.1 | 15.3 | 17.5 | 17.8 | 19.4 | 19.4 | 20.5 | 20.2 |
| CASES IN WHICH COMPLAINTS ISSUED (%) | 16.4 | 17.2 | 13.5 | 15.4 | 14.8 | 15.6 | 16.1 | 17.2 | 15.7 | 14.5 |
| TOTAL MERIT FACTOR (%) | 26.1 | 29.1 | 27.6 | 30.7 | 32.3 | 33.4 | 35.5 | 36.6 | 36.2 | 34.7 |
Reader’s notes
p. 22. The crop is a full report page (p. 9, "Operations in Fiscal Year 1968"), not a standalone statistical table. Most of it is narrative text plus Chart 5, a horizontal bar chart headed "UNFAIR LABOR PRACTICE MERIT FACTOR" with a "FISCAL YEAR" axis (1959-1968) and a percent axis (0, 15, 30, 45). What is transcribed here is the small data table printed below the chart, which is the only grid of figures on the page. Structure: 11 columns, a stub of row labels plus one column per fiscal year 1959-1968. The stub has no printed heading, so cell 0 of the heading row is empty. Both long row labels wrap onto two printed lines ("PRECOMPLAINT SETTLEMENTS / AND ADJUSTMENTS (%)" and "CASES IN WHICH COMPLAINTS / ISSUED (%)") and have been joined; the labels are printed in capitals and the "(%)" is part of the printed label. Not transcribed, because they belong to the chart rather than the table: the legend keys "PRECOMPLAINT SETTLEMENTS AND ADJUSTMENTS" and "CASES IN WHICH COMPLAINTS ISSUED", and the value labels at the end of each bar. Those bar labels repeat the TOTAL MERIT FACTOR row exactly (26.1, 29.1, 27.6, 30.7, 32.3, 33.4, 35.5, 36.6, 36.2, 34.7), although in the scan several of them have lost their decimal point and read as "26 1", "27 6", "30 7", "33 4" and "36 2"; the table row below the chart prints the decimal points clearly, and those are the values given here. Arithmetic is internally consistent in every column: the two component rows sum to the printed total merit factor for all ten years, which supports the column assignment. Scattered specks and stray marks from the scan appear between the digit rows but no cell is doubtful.
Source image
Source data: U.S. NLRB Annual Reports (public domain). Reconstruction by NLRB Stats Archive. Read by claude-opus-5 (effort max, prompt extract_v1) from the 300-dpi scan; stitched by page. Updated October 2026.