NLRB Stats Archive › Annual Reports › FY1967 › Distribution of Unfair Labor Practice Situations Received, by Number of Employees in Establishment, Fiscal Year 1967
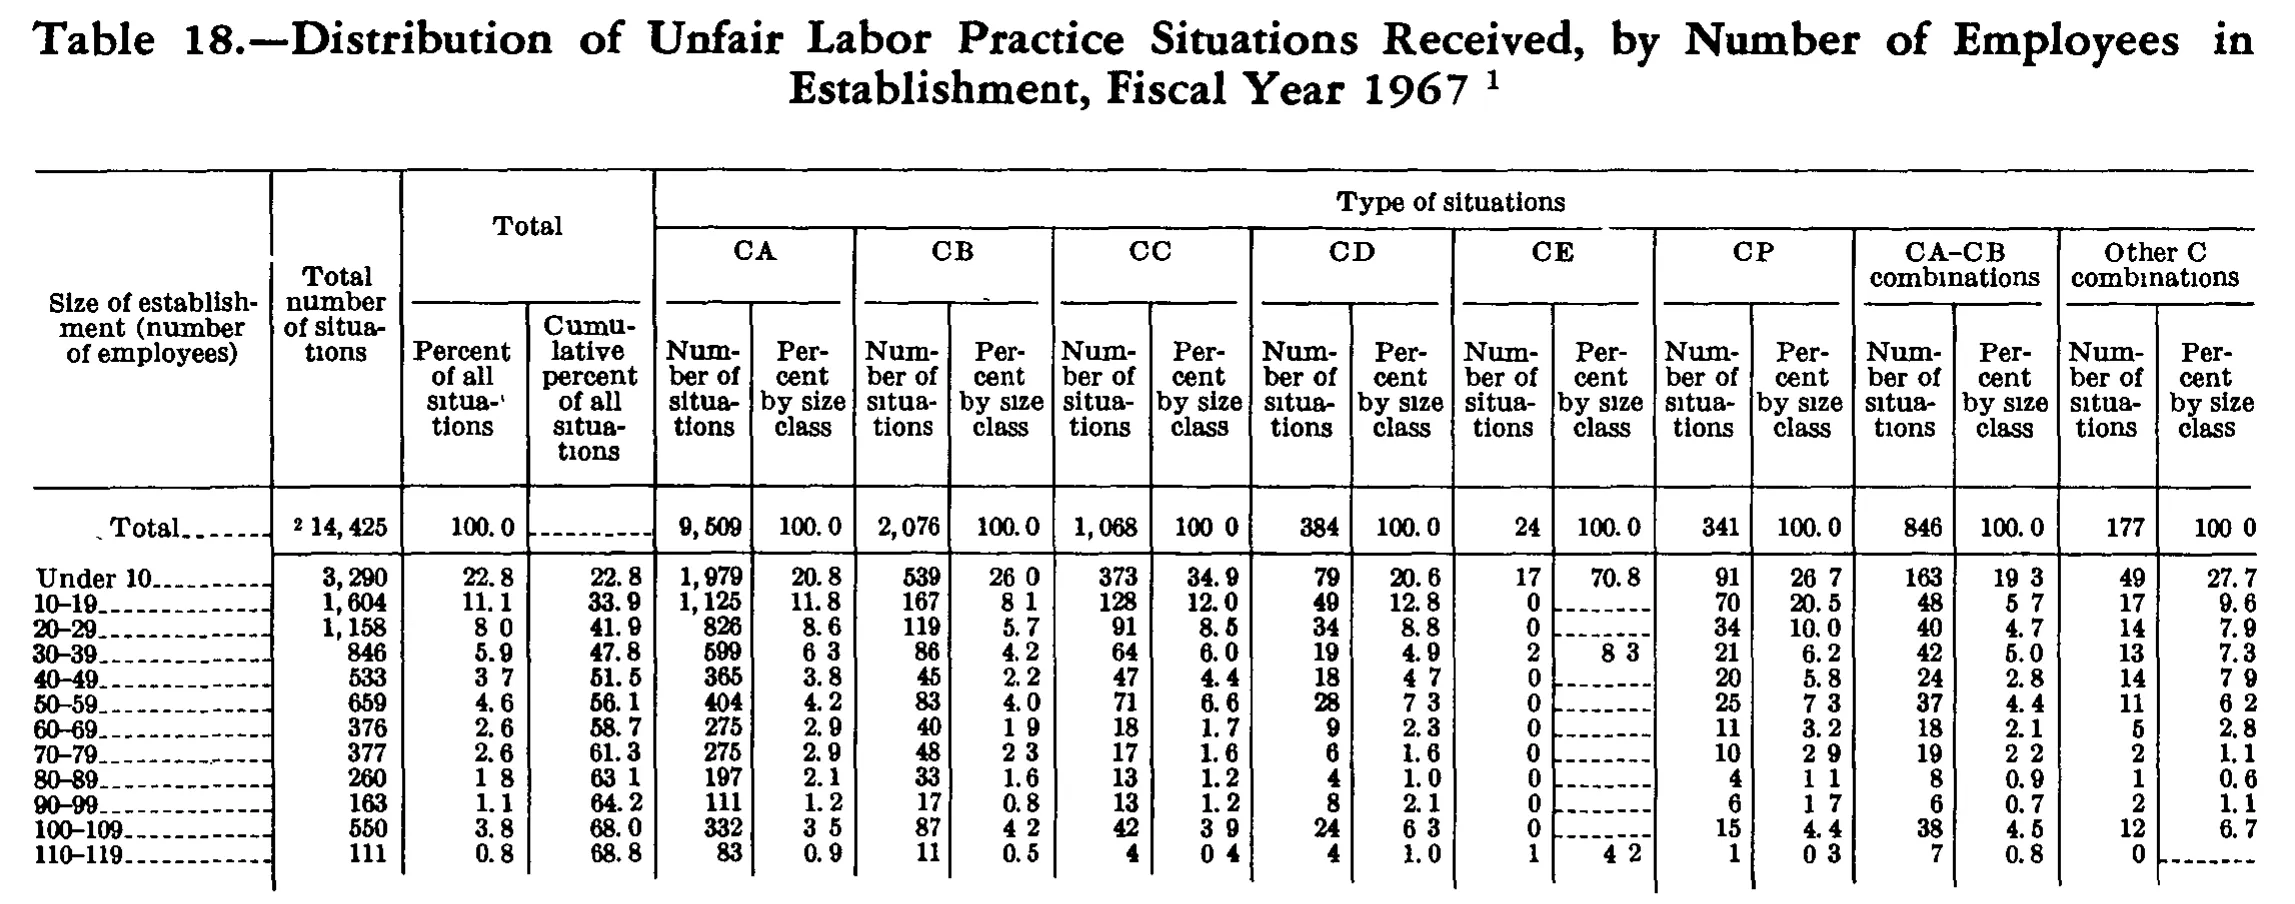
Distribution of Unfair Labor Practice Situations Received, by Number of Employees in Establishment, Fiscal Year 1967
Stitched from pp. 265–266.
| Size of establishment (number of employees) | Total number of situations | Total | Type of situations | ||||||||||||||||
|---|---|---|---|---|---|---|---|---|---|---|---|---|---|---|---|---|---|---|---|
| Size of establishment (number of employees) | Total number of situations | Total | CA | CB | CC | CD | CE | CP | CA-CB combinations | Other C combinations | |||||||||
| Size of establishment (number of employees) | Total number of situations | Percent of all situations | Cumulative percent of all situations | Number of situations | Percent by size class | Number of situations | Percent by size class | Number of situations | Percent by size class | Number of situations | Percent by size class | Number of situations | Percent by size class | Number of situations | Percent by size class | Number of situations | Percent by size class | Number of situations | Percent by size class |
| Total | 14,425 | 100.0 | 9,509 | 100.0 | 2,076 | 100.0 | 1,068 | 100.0 | 384 | 100.0 | 24 | 100.0 | 341 | 100.0 | 846 | 100.0 | 177 | 100.0 | |
| Under 10 | 3,290 | 22.8 | 22.8 | 1,979 | 20.8 | 539 | 26.0 | 373 | 34.9 | 79 | 20.6 | 17 | 70.8 | 91 | 26.7 | 163 | 19.3 | 49 | 27.7 |
| 10-19 | 1,604 | 11.1 | 33.9 | 1,125 | 11.8 | 167 | 8.1 | 128 | 12.0 | 49 | 12.8 | 0 | 70 | 20.5 | 48 | 5.7 | 17 | 9.6 | |
| 20-29 | 1,158 | 8.0 | 41.9 | 826 | 8.6 | 119 | 5.7 | 91 | 8.5 | 34 | 8.8 | 0 | 34 | 10.0 | 40 | 4.7 | 14 | 7.9 | |
| 30-39 | 846 | 5.9 | 47.8 | 599 | 6.3 | 86 | 4.2 | 64 | 6.0 | 19 | 4.9 | 2 | 8.3 | 21 | 6.2 | 42 | 5.0 | 13 | 7.3 |
| 40-49 | 533 | 3.7 | 51.5 | 365 | 3.8 | 45 | 2.2 | 47 | 4.4 | 18 | 4.7 | 0 | 20 | 5.8 | 24 | 2.8 | 14 | 7.9 | |
| 50-59 | 659 | 4.6 | 56.1 | 404 | 4.2 | 83 | 4.0 | 71 | 6.6 | 28 | 7.3 | 0 | 25 | 7.3 | 37 | 4.4 | 11 | 6.2 | |
| 60-69 | 376 | 2.6 | 58.7 | 275 | 2.9 | 40 | 1.9 | 18 | 1.7 | 9 | 2.3 | 0 | 11 | 3.2 | 18 | 2.1 | 5 | 2.8 | |
| 70-79 | 377 | 2.6 | 61.3 | 275 | 2.9 | 48 | 2.3 | 17 | 1.6 | 6 | 1.6 | 0 | 10 | 2.9 | 19 | 2.2 | 2 | 1.1 | |
| 80-89 | 260 | 1.8 | 63.1 | 197 | 2.1 | 33 | 1.6 | 13 | 1.2 | 4 | 1.0 | 0 | 4 | 1.1 | 8 | 0.9 | 1 | 0.6 | |
| 90-99 | 163 | 1.1 | 64.2 | 111 | 1.2 | 17 | 0.8 | 13 | 1.2 | 8 | 2.1 | 0 | 6 | 1.7 | 6 | 0.7 | 2 | 1.1 | |
| 100-109 | 550 | 3.8 | 68.0 | 332 | 3.5 | 87 | 4.2 | 42 | 3.9 | 24 | 6.3 | 0 | 15 | 4.4 | 38 | 4.5 | 12 | 6.7 | |
| 110-119 | 111 | 0.8 | 68.8 | 83 | 0.9 | 11 | 0.5 | 4 | 0.4 | 4 | 1.0 | 1 | 4.2 | 1 | 0.3 | 7 | 0.8 | 0 | |
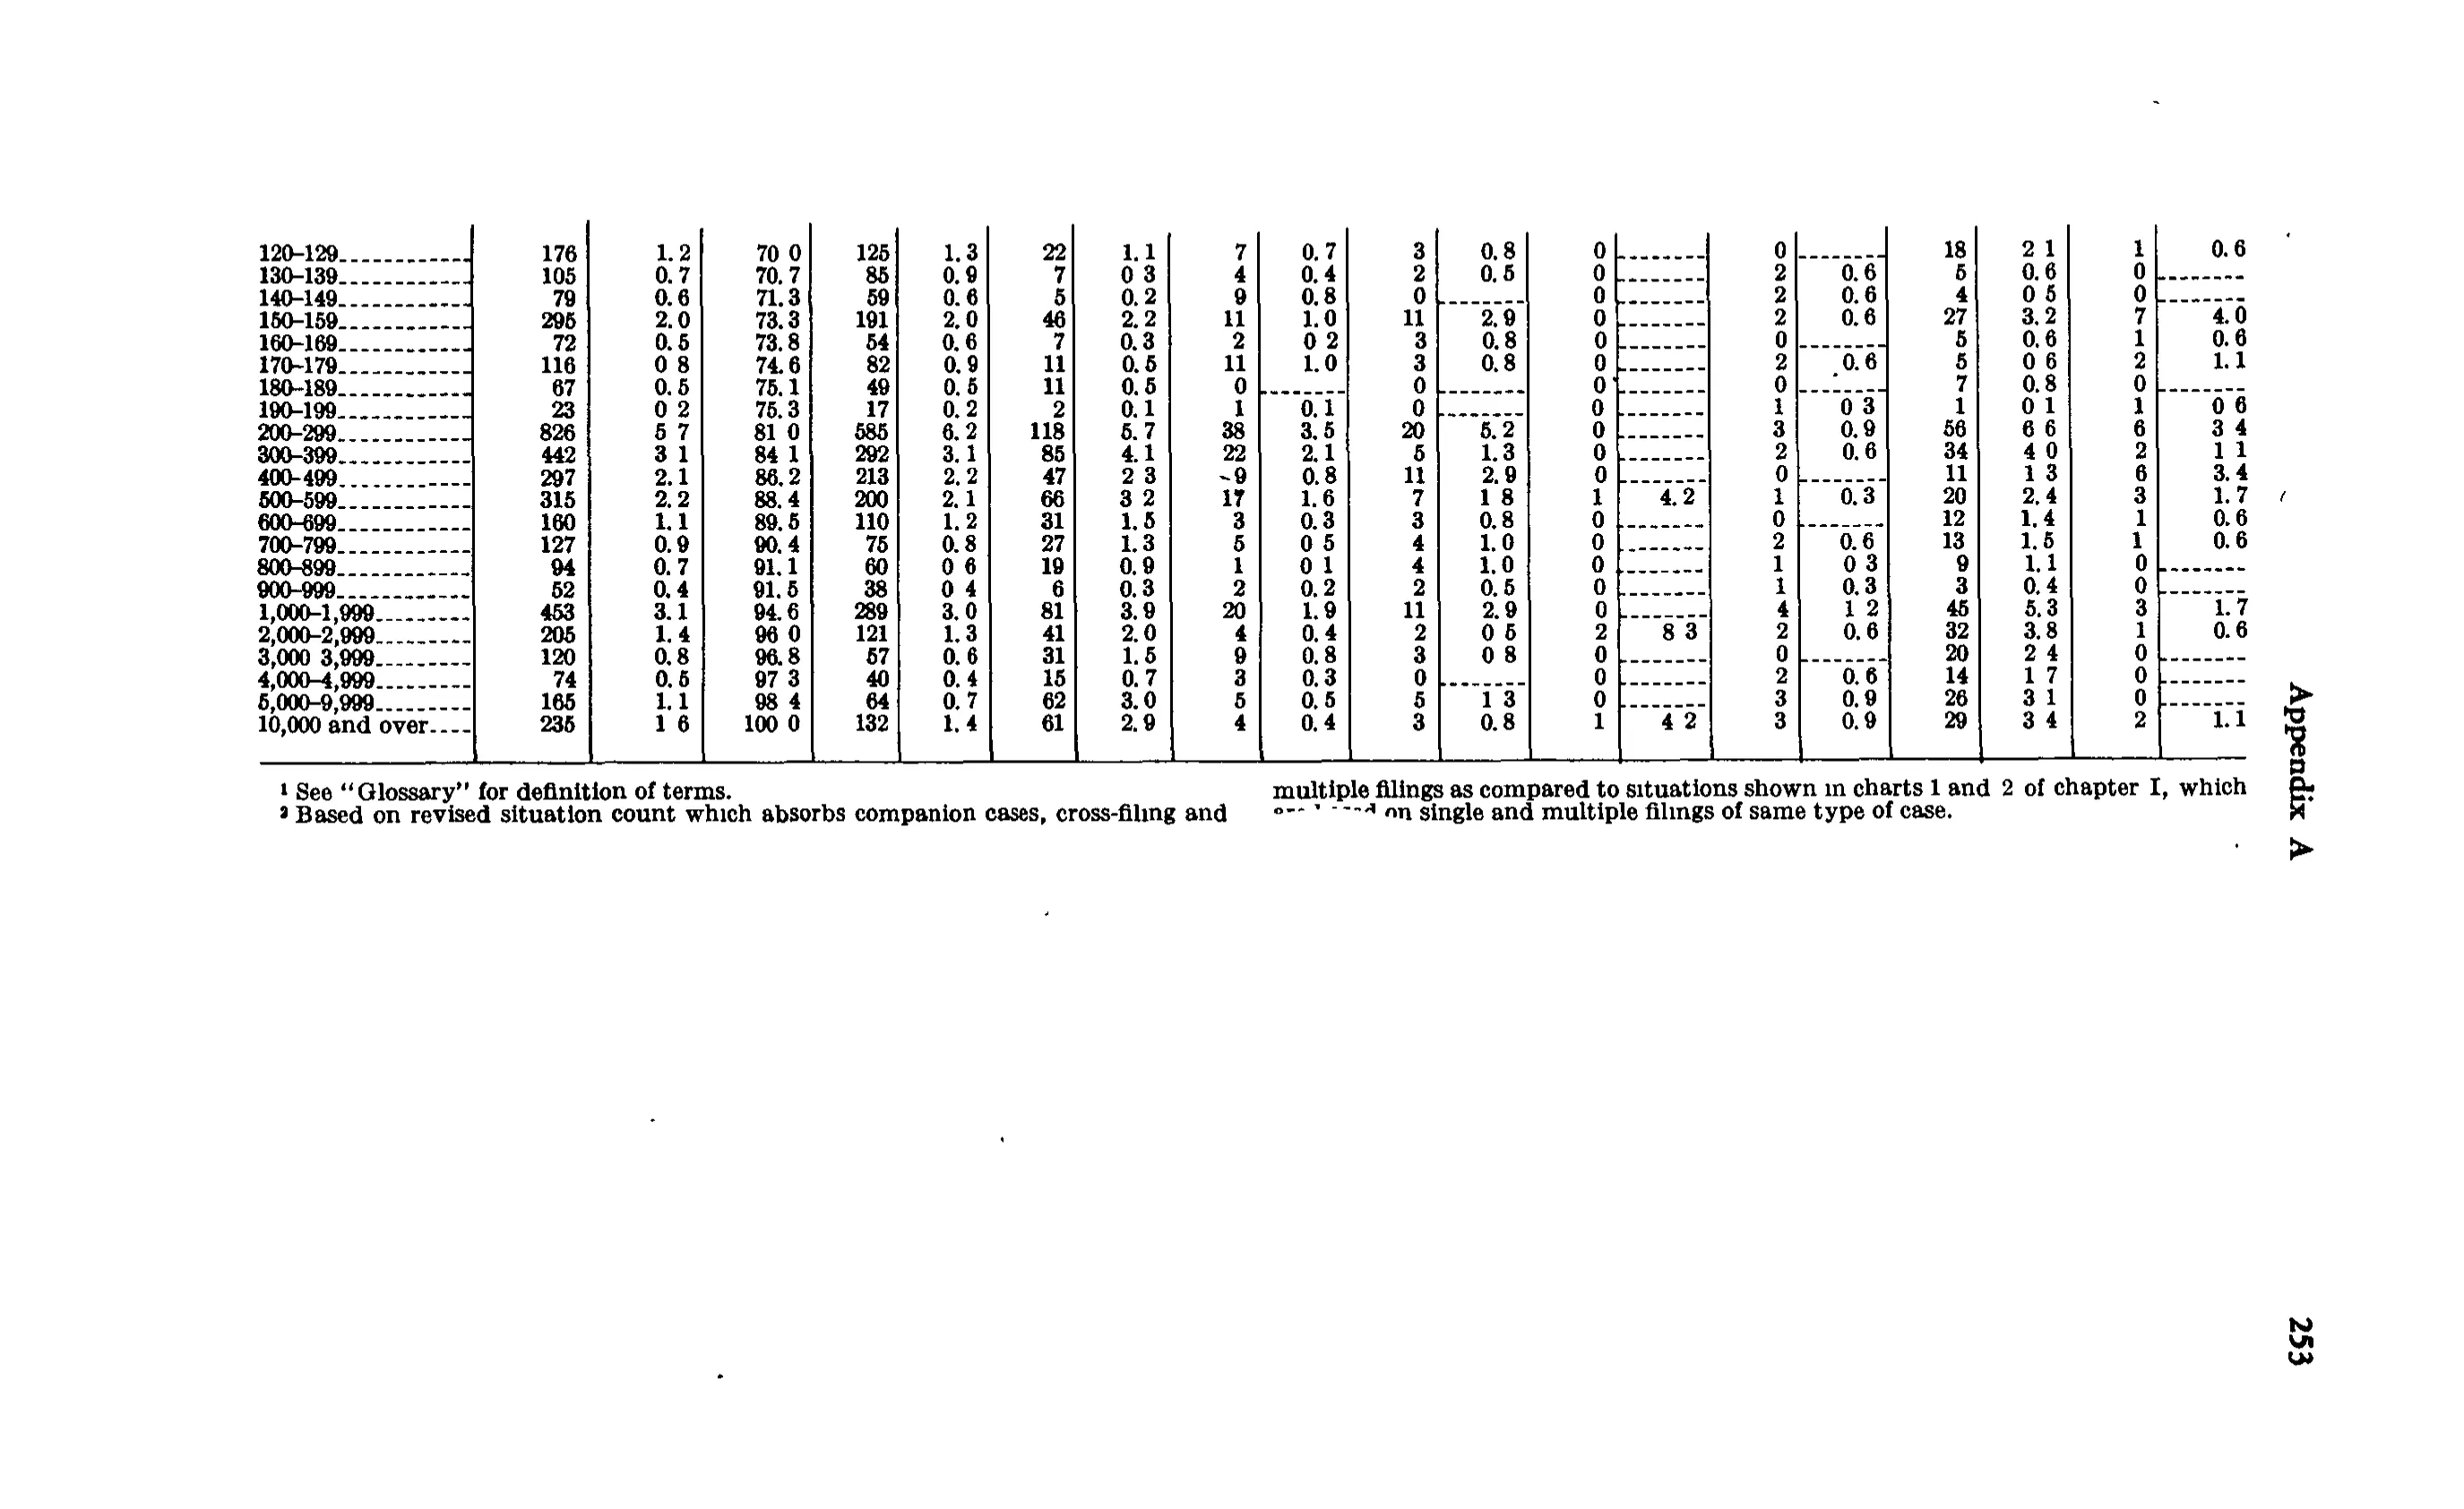
| 120-129 | 176 | 1.2 | 70.0 | 125 | 1.3 | 22 | 1.1 | 7 | 0.7 | 3 | 0.8 | 0 | 0 | 18 | 2.1 | 1 | 0.6 | ||
| 130-139 | 105 | 0.7 | 70.7 | 85 | 0.9 | 7 | 0.3 | 4 | 0.4 | 2 | 0.5 | 0 | 2 | 0.6 | 5 | 0.6 | 0 | ||
| 140-149 | 79 | 0.6 | 71.3 | 59 | 0.6 | 5 | 0.2 | 9 | 0.8 | 0 | 0 | 2 | 0.6 | 4 | 0.5 | 0 | |||
| 150-159 | 295 | 2.0 | 73.3 | 191 | 2.0 | 46 | 2.2 | 11 | 1.0 | 11 | 2.9 | 0 | 2 | 0.6 | 27 | 3.2 | 7 | 4.0 | |
| 160-169 | 72 | 0.5 | 73.8 | 54 | 0.6 | 7 | 0.3 | 2 | 0.2 | 3 | 0.8 | 0 | 0 | 5 | 0.6 | 1 | 0.6 | ||
| 170-179 | 116 | 0.8 | 74.6 | 82 | 0.9 | 11 | 0.5 | 11 | 1.0 | 3 | 0.8 | 0 | 2 | 0.6 | 5 | 0.6 | 2 | 1.1 | |
| 180-189 | 67 | 0.5 | 75.1 | 49 | 0.5 | 11 | 0.5 | 0 | 0 | 0 | 0 | 7 | 0.8 | 0 | |||||
| 190-199 | 23 | 0.2 | 75.3 | 17 | 0.2 | 2 | 0.1 | 1 | 0.1 | 0 | 0 | 1 | 0.3 | 1 | 0.1 | 1 | 0.6 | ||
| 200-299 | 826 | 5.7 | 81.0 | 585 | 6.2 | 118 | 5.7 | 38 | 3.5 | 20 | 5.2 | 0 | 3 | 0.9 | 56 | 6.6 | 6 | 3.4 | |
| 300-399 | 442 | 3.1 | 84.1 | 292 | 3.1 | 85 | 4.1 | 22 | 2.1 | 5 | 1.3 | 0 | 2 | 0.6 | 34 | 4.0 | 2 | 1.1 | |
| 400-499 | 297 | 2.1 | 86.2 | 213 | 2.2 | 47 | 2.3 | 9 | 0.8 | 11 | 2.9 | 0 | 0 | 11 | 1.3 | 6 | 3.4 | ||
| 500-599 | 315 | 2.2 | 88.4 | 200 | 2.1 | 66 | 3.2 | 17 | 1.6 | 7 | 1.8 | 1 | 4.2 | 1 | 0.3 | 20 | 2.4 | 3 | 1.7 |
| 600-699 | 160 | 1.1 | 89.5 | 110 | 1.2 | 31 | 1.5 | 3 | 0.3 | 3 | 0.8 | 0 | 0 | 12 | 1.4 | 1 | 0.6 | ||
| 700-799 | 127 | 0.9 | 90.4 | 75 | 0.8 | 27 | 1.3 | 5 | 0.5 | 4 | 1.0 | 0 | 2 | 0.6 | 13 | 1.5 | 1 | 0.6 | |
| 800-899 | 94 | 0.7 | 91.1 | 60 | 0.6 | 19 | 0.9 | 1 | 0.1 | 4 | 1.0 | 0 | 1 | 0.3 | 9 | 1.1 | 0 | ||
| 900-999 | 52 | 0.4 | 91.5 | 38 | 0.4 | 6 | 0.3 | 2 | 0.2 | 2 | 0.5 | 0 | 1 | 0.3 | 3 | 0.4 | 0 | ||
| 1,000-1,999 | 453 | 3.1 | 94.6 | 289 | 3.0 | 81 | 3.9 | 20 | 1.9 | 11 | 2.9 | 0 | 4 | 1.2 | 45 | 5.3 | 3 | 1.7 | |
| 2,000-2,999 | 205 | 1.4 | 96.0 | 121 | 1.3 | 41 | 2.0 | 4 | 0.4 | 2 | 0.5 | 2 | 8.3 | 2 | 0.6 | 32 | 3.8 | 1 | 0.6 |
| 3,000-3,999 | 120 | 0.8 | 96.8 | 57 | 0.6 | 31 | 1.5 | 9 | 0.8 | 3 | 0.8 | 0 | 0 | 20 | 2.4 | 0 | |||
| 4,000-4,999 | 74 | 0.5 | 97.3 | 40 | 0.4 | 15 | 0.7 | 3 | 0.3 | 0 | 0 | 2 | 0.6 | 14 | 1.7 | 0 | |||
| 5,000-9,999 | 165 | 1.1 | 98.4 | 64 | 0.7 | 62 | 3.0 | 5 | 0.5 | 5 | 1.3 | 0 | 3 | 0.9 | 26 | 3.1 | 0 | ||
| 10,000 and over | 235 | 1.6 | 100.0 | 132 | 1.4 | 61 | 2.9 | 4 | 0.4 | 3 | 0.8 | 1 | 4.2 | 3 | 0.9 | 29 | 3.4 | 2 | 1.1 |
- 1 See "Glossary" for definition of terms.
- 2 Based on revised situation count which absorbs companion cases, cross-filing and multiple filings as compared to situations shown in charts 1 and 2 of chapter I, which are based on single and multiple filings of same type of case.
267 of 267 figures sit in a row or column sum that works out.
Reader’s notes
p. 265. Crop is cut off at the bottom: the body ends after the "110-119" row with the column rules still running, so the remaining size classes (120 and over, not reported, etc.) continue below/on the next page and are not in this image. No footnote texts are printed in the crop, although two markers appear: a raised 1 on the caption (caption excluded per instructions) and a raised 2 before 14,425 in the Total row, transcribed as 14,425^2. Decimal points: this is a 1-bit scan in which many periods in the percent columns failed to reproduce and print as a gap (e.g. the Total row CC and Other C cells read "100 0", and cells such as "26 0", "8 1", "6 3", "63 1", "0 4"). All such cells are one-decimal percentages and have been transcribed with the decimal point restored; no digits were changed. Doubtful cells: CB "Percent by size class" in row "10-19" is read as 8.1, but 167/2,076 = 8.04, so the printed glyph may be 8.0 — this is the one cell where my reading disagrees with the implied ratio. Other low-confidence (faint-point) readings I cross-checked against the ratios and kept as printed: CA percent 8.6 for "20-29" (ratio 8.69), CP percent 5.8 for "40-49" (5.87), CP percent 1.1 for "80-89" (1.17), CP percent 1.7 for "90-99" (1.76), Other C percent 6.7 for "100-109" (6.78) — the table appears to truncate rather than round in several places, so these are plausible as printed. Blank cells: the CE "Percent by size class" column is blank or a dash rule in every row whose CE number is 0 (10-19 shows an empty cell, the later zero rows show a dash rule); the Other C percent cell for "110-119" and the Total row's cumulative-percent cell are dash rules. All are transcribed as "".
p. 266. The crop is the bottom continuation of a table carried over from the preceding page: no column headings are printed on this image, so header_rows is empty, and no caption, total row or upper body rows appear here. The grid has 20 columns: the stub (size class), a count, a percent, a cumulative percent, and then eight count/percent pairs. That column count is confirmed arithmetically: in every row the eight pair counts sum exactly to the row's total count, and the cumulative-percent column rises by exactly the percent column's value from row to row. Column boundaries: the dash rules ("------") that stand in for a zero percent occupy the percent column of the pair whose count is 0, and every such pair has count 0, in all 22 rows. Scan quality: the type is worn and many decimal points did not print or did not survive the 1-bit scan, so cells appear as "70 0", "0 3", "2 1", "8 3", "1 6" etc. These are transcribed with the decimal point ("70.0", "0.3", "2.1", "8.3", "1.6"); each such reading is consistent with the arithmetic checks above (e.g. 2/24 = 8.3 percent in row 2,000-2,999). Doubtful cells: row "130-139", last pair (columns 19 and 20) - a stray mark resembling a "1" sits just left of the final count, which itself reads as "0" followed by a dash rule. I transcribed the pair as 0 and "" because that is what the printed row total requires (85+7+4+2+0+2+5 = 105) and because a dash percent accompanies a count of 0 everywhere else in the table; if the mark is instead a real "1", the components would sum to 106 against a printed total of 105. Row "400-499", column 9 (the 4th pair's count): a small stray mark precedes the digit, giving the appearance of "~9"; the value is 9 (213+47+9+11+0+0+11+6 = 297). Row "180-189": the percent cells of the 3rd through 6th pairs are faint and may be blank rather than dash rules; either way they are transcribed as "". Row label "3,000-3,999" is printed with a very faint hyphen. In footnote 2 the opening words of the last line are smudged in the scan; "are based on" is my reading of the partly visible characters. Cells holding only a dash rule or leader dots are "".
Source image
Source data: U.S. NLRB Annual Reports (public domain). Reconstruction by NLRB Stats Archive. Read by claude-opus-5 (effort max, prompt extract_v1) from the 300-dpi scan; stitched by page. Updated October 2026.