NLRB Stats Archive › Annual Reports › FY1967 › Size of Units in Representation Election Cases Closed, Fiscal Year 1967
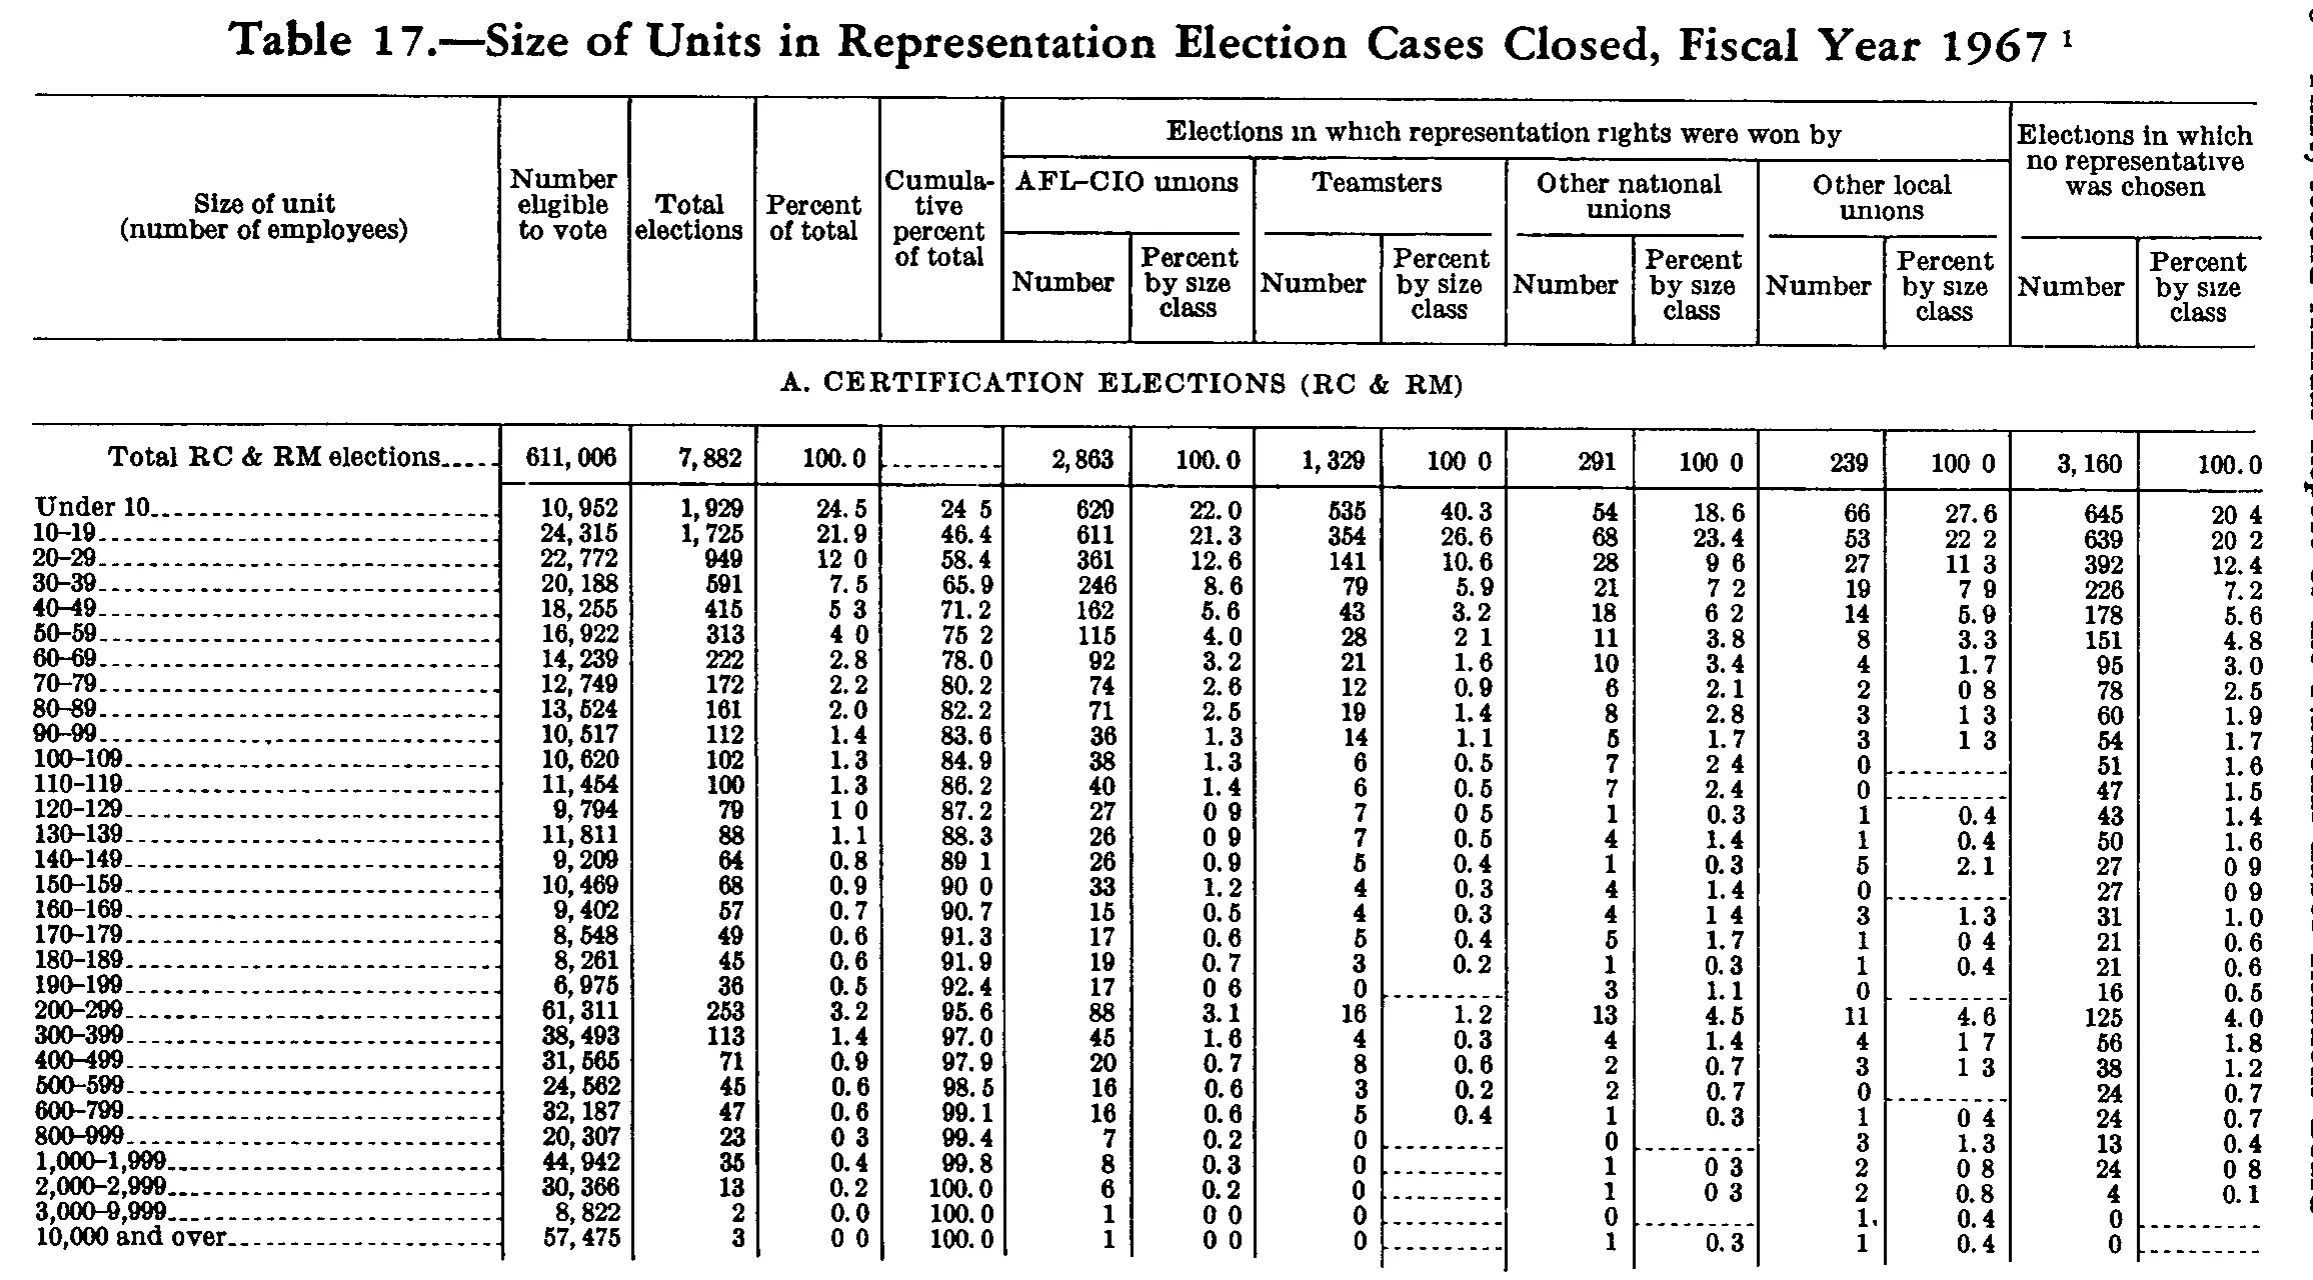
Size of Units in Representation Election Cases Closed, Fiscal Year 1967
Stitched from pp. 263–264.
| Size of unit (number of employees) | Number eligible to vote | Total elections | Percent of total | Cumulative percent of total | Elections in which representation rights were won by | Elections in which no representative was chosen | ||||||||
|---|---|---|---|---|---|---|---|---|---|---|---|---|---|---|
| Size of unit (number of employees) | Number eligible to vote | Total elections | Percent of total | Cumulative percent of total | AFL-CIO unions | Teamsters | Other national unions | Other local unions | Elections in which no representative was chosen | |||||
| Size of unit (number of employees) | Number eligible to vote | Total elections | Percent of total | Cumulative percent of total | Number | Percent by size class | Number | Percent by size class | Number | Percent by size class | Number | Percent by size class | Number | Percent by size class |
| A. CERTIFICATION ELECTIONS (RC & RM) | ||||||||||||||
| Total RC & RM elections | 611,006 | 7,882 | 100.0 | 2,863 | 100.0 | 1,329 | 100.0 | 291 | 100.0 | 239 | 100.0 | 3,160 | 100.0 | |
| Under 10 | 10,952 | 1,929 | 24.5 | 24.5 | 629 | 22.0 | 535 | 40.3 | 54 | 18.6 | 66 | 27.6 | 645 | 20.4 |
| 10-19 | 24,315 | 1,725 | 21.9 | 46.4 | 611 | 21.3 | 354 | 26.6 | 68 | 23.4 | 53 | 22.2 | 639 | 20.2 |
| 20-29 | 22,772 | 949 | 12.0 | 58.4 | 361 | 12.6 | 141 | 10.6 | 28 | 9.6 | 27 | 11.3 | 392 | 12.4 |
| 30-39 | 20,188 | 591 | 7.5 | 65.9 | 246 | 8.6 | 79 | 5.9 | 21 | 7.2 | 19 | 7.9 | 226 | 7.2 |
| 40-49 | 18,255 | 415 | 5.3 | 71.2 | 162 | 5.6 | 43 | 3.2 | 18 | 6.2 | 14 | 5.9 | 178 | 5.6 |
| 50-59 | 16,922 | 313 | 4.0 | 75.2 | 115 | 4.0 | 28 | 2.1 | 11 | 3.8 | 8 | 3.3 | 151 | 4.8 |
| 60-69 | 14,239 | 222 | 2.8 | 78.0 | 92 | 3.2 | 21 | 1.6 | 10 | 3.4 | 4 | 1.7 | 95 | 3.0 |
| 70-79 | 12,749 | 172 | 2.2 | 80.2 | 74 | 2.6 | 12 | 0.9 | 6 | 2.1 | 2 | 0.8 | 78 | 2.5 |
| 80-89 | 13,524 | 161 | 2.0 | 82.2 | 71 | 2.5 | 19 | 1.4 | 8 | 2.8 | 3 | 1.3 | 60 | 1.9 |
| 90-99 | 10,517 | 112 | 1.4 | 83.6 | 36 | 1.3 | 14 | 1.1 | 5 | 1.7 | 3 | 1.3 | 54 | 1.7 |
| 100-109 | 10,620 | 102 | 1.3 | 84.9 | 38 | 1.3 | 6 | 0.5 | 7 | 2.4 | 0 | 51 | 1.6 | |
| 110-119 | 11,454 | 100 | 1.3 | 86.2 | 40 | 1.4 | 6 | 0.5 | 7 | 2.4 | 0 | 47 | 1.5 | |
| 120-129 | 9,794 | 79 | 1.0 | 87.2 | 27 | 0.9 | 7 | 0.5 | 1 | 0.3 | 1 | 0.4 | 43 | 1.4 |
| 130-139 | 11,811 | 88 | 1.1 | 88.3 | 26 | 0.9 | 7 | 0.5 | 4 | 1.4 | 1 | 0.4 | 50 | 1.6 |
| 140-149 | 9,209 | 64 | 0.8 | 89.1 | 26 | 0.9 | 5 | 0.4 | 1 | 0.3 | 5 | 2.1 | 27 | 0.9 |
| 150-159 | 10,469 | 68 | 0.9 | 90.0 | 33 | 1.2 | 4 | 0.3 | 4 | 1.4 | 0 | 27 | 0.9 | |
| 160-169 | 9,402 | 57 | 0.7 | 90.7 | 15 | 0.5 | 4 | 0.3 | 4 | 1.4 | 3 | 1.3 | 31 | 1.0 |
| 170-179 | 8,548 | 49 | 0.6 | 91.3 | 17 | 0.6 | 5 | 0.4 | 5 | 1.7 | 1 | 0.4 | 21 | 0.6 |
| 180-189 | 8,261 | 45 | 0.6 | 91.9 | 19 | 0.7 | 3 | 0.2 | 1 | 0.3 | 1 | 0.4 | 21 | 0.6 |
| 190-199 | 6,975 | 36 | 0.5 | 92.4 | 17 | 0.6 | 0 | 3 | 1.1 | 0 | 16 | 0.5 | ||
| 200-299 | 61,311 | 253 | 3.2 | 95.6 | 88 | 3.1 | 16 | 1.2 | 13 | 4.5 | 11 | 4.6 | 125 | 4.0 |
| 300-399 | 38,493 | 113 | 1.4 | 97.0 | 45 | 1.6 | 4 | 0.3 | 4 | 1.4 | 4 | 1.7 | 56 | 1.8 |
| 400-499 | 31,565 | 71 | 0.9 | 97.9 | 20 | 0.7 | 8 | 0.6 | 2 | 0.7 | 3 | 1.3 | 38 | 1.2 |
| 500-599 | 24,562 | 45 | 0.6 | 98.5 | 16 | 0.6 | 3 | 0.2 | 2 | 0.7 | 0 | 24 | 0.7 | |
| 600-799 | 32,187 | 47 | 0.6 | 99.1 | 16 | 0.6 | 5 | 0.4 | 1 | 0.3 | 1 | 0.4 | 24 | 0.7 |
| 800-999 | 20,307 | 23 | 0.3 | 99.4 | 7 | 0.2 | 0 | 0 | 3 | 1.3 | 13 | 0.4 | ||
| 1,000-1,999 | 44,942 | 35 | 0.4 | 99.8 | 8 | 0.3 | 0 | 1 | 0.3 | 2 | 0.8 | 24 | 0.8 | |
| 2,000-2,999 | 30,366 | 13 | 0.2 | 100.0 | 6 | 0.2 | 0 | 1 | 0.3 | 2 | 0.8 | 4 | 0.1 | |
| 3,000-9,999 | 8,822 | 2 | 0.0 | 100.0 | 1 | 0.0 | 0 | 0 | 1 | 0.4 | 0 | |||
| 10,000 and over | 57,475 | 3 | 0.0 | 100.0 | 1 | 0.0 | 0 | 1 | 0.3 | 1 | 0.4 | 0 | ||
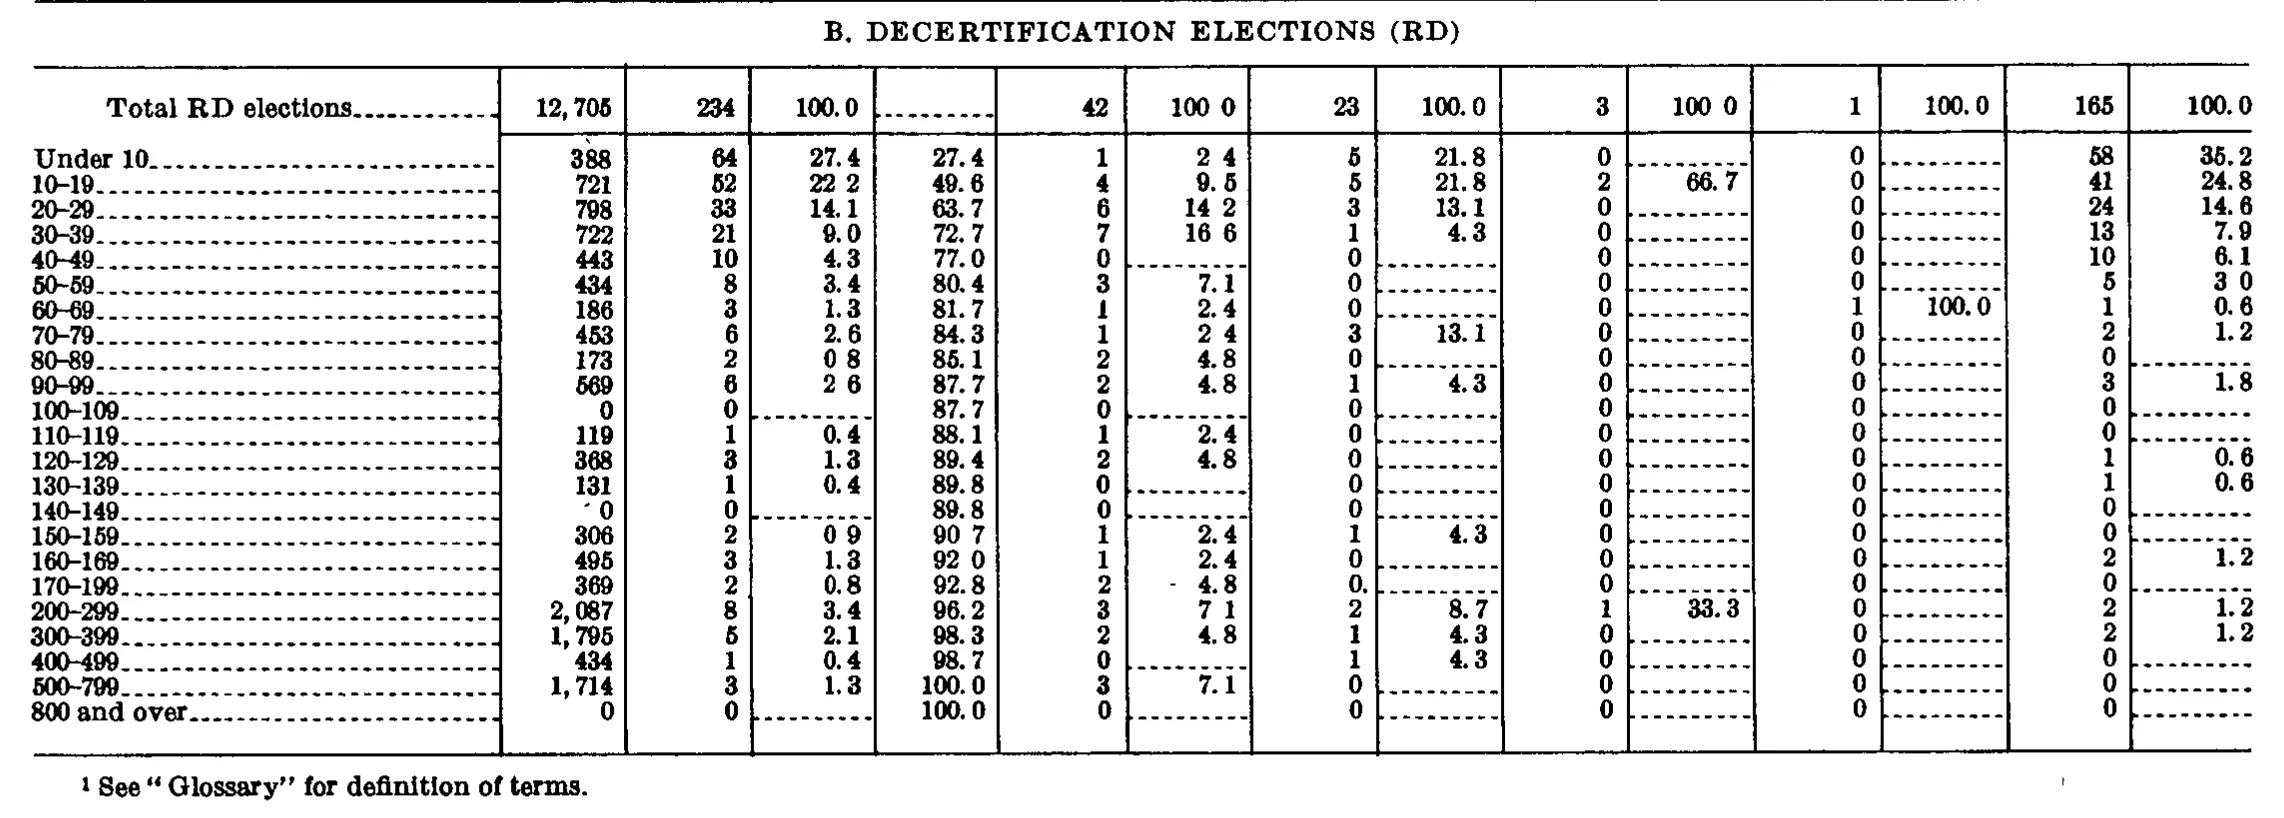
| B. DECERTIFICATION ELECTIONS (RD) | ||||||||||||||
| Total RD elections | 12,705 | 234 | 100.0 | 42 | 100.0 | 23 | 100.0 | 3 | 100.0 | 1 | 100.0 | 165 | 100.0 | |
| Under 10 | 388 | 64 | 27.4 | 27.4 | 1 | 2.4 | 5 | 21.8 | 0 | 0 | 58 | 35.2 | ||
| 10-19 | 721 | 52 | 22.2 | 49.6 | 4 | 9.5 | 5 | 21.8 | 2 | 66.7 | 0 | 41 | 24.8 | |
| 20-29 | 798 | 33 | 14.1 | 63.7 | 6 | 14.2 | 3 | 13.1 | 0 | 0 | 24 | 14.6 | ||
| 30-39 | 722 | 21 | 9.0 | 72.7 | 7 | 16.6 | 1 | 4.3 | 0 | 0 | 13 | 7.9 | ||
| 40-49 | 443 | 10 | 4.3 | 77.0 | 0 | 0 | 0 | 0 | 10 | 6.1 | ||||
| 50-59 | 434 | 8 | 3.4 | 80.4 | 3 | 7.1 | 0 | 0 | 0 | 5 | 3.0 | |||
| 60-69 | 186 | 3 | 1.3 | 81.7 | 1 | 2.4 | 0 | 0 | 1 | 100.0 | 1 | 0.6 | ||
| 70-79 | 453 | 6 | 2.6 | 84.3 | 1 | 2.4 | 3 | 13.1 | 0 | 0 | 2 | 1.2 | ||
| 80-89 | 173 | 2 | 0.8 | 85.1 | 2 | 4.8 | 0 | 0 | 0 | 0 | ||||
| 90-99 | 569 | 6 | 2.6 | 87.7 | 2 | 4.8 | 1 | 4.3 | 0 | 0 | 3 | 1.8 | ||
| 100-109 | 0 | 0 | 87.7 | 0 | 0 | 0 | 0 | 0 | ||||||
| 110-119 | 119 | 1 | 0.4 | 88.1 | 1 | 2.4 | 0 | 0 | 0 | 0 | ||||
| 120-129 | 368 | 3 | 1.3 | 89.4 | 2 | 4.8 | 0 | 0 | 0 | 1 | 0.6 | |||
| 130-139 | 131 | 1 | 0.4 | 89.8 | 0 | 0 | 0 | 0 | 1 | 0.6 | ||||
| 140-149 | 0 | 0 | 89.8 | 0 | 0 | 0 | 0 | 0 | ||||||
| 150-159 | 306 | 2 | 0.9 | 90.7 | 1 | 2.4 | 1 | 4.3 | 0 | 0 | 0 | |||
| 160-169 | 495 | 3 | 1.3 | 92.0 | 1 | 2.4 | 0 | 0 | 0 | 2 | 1.2 | |||
| 170-199 | 369 | 2 | 0.8 | 92.8 | 2 | 4.8 | 0 | 0 | 0 | 0 | ||||
| 200-299 | 2,087 | 8 | 3.4 | 96.2 | 3 | 7.1 | 2 | 8.7 | 1 | 33.3 | 0 | 2 | 1.2 | |
| 300-399 | 1,795 | 5 | 2.1 | 98.3 | 2 | 4.8 | 1 | 4.3 | 0 | 0 | 2 | 1.2 | ||
| 400-499 | 434 | 1 | 0.4 | 98.7 | 0 | 1 | 4.3 | 0 | 0 | 0 | ||||
| 500-799 | 1,714 | 3 | 1.3 | 100.0 | 3 | 7.1 | 0 | 0 | 0 | 0 | ||||
| 800 and over | 0 | 0 | 100.0 | 0 | 0 | 0 | 0 | 0 | ||||||
- 1 See "Glossary" for definition of terms.
293 of 293 figures sit in a row or column sum that works out.
Reader’s notes
p. 263. 15 columns: stub + 4 single columns + four Number/Percent pairs under "Elections in which representation rights were won by" + one Number/Percent pair under "Elections in which no representative was chosen". Decimal points: in this scan the decimal point in the percent columns is frequently too faint to resolve, so many cells read like "24 5", "5 3", "100 0", "0 0". Every one of these columns is uniformly one-decimal percentages, so I transcribed them with the decimal point ("24.5", "5.3", "100.0", "0.0"). No digits were altered. If a strictly literal rendering is wanted, the affected cells are the ones where the point is faint, which is roughly half of the percent cells. Row "3,000-9,999", column "Other local unions / Number": the glyph is printed as "1." with a trailing dot. I read the dot as a stray leader/ink mark and transcribed the cell as "1"; the value is consistent with the 0.4 percent beside it. Row "Total RC & RM elections", column "Cumulative percent of total": a dash rule, transcribed "". Cells transcribed "" in the percent columns (rows 100-109, 110-119, 150-159, 190-199 Teamsters and Other local, 500-599, 800-999, 1,000-1,999, 2,000-2,999, 3,000-9,999, 10,000 and over) each hold a dash rule beside a printed 0 in the matching Number column. Crop: the table is cut off immediately below the "10,000 and over" row. Any further panel (the report's companion section B) and any footnote text printed under the table are not on this image, so `footnotes` is empty even though the caption carries a raised 1 marker. The caption's marker and the rotated text bleeding in along the right edge (from the facing page) were both left out. Row labels use en dashes in print ("10–19"); transcribed with plain hyphens.
p. 264. No column headings are printed on this crop — it is the continuation half of a table whose headings stand on the preceding page — so header_rows is empty. The grid has 15 columns: the stub plus 14 value columns, read off the vertical rules as (1) a count, (2) number of elections, (3) percent, (4) cumulative percent, then six further pairs of count/percent (totals 42, 23, 3, 1, 165 and their percent columns). "B. DECERTIFICATION ELECTIONS (RD)" is printed centred above the body as a section divider, not as a column heading, and is given as a label-only row. Decimal points: in many percent cells the printed point is lost or reduced to a gap by the scan ("100 0", "22 2", "2 4", "16 6", "14 2", "0 8", "2 6", "0 9", "90 7", "92 0", "7 1", "3 0"). These are transcribed with the decimal point restored. The reading is confirmed arithmetically — the percent columns each total exactly 100.0 (column 3 also reproduces the printed cumulative column, and 14.2 at "20-29" and 16.6 at "30-39" are needed for column 6 to reach 100.0, even though 6/42 and 7/42 round to 14.3 and 16.7), and the count columns sum to their printed totals (234, 42, 23, 3, 1, 165; column 1 sums to 12,705). Minor scan artefacts, all transcribed as the plain digit: row "170-199", seventh value column, the 0 carries a trailing speck that can look like a period; row "140-149", first value column, a stray tick precedes the 0. A small ink speck sits in the lower right margin below the rule, outside the table. Cells shown with dash/leader rules (no value) are given as "". Printed zeros are kept as 0.
Source image
Source data: U.S. NLRB Annual Reports (public domain). Reconstruction by NLRB Stats Archive. Read by claude-opus-5 (effort max, prompt extract_v1) from the 300-dpi scan; stitched by page. Updated October 2026.