NLRB Stats Archive › Annual Reports › FY1967 › Elections in Which Certification Issued After Objections to Election Were Filed and/or in Which Determination of Challenges Was Required, Fiscal Year 1967
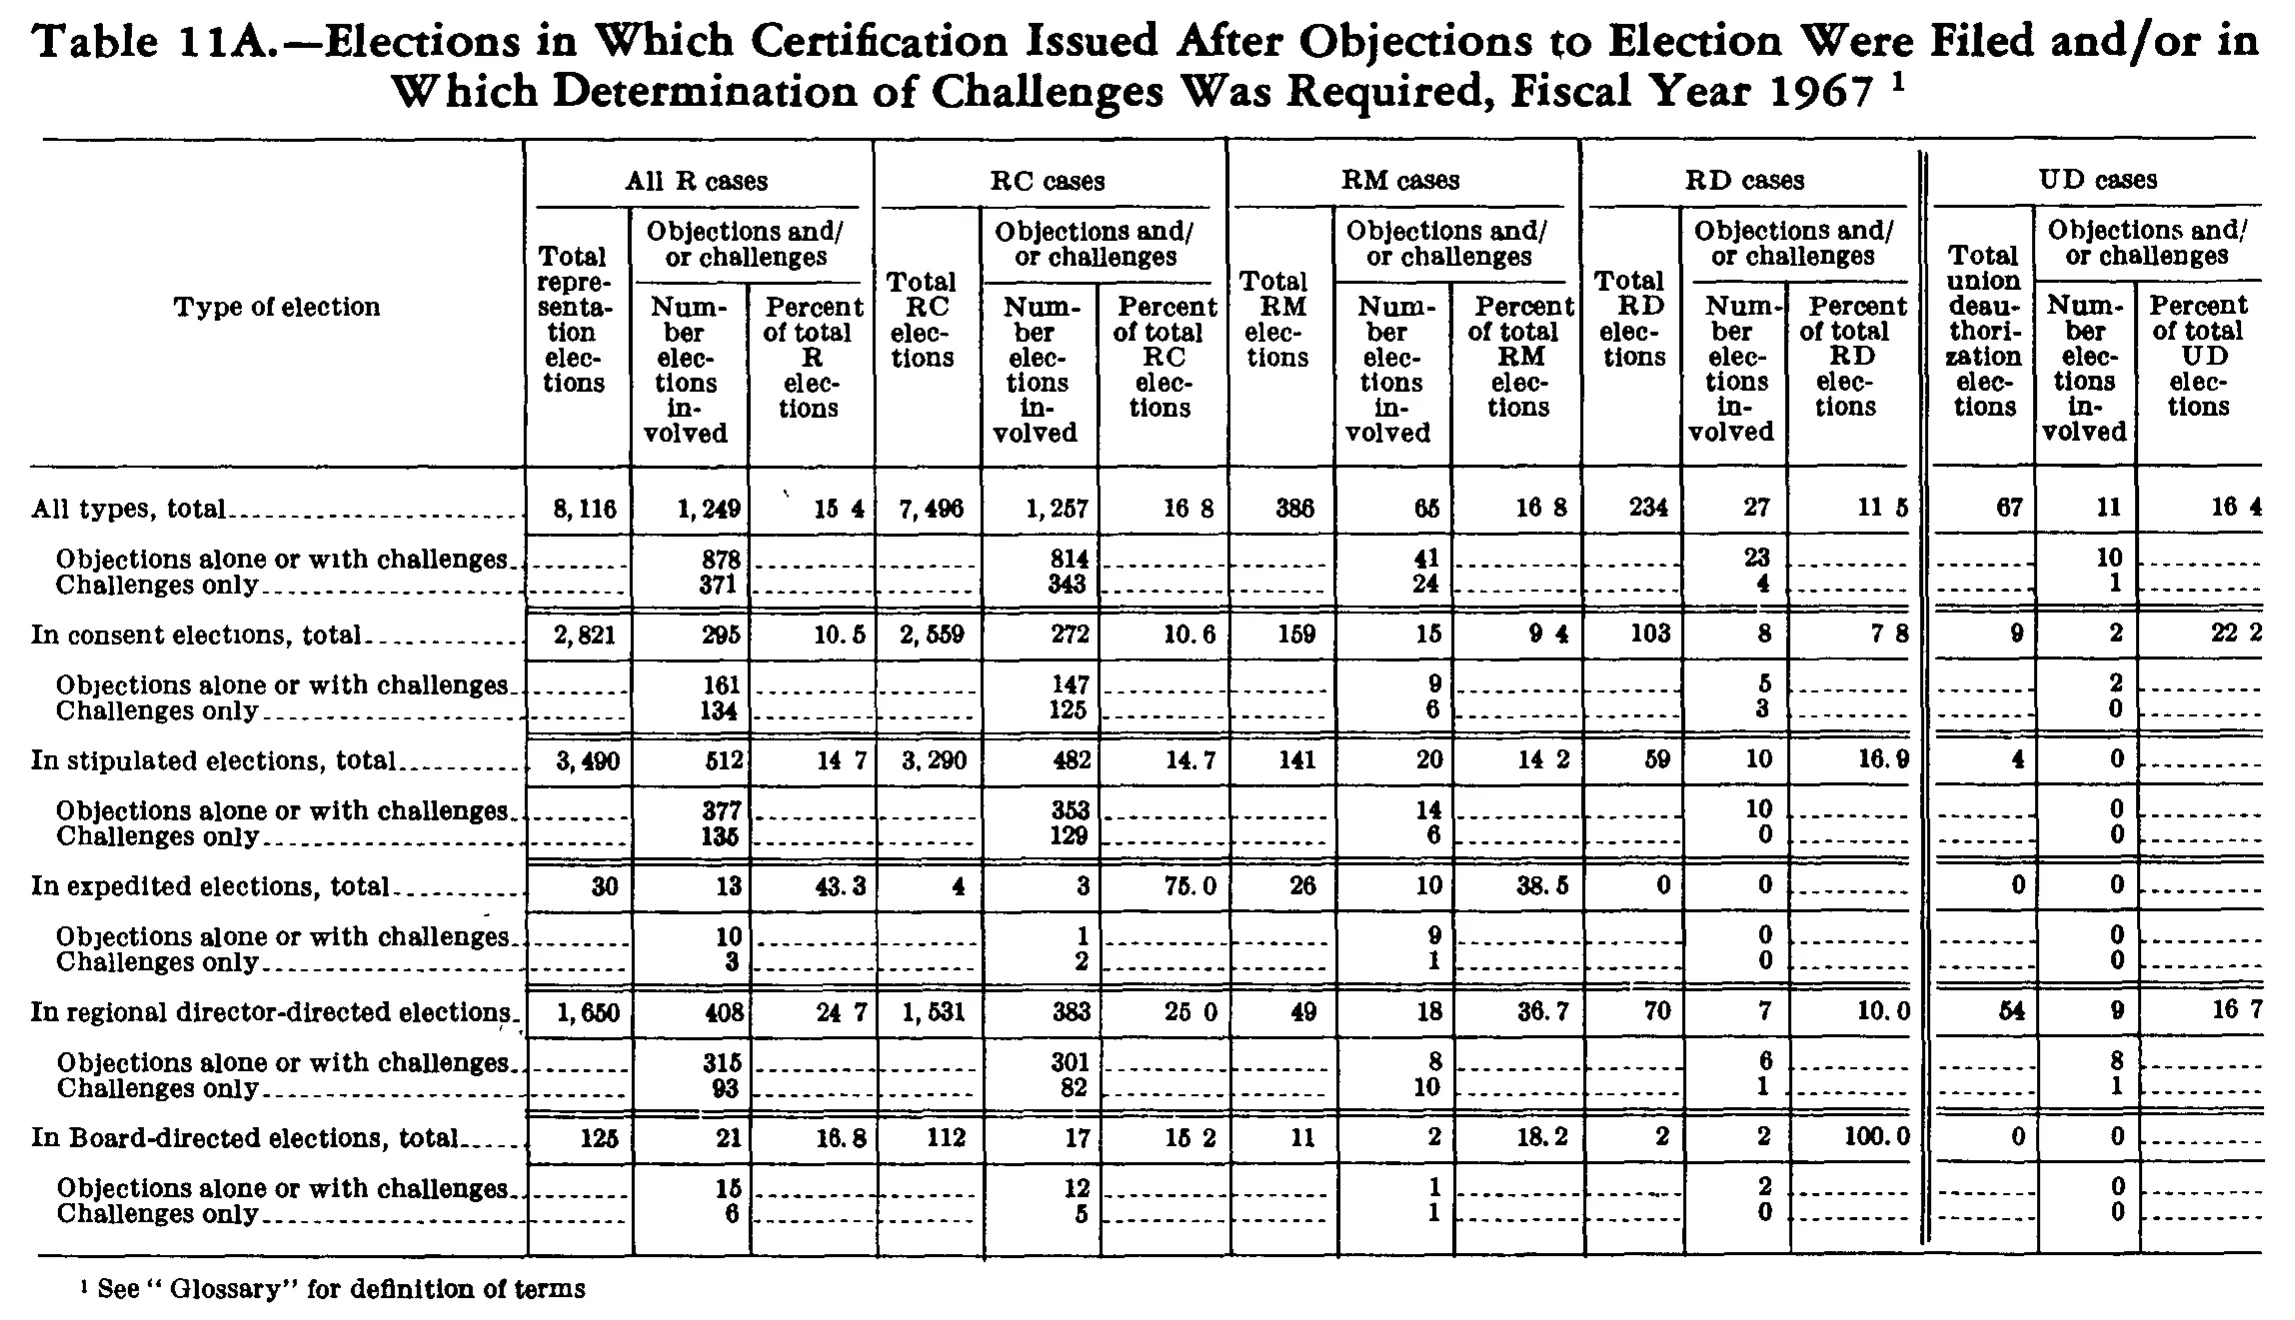
Elections in Which Certification Issued After Objections to Election Were Filed and/or in Which Determination of Challenges Was Required, Fiscal Year 1967
| Type of election | All R cases | RC cases | RM cases | RD cases | UD cases | ||||||||||
|---|---|---|---|---|---|---|---|---|---|---|---|---|---|---|---|
| Type of election | Total representation elections | Objections and/or challenges | Total RC elections | Objections and/or challenges | Total RM elections | Objections and/or challenges | Total RD elections | Objections and/or challenges | Total union deauthorization elections | Objections and/or challenges | |||||
| Type of election | Total representation elections | Number elections involved | Percent of total R elections | Total RC elections | Number elections involved | Percent of total RC elections | Total RM elections | Number elections involved | Percent of total RM elections | Total RD elections | Number elections involved | Percent of total RD elections | Total union deauthorization elections | Number elections involved | Percent of total UD elections |
| All types, total | 8,116 | 1,249 | 15.4 | 7,496 | 1,257 | 16.8 | 386 | 65 | 16.8 | 234 | 27 | 11.5 | 67 | 11 | 16.4 |
| Objections alone or with challenges | 878 | 814 | 41 | 23 | 10 | ||||||||||
| Challenges only | 371 | 343 | 24 | 4 | 1 | ||||||||||
| In consent elections, total | 2,821 | 295 | 10.5 | 2,559 | 272 | 10.6 | 159 | 15 | 9.4 | 103 | 8 | 7.8 | 9 | 2 | 22.2 |
| Objections alone or with challenges | 161 | 147 | 9 | 5 | 2 | ||||||||||
| Challenges only | 134 | 125 | 6 | 3 | 0 | ||||||||||
| In stipulated elections, total | 3,490 | 512 | 14.7 | 3,290 | 482 | 14.7 | 141 | 20 | 14.2 | 59 | 10 | 16.9 | 4 | 0 | |
| Objections alone or with challenges | 377 | 353 | 14 | 10 | 0 | ||||||||||
| Challenges only | 135 | 129 | 6 | 0 | 0 | ||||||||||
| In expedited elections, total | 30 | 13 | 43.3 | 4 | 3 | 75.0 | 26 | 10 | 38.5 | 0 | 0 | 0 | 0 | ||
| Objections alone or with challenges | 10 | 1 | 9 | 0 | 0 | ||||||||||
| Challenges only | 3 | 2 | 1 | 0 | 0 | ||||||||||
| In regional director-directed elections | 1,650 | 408 | 24.7 | 1,531 | 383 | 25.0 | 49 | 18 | 36.7 | 70 | 7 | 10.0 | 54 | 9 | 16.7 |
| Objections alone or with challenges | 315 | 301 | 8 | 6 | 8 | ||||||||||
| Challenges only | 93 | 82 | 10 | 1 | 1 | ||||||||||
| In Board-directed elections, total | 125 | 21 | 16.8 | 112 | 17 | 15.2 | 11 | 2 | 18.2 | 2 | 2 | 100.0 | 0 | 0 | |
| Objections alone or with challenges | 15 | 12 | 1 | 2 | 0 | ||||||||||
| Challenges only | 6 | 5 | 1 | 0 | 0 | ||||||||||
- 1 See "Glossary" for definition of terms
0 of 102 figures sit in a row or column sum that works out.
Reader’s notes
p. 248. Grid is 16 columns: stub plus five 3-column panels (All R, RC, RM, RD, UD cases); the UD panel is set off by a double rule. The table caption carries footnote marker 1 (caption omitted per instructions). Decimal points in the percent columns: the scan drops or thins many of the printed periods, so the same column shows both \"14.7\" and \"14 7\"-looking cells. Every percent cell is unambiguously a one-decimal figure (each matches Number/Total for its panel), so I transcribed them all with the decimal point. Cells where the period is faint or absent in the scan: All types total (All R 15.4, RC 16.8, RM 16.8, RD 11.5, UD 16.4); consent (RM 9.4, RD 7.8, UD 22.2); stipulated (All R 14.7, RM 14.2); regional director-directed (All R 24.7, RC 25.0, UD 16.7); Board-directed (RC 15.2). Suspected misprint in the source, transcribed as printed: in \"All types, total\" the RC panel reads 1,257 with 16.8 percent. Both the RC Number column (272+482+3+383+17 = 1,157) and that row's own detail lines (814 + 343 = 1,157) give 1,157, and All R 1,249 = 1,157 + 65 (RM) + 27 (RD). The printed 16.8 is internally consistent with 1,257 (1,257/7,496 = 16.8), which suggests a source data error carried into both cells rather than a typesetting slip; note, however, that the scan is degraded at these two cells and a misread of 1,157/15.4 cannot be fully excluded. Every other row and column cross-foots exactly. Row label \"In regional director-directed elections\" is printed without the \", total\" that the other section-total rows carry; it runs flush to the column rule, so the wording is as transcribed. Cells holding only leader dots or a dash rule are rendered as \"\" (all Total and Percent cells on the \"Objections alone or with challenges\" / \"Challenges only\" detail lines, plus the RD and UD percent cells for expedited elections and the UD percent cells for stipulated, expedited and Board-directed elections).
Source image
Source data: U.S. NLRB Annual Reports (public domain). Reconstruction by NLRB Stats Archive. Read by claude-opus-5 (effort max, prompt extract_v1) from the 300-dpi scan; stitched by page. Updated October 2026.