NLRB Stats Archive › Annual Reports › FY1967 › Geographic Distribution of Cases Received, Fiscal Year 1967
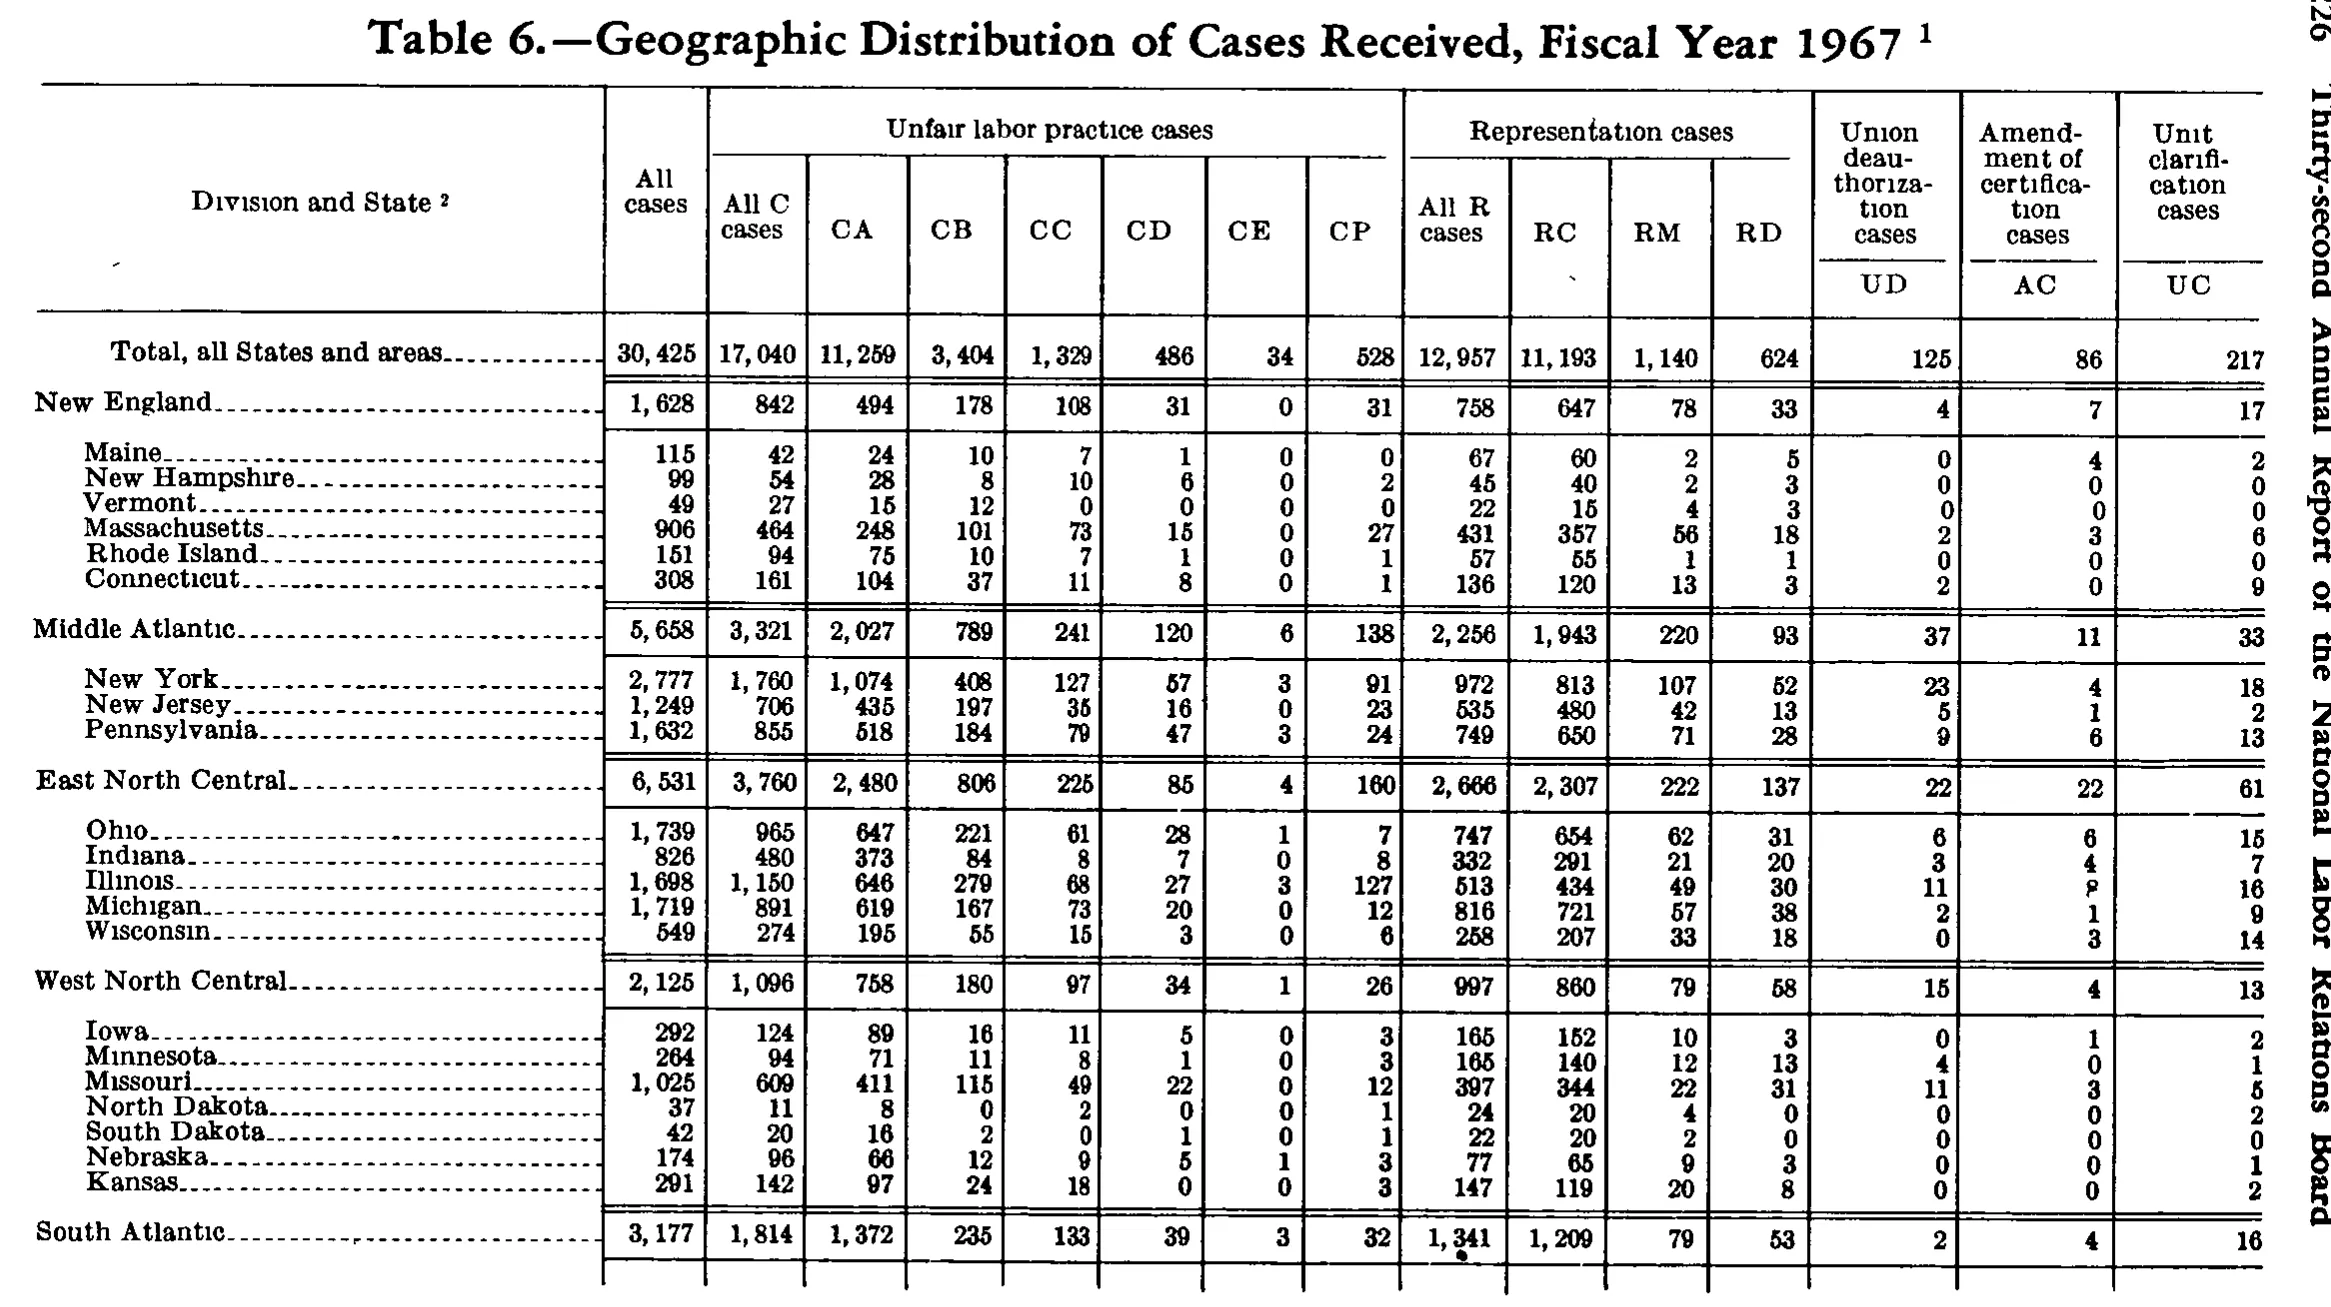
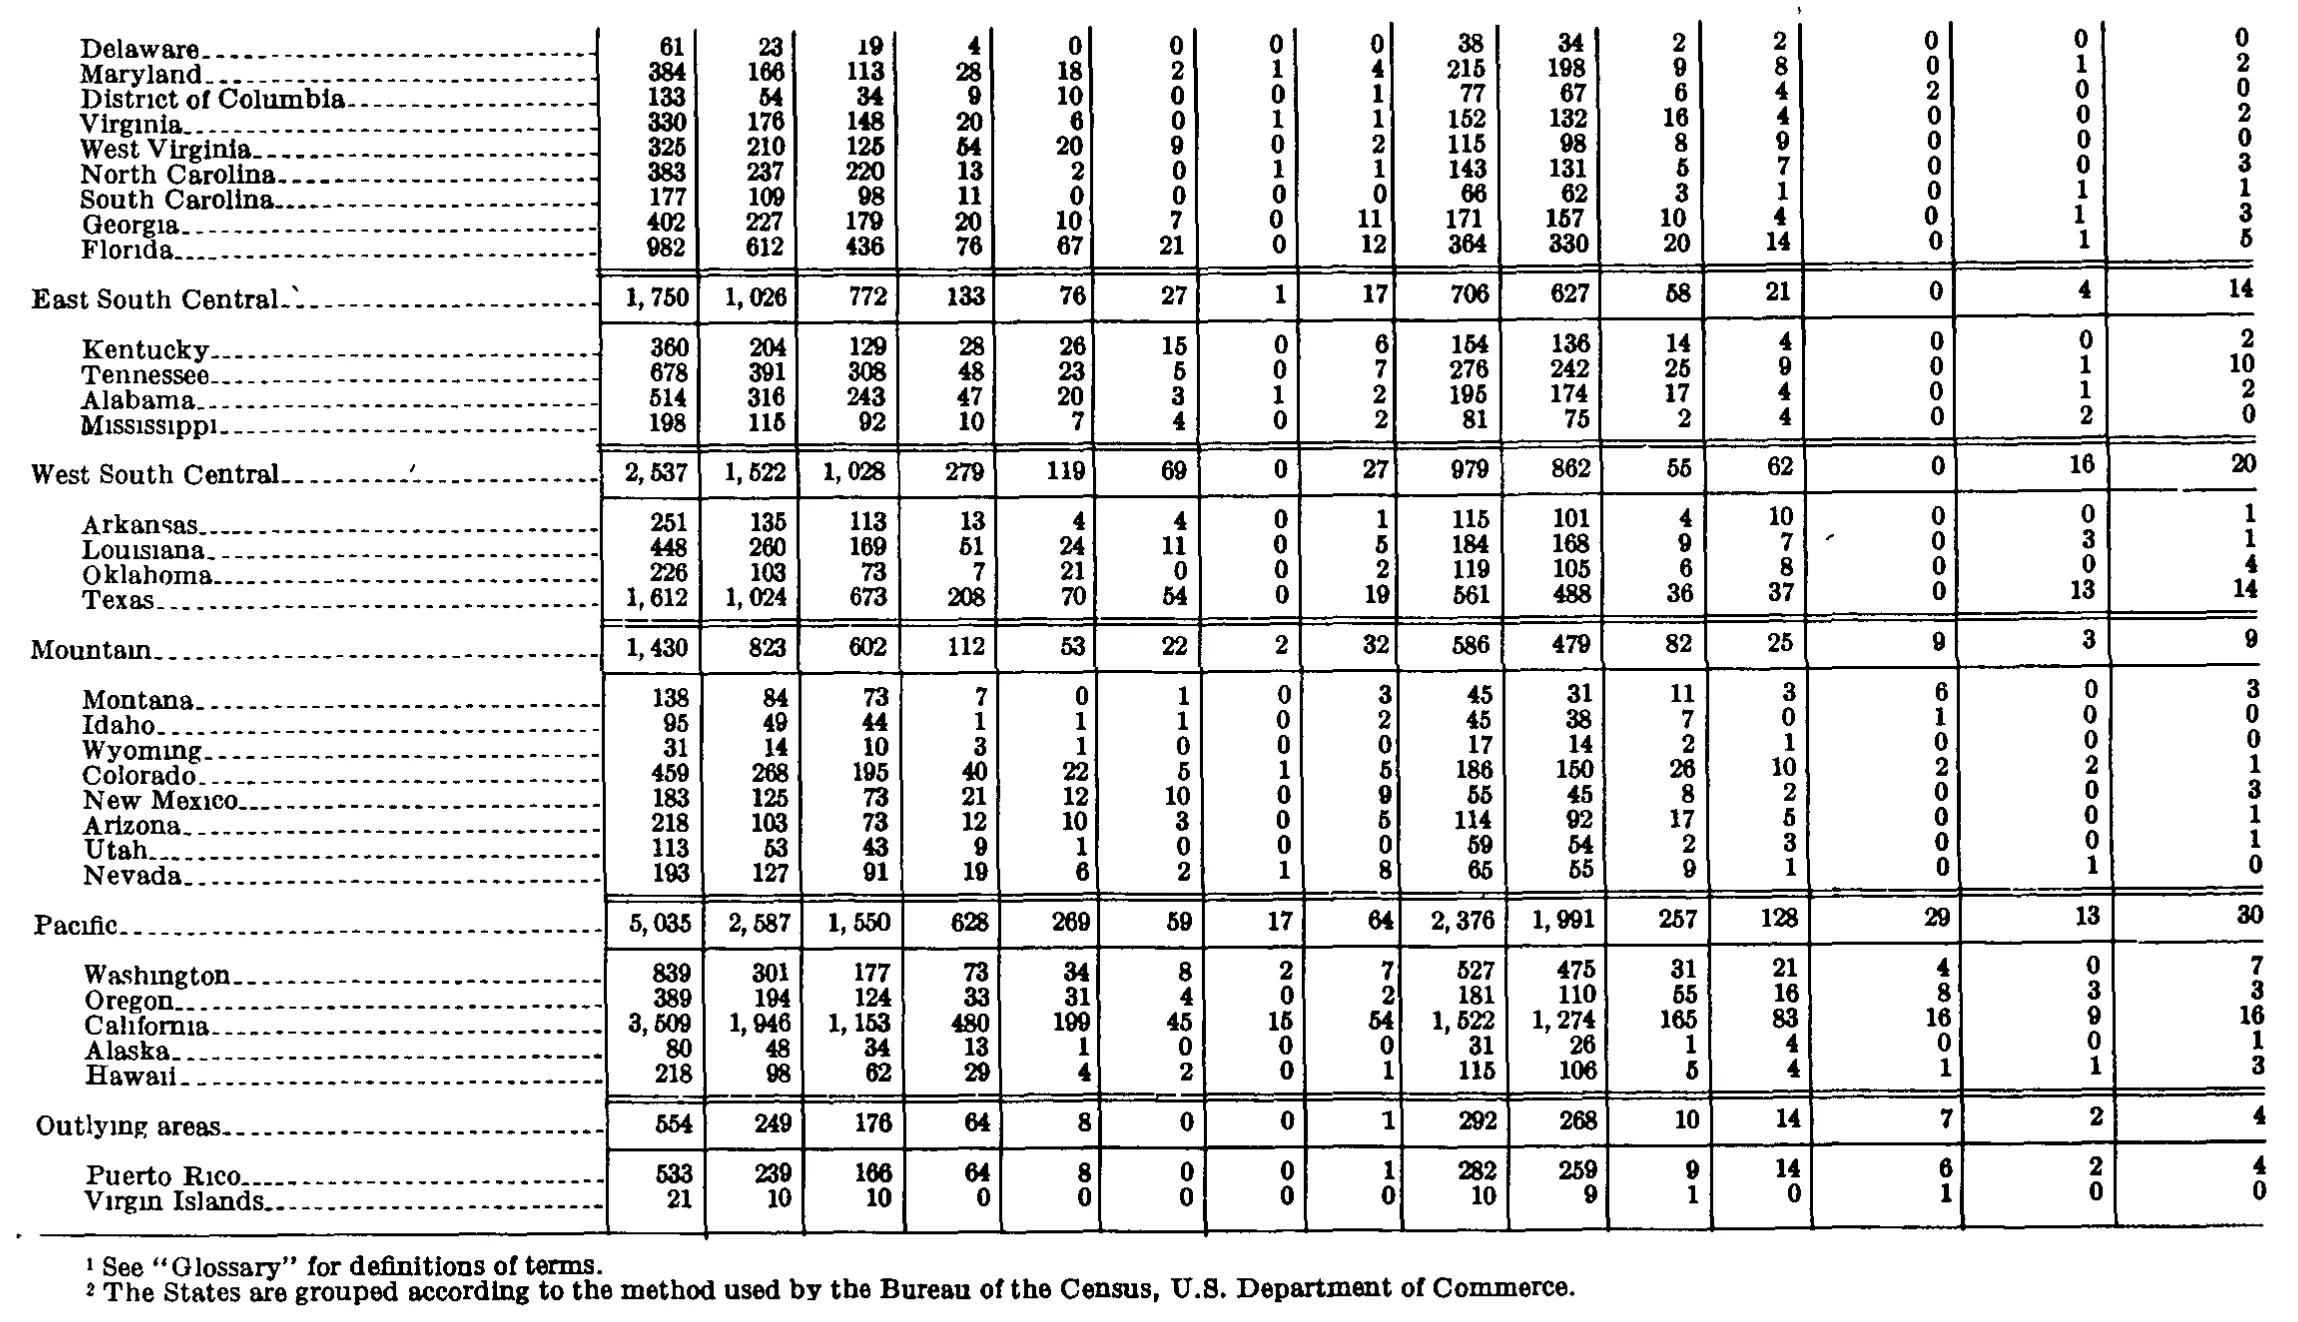
Geographic Distribution of Cases Received, Fiscal Year 1967
Stitched from pp. 239–240.
| Division and State | All cases | Unfair labor practice cases | Representation cases | Union deauthorization cases | Amendment of certification cases | Unit clarification cases | |||||||||
|---|---|---|---|---|---|---|---|---|---|---|---|---|---|---|---|
| Division and State | All cases | All C cases | CA | CB | CC | CD | CE | CP | All R cases | RC | RM | RD | Union deauthorization cases | Amendment of certification cases | Unit clarification cases |
| Division and State | All cases | All C cases | CA | CB | CC | CD | CE | CP | All R cases | RC | RM | RD | UD | AC | UC |
| Total, all States and areas | 30,425 | 17,040 | 11,259 | 3,404 | 1,329 | 486 | 34 | 528 | 12,957 | 11,193 | 1,140 | 624 | 125 | 86 | 217 |
| New England | 1,628 | 842 | 494 | 178 | 108 | 31 | 0 | 31 | 758 | 647 | 78 | 33 | 4 | 7 | 17 |
| Maine | 115 | 42 | 24 | 10 | 7 | 1 | 0 | 0 | 67 | 60 | 2 | 5 | 0 | 4 | 2 |
| New Hampshire | 99 | 54 | 28 | 8 | 10 | 6 | 0 | 2 | 45 | 40 | 2 | 3 | 0 | 0 | 0 |
| Vermont | 49 | 27 | 15 | 12 | 0 | 0 | 0 | 0 | 22 | 15 | 4 | 3 | 0 | 0 | 0 |
| Massachusetts | 906 | 464 | 248 | 101 | 73 | 15 | 0 | 27 | 431 | 357 | 56 | 18 | 2 | 3 | 6 |
| Rhode Island | 151 | 94 | 75 | 10 | 7 | 1 | 0 | 1 | 57 | 55 | 1 | 1 | 0 | 0 | 0 |
| Connecticut | 308 | 161 | 104 | 37 | 11 | 8 | 0 | 1 | 136 | 120 | 13 | 3 | 2 | 0 | 9 |
| Middle Atlantic | 5,658 | 3,321 | 2,027 | 789 | 241 | 120 | 6 | 138 | 2,256 | 1,943 | 220 | 93 | 37 | 11 | 33 |
| New York | 2,777 | 1,760 | 1,074 | 408 | 127 | 57 | 3 | 91 | 972 | 813 | 107 | 52 | 23 | 4 | 18 |
| New Jersey | 1,249 | 706 | 435 | 197 | 35 | 16 | 0 | 23 | 535 | 480 | 42 | 13 | 5 | 1 | 2 |
| Pennsylvania | 1,632 | 855 | 518 | 184 | 79 | 47 | 3 | 24 | 749 | 650 | 71 | 28 | 9 | 6 | 13 |
| East North Central | 6,531 | 3,760 | 2,480 | 806 | 225 | 85 | 4 | 160 | 2,666 | 2,307 | 222 | 137 | 22 | 22 | 61 |
| Ohio | 1,739 | 965 | 647 | 221 | 61 | 28 | 1 | 7 | 747 | 654 | 62 | 31 | 6 | 6 | 15 |
| Indiana | 826 | 480 | 373 | 84 | 8 | 7 | 0 | 8 | 332 | 291 | 21 | 20 | 3 | 4 | 7 |
| Illinois | 1,698 | 1,150 | 646 | 279 | 68 | 27 | 3 | 127 | 513 | 434 | 49 | 30 | 11 | 8 | 16 |
| Michigan | 1,719 | 891 | 619 | 167 | 73 | 20 | 0 | 12 | 816 | 721 | 57 | 38 | 2 | 1 | 9 |
| Wisconsin | 549 | 274 | 195 | 55 | 15 | 3 | 0 | 6 | 258 | 207 | 33 | 18 | 0 | 3 | 14 |
| West North Central | 2,125 | 1,096 | 758 | 180 | 97 | 34 | 1 | 26 | 997 | 860 | 79 | 58 | 15 | 4 | 13 |
| Iowa | 292 | 124 | 89 | 16 | 11 | 5 | 0 | 3 | 165 | 152 | 10 | 3 | 0 | 1 | 2 |
| Minnesota | 264 | 94 | 71 | 11 | 8 | 1 | 0 | 3 | 165 | 140 | 12 | 13 | 4 | 0 | 1 |
| Missouri | 1,025 | 609 | 411 | 115 | 49 | 22 | 0 | 12 | 397 | 344 | 22 | 31 | 11 | 3 | 5 |
| North Dakota | 37 | 11 | 8 | 0 | 2 | 0 | 0 | 1 | 24 | 20 | 4 | 0 | 0 | 0 | 2 |
| South Dakota | 42 | 20 | 16 | 2 | 0 | 1 | 0 | 1 | 22 | 20 | 2 | 0 | 0 | 0 | 0 |
| Nebraska | 174 | 96 | 66 | 12 | 9 | 5 | 1 | 3 | 77 | 65 | 9 | 3 | 0 | 0 | 1 |
| Kansas | 291 | 142 | 97 | 24 | 18 | 0 | 0 | 3 | 147 | 119 | 20 | 8 | 0 | 0 | 2 |
| South Atlantic | 3,177 | 1,814 | 1,372 | 235 | 133 | 39 | 3 | 32 | 1,341 | 1,209 | 79 | 53 | 2 | 4 | 16 |
| Delaware | 61 | 23 | 19 | 4 | 0 | 0 | 0 | 0 | 38 | 34 | 2 | 2 | 0 | 0 | 0 |
| Maryland | 384 | 166 | 113 | 28 | 18 | 2 | 1 | 4 | 215 | 198 | 9 | 8 | 0 | 1 | 2 |
| District of Columbia | 133 | 54 | 34 | 9 | 10 | 0 | 0 | 1 | 77 | 67 | 6 | 4 | 2 | 0 | 0 |
| Virginia | 330 | 176 | 148 | 20 | 6 | 0 | 1 | 1 | 152 | 132 | 16 | 4 | 0 | 0 | 2 |
| West Virginia | 325 | 210 | 125 | 54 | 20 | 9 | 0 | 2 | 115 | 98 | 8 | 9 | 0 | 0 | 0 |
| North Carolina | 383 | 237 | 220 | 13 | 2 | 0 | 1 | 1 | 143 | 131 | 5 | 7 | 0 | 0 | 3 |
| South Carolina | 177 | 109 | 98 | 11 | 0 | 0 | 0 | 0 | 66 | 62 | 3 | 1 | 0 | 1 | 1 |
| Georgia | 402 | 227 | 179 | 20 | 10 | 7 | 0 | 11 | 171 | 157 | 10 | 4 | 0 | 1 | 3 |
| Florida | 982 | 612 | 436 | 76 | 67 | 21 | 0 | 12 | 364 | 330 | 20 | 14 | 0 | 1 | 5 |
| East South Central | 1,750 | 1,026 | 772 | 133 | 76 | 27 | 1 | 17 | 706 | 627 | 58 | 21 | 0 | 4 | 14 |
| Kentucky | 360 | 204 | 129 | 28 | 26 | 15 | 0 | 6 | 154 | 136 | 14 | 4 | 0 | 0 | 2 |
| Tennessee | 678 | 391 | 308 | 48 | 23 | 5 | 0 | 7 | 276 | 242 | 25 | 9 | 0 | 1 | 10 |
| Alabama | 514 | 316 | 243 | 47 | 20 | 3 | 1 | 2 | 195 | 174 | 17 | 4 | 0 | 1 | 2 |
| Mississippi | 198 | 115 | 92 | 10 | 7 | 4 | 0 | 2 | 81 | 75 | 2 | 4 | 0 | 2 | 0 |
| West South Central | 2,537 | 1,522 | 1,028 | 279 | 119 | 69 | 0 | 27 | 979 | 862 | 55 | 62 | 0 | 16 | 20 |
| Arkansas | 251 | 135 | 113 | 13 | 4 | 4 | 0 | 1 | 115 | 101 | 4 | 10 | 0 | 0 | 1 |
| Louisiana | 448 | 260 | 169 | 51 | 24 | 11 | 0 | 5 | 184 | 168 | 9 | 7 | 0 | 3 | 1 |
| Oklahoma | 226 | 103 | 73 | 7 | 21 | 0 | 0 | 2 | 119 | 105 | 6 | 8 | 0 | 0 | 4 |
| Texas | 1,612 | 1,024 | 673 | 208 | 70 | 54 | 0 | 19 | 561 | 488 | 36 | 37 | 0 | 13 | 14 |
| Mountain | 1,430 | 823 | 602 | 112 | 53 | 22 | 2 | 32 | 586 | 479 | 82 | 25 | 9 | 3 | 9 |
| Montana | 138 | 84 | 73 | 7 | 0 | 1 | 0 | 3 | 45 | 31 | 11 | 3 | 6 | 0 | 3 |
| Idaho | 95 | 49 | 44 | 1 | 1 | 1 | 0 | 2 | 45 | 38 | 7 | 0 | 1 | 0 | 0 |
| Wyoming | 31 | 14 | 10 | 3 | 1 | 0 | 0 | 0 | 17 | 14 | 2 | 1 | 0 | 0 | 0 |
| Colorado | 459 | 268 | 195 | 40 | 22 | 5 | 1 | 5 | 186 | 150 | 26 | 10 | 2 | 2 | 1 |
| New Mexico | 183 | 125 | 73 | 21 | 12 | 10 | 0 | 9 | 55 | 45 | 8 | 2 | 0 | 0 | 3 |
| Arizona | 218 | 103 | 73 | 12 | 10 | 3 | 0 | 5 | 114 | 92 | 17 | 5 | 0 | 0 | 1 |
| Utah | 113 | 53 | 43 | 9 | 1 | 0 | 0 | 0 | 59 | 54 | 2 | 3 | 0 | 0 | 1 |
| Nevada | 193 | 127 | 91 | 19 | 6 | 2 | 1 | 8 | 65 | 55 | 9 | 1 | 0 | 1 | 0 |
| Pacific | 5,035 | 2,587 | 1,550 | 628 | 269 | 59 | 17 | 64 | 2,376 | 1,991 | 257 | 128 | 29 | 13 | 30 |
| Washington | 839 | 301 | 177 | 73 | 34 | 8 | 2 | 7 | 527 | 475 | 31 | 21 | 4 | 0 | 7 |
| Oregon | 389 | 194 | 124 | 33 | 31 | 4 | 0 | 2 | 181 | 110 | 55 | 16 | 8 | 3 | 3 |
| California | 3,509 | 1,946 | 1,153 | 480 | 199 | 45 | 15 | 54 | 1,522 | 1,274 | 165 | 83 | 16 | 9 | 16 |
| Alaska | 80 | 48 | 34 | 13 | 1 | 0 | 0 | 0 | 31 | 26 | 1 | 4 | 0 | 0 | 1 |
| Hawaii | 218 | 98 | 62 | 29 | 4 | 2 | 0 | 1 | 115 | 106 | 5 | 4 | 1 | 1 | 3 |
| Outlying areas | 554 | 249 | 176 | 64 | 8 | 0 | 0 | 1 | 292 | 268 | 10 | 14 | 7 | 2 | 4 |
| Puerto Rico | 533 | 239 | 166 | 64 | 8 | 0 | 0 | 1 | 282 | 259 | 9 | 14 | 6 | 2 | 4 |
| Virgin Islands | 21 | 10 | 10 | 0 | 0 | 0 | 0 | 0 | 10 | 9 | 1 | 0 | 1 | 0 | 0 |
- 1 See "Glossary" for definitions of terms.
- 2 The States are grouped according to the method used by the Bureau of the Census, U.S. Department of Commerce.
810 of 810 figures sit in a row or column sum that works out.
Reader’s notes
p. 239. The crop ends immediately below the "South Atlantic" division subtotal line; the table continues on the following page(s) with the South Atlantic States and the remaining divisions, so the body here is partial. No footnote texts appear on this crop, although two markers are present: a raised 1 on the caption (excluded per instructions) and a raised 2 on the stub heading "Division and State". Columns 13-15 carry a two-deck heading: the word headings "Union deauthorization cases", "Amendment of certification cases" and "Unit clarification cases" occupy the upper two header levels, with the case-type abbreviations UD, AC and UC printed on their own line beneath; the word headings are therefore repeated in the first two header rows. Doubtful glyphs, both resolved by arithmetic and reported as read: (1) Illinois, AC column - the digit is smudged/broken at the top and could be mistaken for a lowercase p or 9, but it is an 8 (1,698 - 1,150 - 513 - 11 - 16 = 8, and the East North Central AC subtotal 6+4+8+1+3 = 22 as printed). (2) Wisconsin, UD column - the figure sits close to Michigan's 2 on the line above; it is 0 (274 + 258 + 0 + 3 + 14 = 549 as printed, and the East North Central UD subtotal 6+3+11+2+0 = 22 as printed). Every division subtotal, the grand total row, and the component columns (CA-CP summing to All C cases; RC-RD summing to All R cases; All C + All R + UD + AC + UC summing to All cases) were checked and all reconcile exactly as printed. No misprints were found. A small ink speck sits just below "1,341" in the South Atlantic row (All R cases column); it is page dirt, not a footnote marker or decimal point.
p. 240. Continuation page: no column headings are printed on this crop, so header_rows is empty. The grid has a stub plus 15 numeric columns (column rules counted at the top of the body). The first nine rows (Delaware through Florida) are the tail of a regional group whose group label and group-total row (South Atlantic) fall on the preceding page; they are therefore printed without a preceding section line here. The group-total rows that do appear (East South Central, West South Central, Mountain, Pacific, Outlying areas) are printed above their member States, in the same position the crop shows. The three rightmost columns are set very narrow and their digits sit close together and somewhat faintly, so they were the hardest part of the read. I checked every row against the internal arithmetic of the table: column 1 = column 2 + column 9 + columns 13+14+15; column 2 = sum of columns 3-8; column 9 = sum of columns 10-12; and each group-total row = the sum of its member States column by column. All of those checks pass for every row and every column as transcribed, which pins down the narrow right-hand columns for the East South Central, West South Central, Mountain, Pacific and Outlying-areas blocks. Two caveats on cells where the printing alone was not decisive: - Colorado and New Mexico, columns 14 and 15: the Mountain group totals and the row totals admit two splits (Colorado 2 / 1 with New Mexico 0 / 3, as transcribed, or Colorado 0 / 3 with New Mexico 2 / 1). I read the "2" as sitting on the Colorado line and chose that split; the two cells in each of these rows are the least certain numbers in the table. - Delaware through Florida, columns 13-15: this block has no group-total row on the crop, so those cells could only be checked against each row's own total (column 1). Each row as transcribed reconciles exactly, but the column sums could not be independently verified. Stray marks, not transcribed: a small ink speck in the leader dots after "East South Central" and another after "West South Central" (neither is a footnote marker), and a comma-like speck in the Louisiana row between columns 12 and 13. No printed total appears to be in error; nothing was computed, rounded or corrected.
Source image
Source data: U.S. NLRB Annual Reports (public domain). Reconstruction by NLRB Stats Archive. Read by claude-opus-5 (effort max, prompt extract_v1) from the 300-dpi scan; stitched by page. Updated October 2026.