NLRB Stats Archive › Annual Reports › FY1967 › Industrial Distribution of Cases Received, Fiscal Year 1967
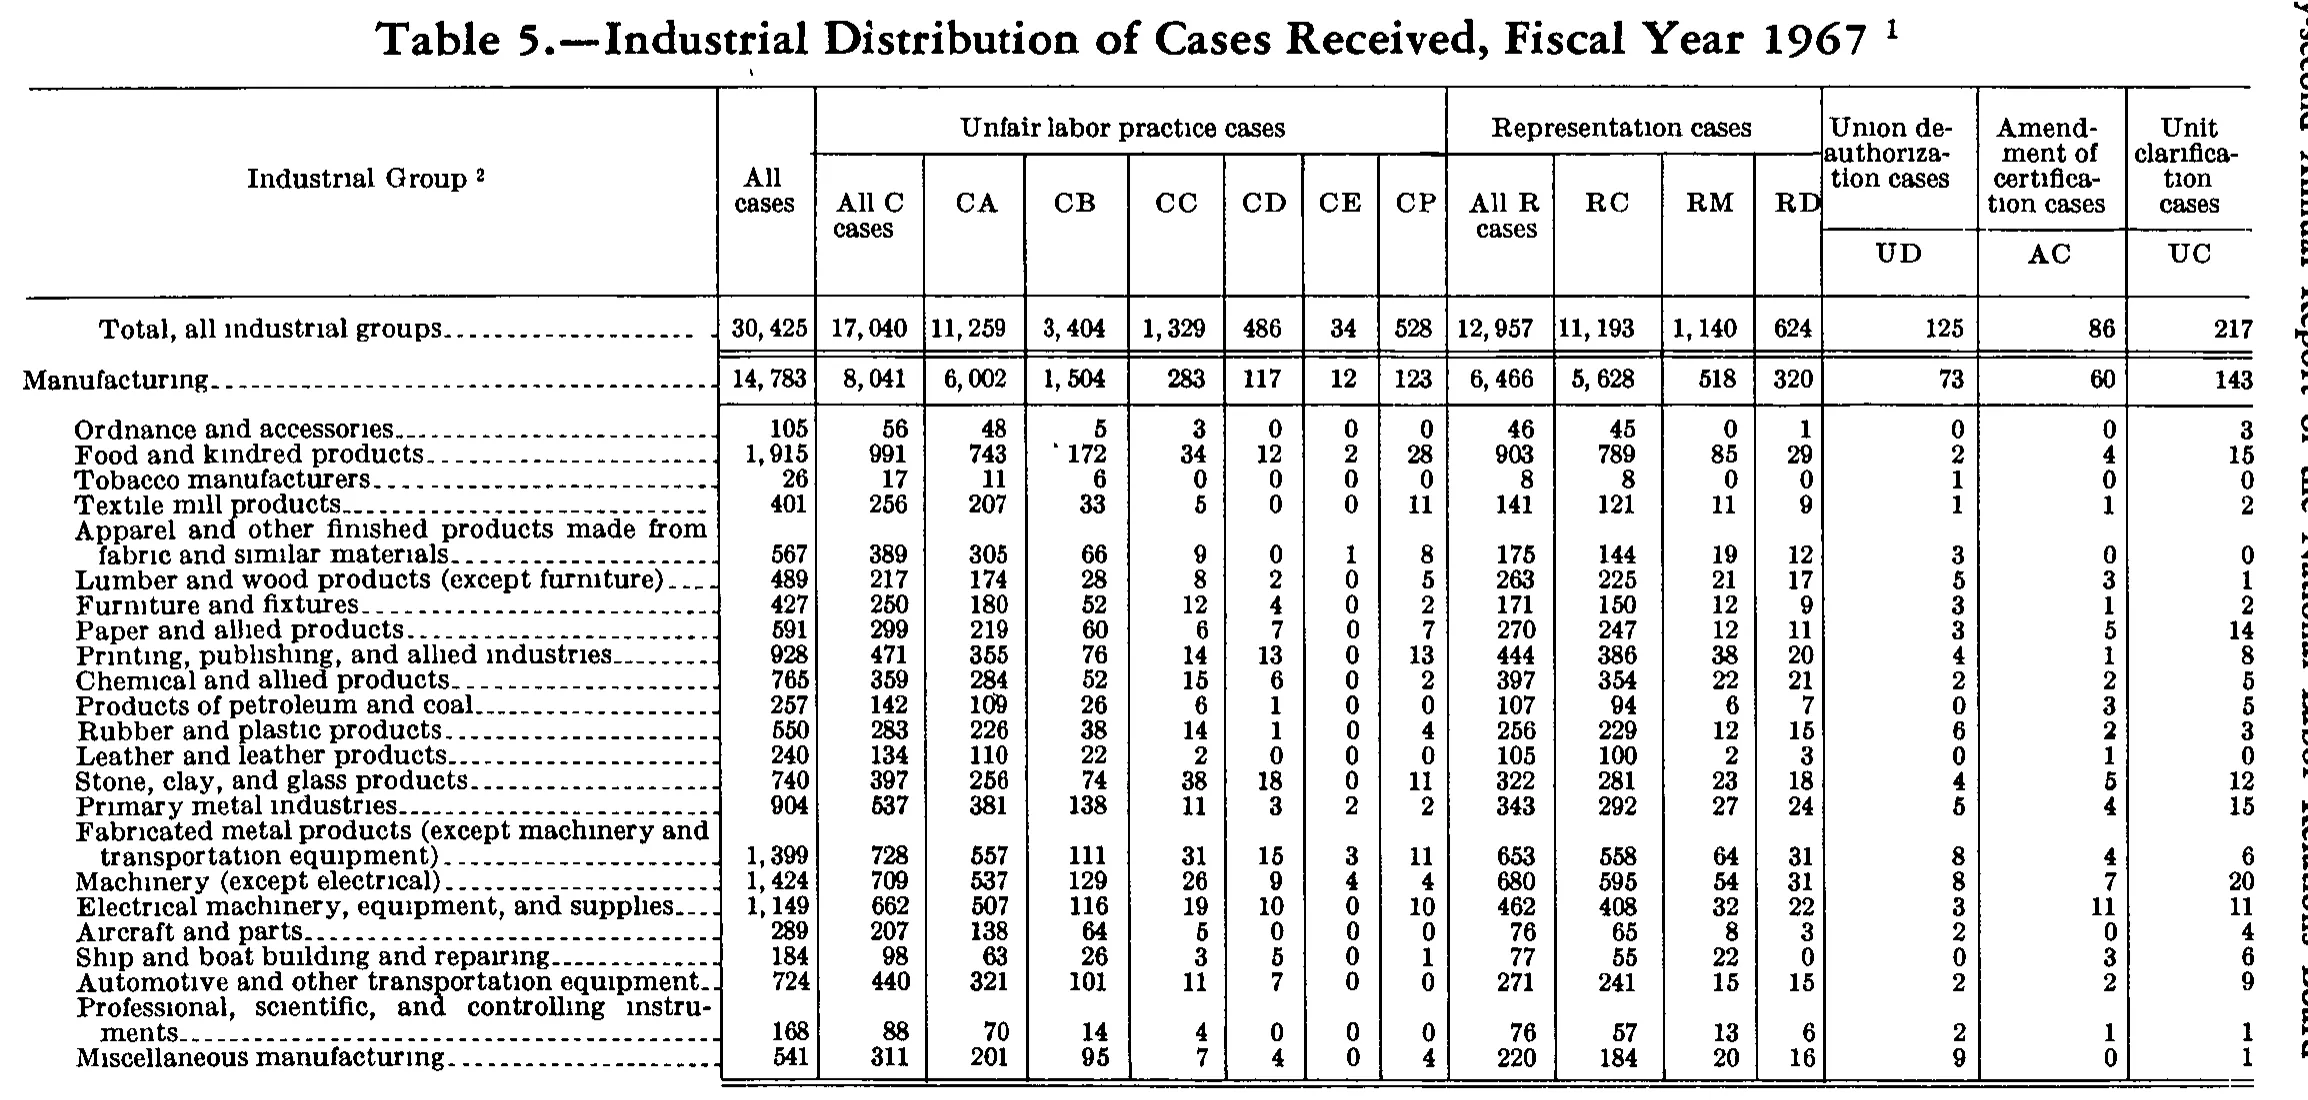
Industrial Distribution of Cases Received, Fiscal Year 1967
Stitched from pp. 237–238.
| Industrial Group | All cases | Unfair labor practice cases | Representation cases | Union deauthorization cases | Amendment of certification cases | Unit clarification cases | |||||||||
|---|---|---|---|---|---|---|---|---|---|---|---|---|---|---|---|
| Industrial Group | All cases | All C cases | CA | CB | CC | CD | CE | CP | All R cases | RC | RM | RD | Union deauthorization cases | Amendment of certification cases | Unit clarification cases |
| Industrial Group | All cases | All C cases | CA | CB | CC | CD | CE | CP | All R cases | RC | RM | RD | UD | AC | UC |
| Total, all industrial groups | 30,425 | 17,040 | 11,259 | 3,404 | 1,329 | 486 | 34 | 528 | 12,957 | 11,193 | 1,140 | 624 | 125 | 86 | 217 |
| Manufacturing | 14,783 | 8,041 | 6,002 | 1,504 | 283 | 117 | 12 | 123 | 6,466 | 5,628 | 518 | 320 | 73 | 60 | 143 |
| Ordnance and accessories | 105 | 56 | 48 | 5 | 3 | 0 | 0 | 0 | 46 | 45 | 0 | 1 | 0 | 0 | 3 |
| Food and kindred products | 1,915 | 991 | 743 | 172 | 34 | 12 | 2 | 28 | 903 | 789 | 85 | 29 | 2 | 4 | 15 |
| Tobacco manufacturers | 26 | 17 | 11 | 6 | 0 | 0 | 0 | 0 | 8 | 8 | 0 | 0 | 1 | 0 | 0 |
| Textile mill products | 401 | 256 | 207 | 33 | 5 | 0 | 0 | 11 | 141 | 121 | 11 | 9 | 1 | 1 | 2 |
| Apparel and other finished products made from fabric and similar materials | 567 | 389 | 305 | 66 | 9 | 0 | 1 | 8 | 175 | 144 | 19 | 12 | 3 | 0 | 0 |
| Lumber and wood products (except furniture) | 489 | 217 | 174 | 28 | 8 | 2 | 0 | 5 | 263 | 225 | 21 | 17 | 5 | 3 | 1 |
| Furniture and fixtures | 427 | 250 | 180 | 52 | 12 | 4 | 0 | 2 | 171 | 150 | 12 | 9 | 3 | 1 | 2 |
| Paper and allied products | 591 | 299 | 219 | 60 | 6 | 7 | 0 | 7 | 270 | 247 | 12 | 11 | 3 | 5 | 14 |
| Printing, publishing, and allied industries | 928 | 471 | 355 | 76 | 14 | 13 | 0 | 13 | 444 | 386 | 38 | 20 | 4 | 1 | 8 |
| Chemical and allied products | 765 | 359 | 284 | 52 | 15 | 6 | 0 | 2 | 397 | 354 | 22 | 21 | 2 | 2 | 5 |
| Products of petroleum and coal | 257 | 142 | 109 | 26 | 6 | 1 | 0 | 0 | 107 | 94 | 6 | 7 | 0 | 3 | 5 |
| Rubber and plastic products | 550 | 283 | 226 | 38 | 14 | 1 | 0 | 4 | 256 | 229 | 12 | 15 | 6 | 2 | 3 |
| Leather and leather products | 240 | 134 | 110 | 22 | 2 | 0 | 0 | 0 | 105 | 100 | 2 | 3 | 0 | 1 | 0 |
| Stone, clay, and glass products | 740 | 397 | 256 | 74 | 38 | 18 | 0 | 11 | 322 | 281 | 23 | 18 | 4 | 5 | 12 |
| Primary metal industries | 904 | 537 | 381 | 138 | 11 | 3 | 2 | 2 | 343 | 292 | 27 | 24 | 5 | 4 | 15 |
| Fabricated metal products (except machinery and transportation equipment) | 1,399 | 728 | 557 | 111 | 31 | 15 | 3 | 11 | 653 | 558 | 64 | 31 | 8 | 4 | 6 |
| Machinery (except electrical) | 1,424 | 709 | 537 | 129 | 26 | 9 | 4 | 4 | 680 | 595 | 54 | 31 | 8 | 7 | 20 |
| Electrical machinery, equipment, and supplies | 1,149 | 662 | 507 | 116 | 19 | 10 | 0 | 10 | 462 | 408 | 32 | 22 | 3 | 11 | 11 |
| Aircraft and parts | 289 | 207 | 138 | 64 | 5 | 0 | 0 | 0 | 76 | 65 | 8 | 3 | 2 | 0 | 4 |
| Ship and boat building and repairing | 184 | 98 | 63 | 26 | 3 | 5 | 0 | 1 | 77 | 55 | 22 | 0 | 0 | 3 | 6 |
| Automotive and other transportation equipment | 724 | 440 | 321 | 101 | 11 | 7 | 0 | 0 | 271 | 241 | 15 | 15 | 2 | 2 | 9 |
| Professional, scientific, and controlling instruments | 168 | 88 | 70 | 14 | 4 | 0 | 0 | 0 | 76 | 57 | 13 | 6 | 2 | 1 | 1 |
| Miscellaneous manufacturing | 541 | 311 | 201 | 95 | 7 | 4 | 0 | 4 | 220 | 184 | 20 | 16 | 9 | 0 | 1 |
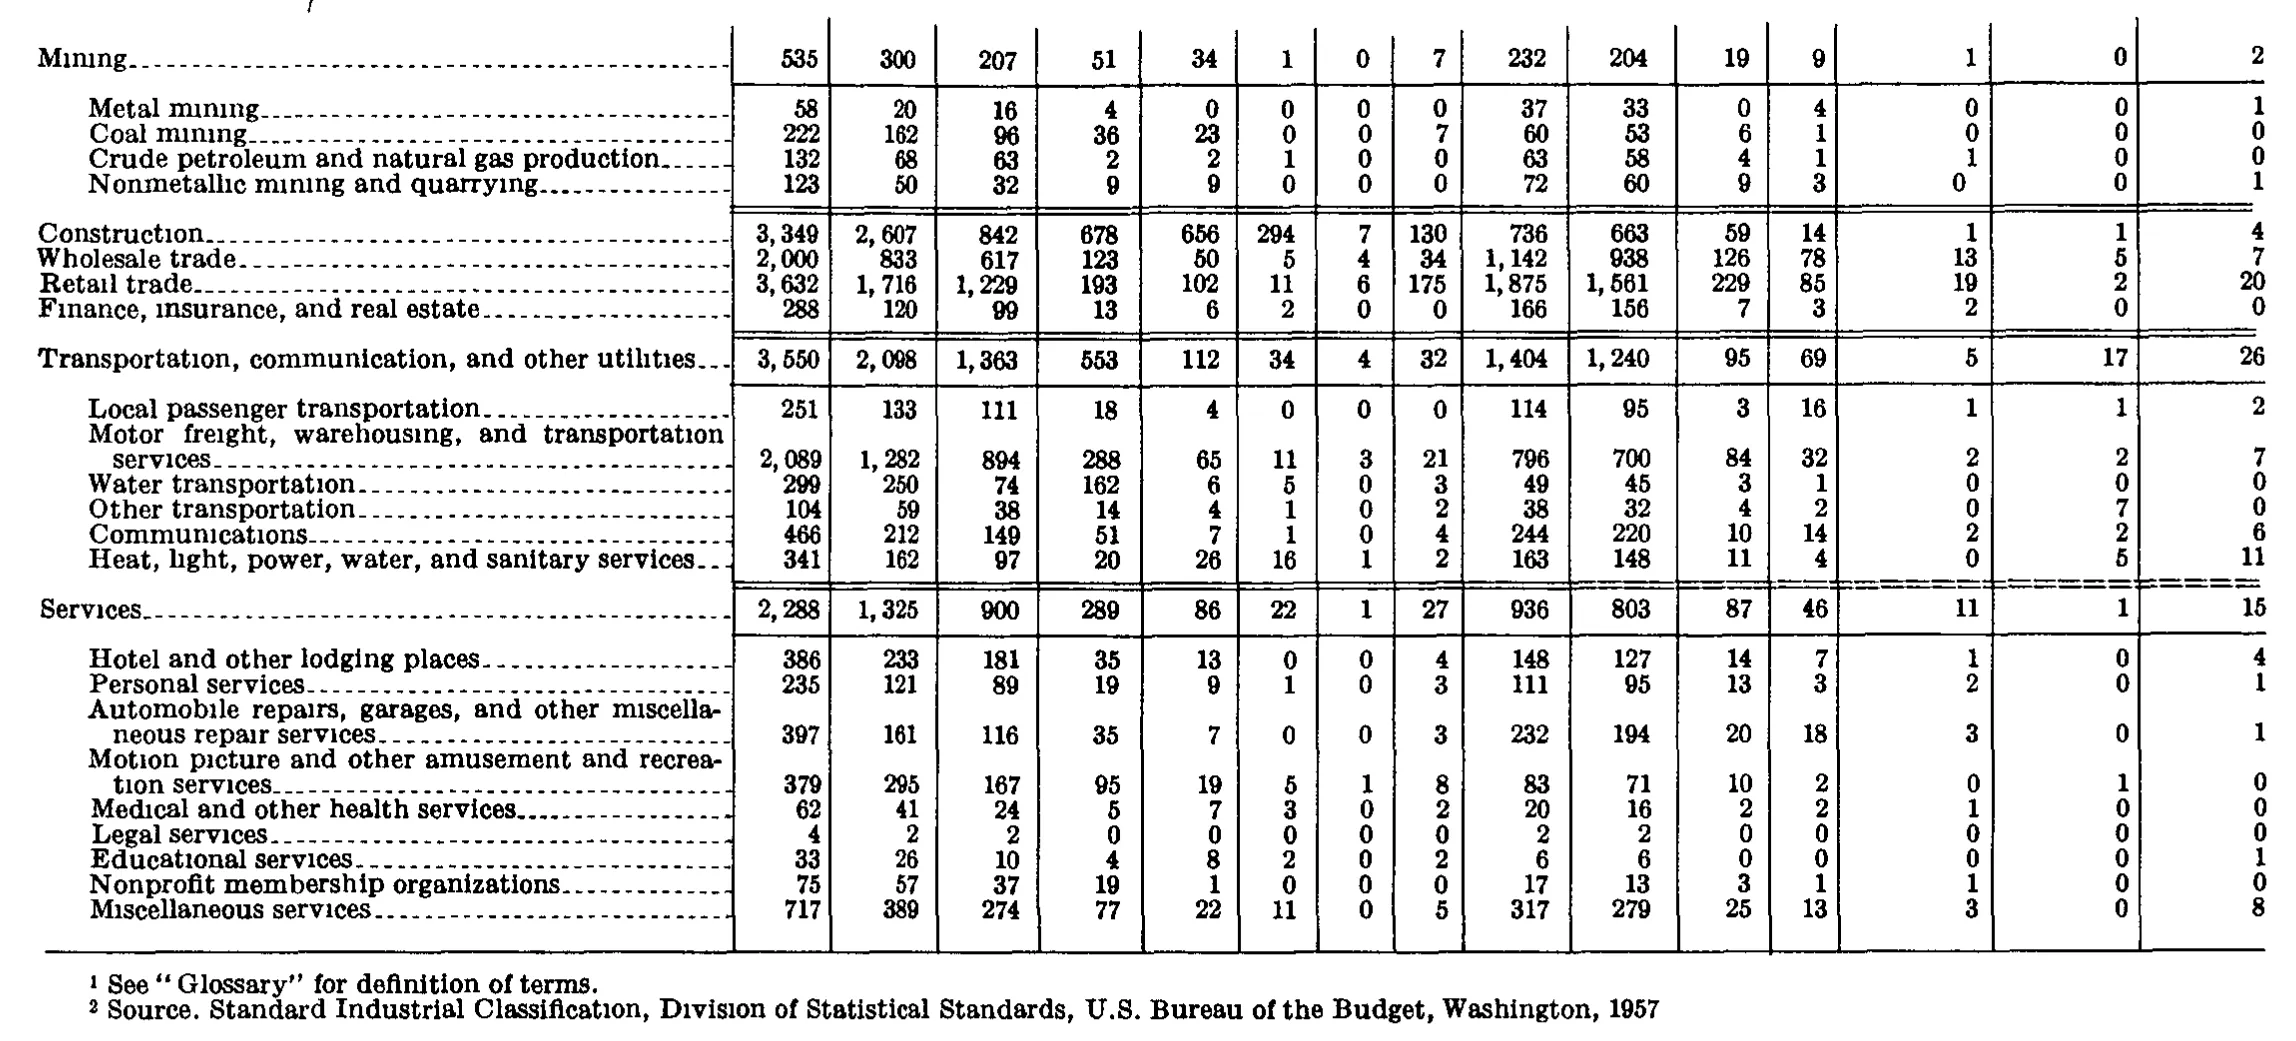
| Mining | 535 | 300 | 207 | 51 | 34 | 1 | 0 | 7 | 232 | 204 | 19 | 9 | 1 | 0 | 2 |
| Metal mining | 58 | 20 | 16 | 4 | 0 | 0 | 0 | 0 | 37 | 33 | 0 | 4 | 0 | 0 | 1 |
| Coal mining | 222 | 162 | 96 | 36 | 23 | 0 | 0 | 7 | 60 | 53 | 6 | 1 | 0 | 0 | 0 |
| Crude petroleum and natural gas production | 132 | 68 | 63 | 2 | 2 | 1 | 0 | 0 | 63 | 58 | 4 | 1 | 1 | 0 | 0 |
| Nonmetallic mining and quarrying | 123 | 50 | 32 | 9 | 9 | 0 | 0 | 0 | 72 | 60 | 9 | 3 | 0 | 0 | 1 |
| Construction | 3,349 | 2,607 | 842 | 678 | 656 | 294 | 7 | 130 | 736 | 663 | 59 | 14 | 1 | 1 | 4 |
| Wholesale trade | 2,000 | 833 | 617 | 123 | 50 | 5 | 4 | 34 | 1,142 | 938 | 126 | 78 | 13 | 5 | 7 |
| Retail trade | 3,632 | 1,716 | 1,229 | 193 | 102 | 11 | 6 | 175 | 1,875 | 1,561 | 229 | 85 | 19 | 2 | 20 |
| Finance, insurance, and real estate | 288 | 120 | 99 | 13 | 6 | 2 | 0 | 0 | 166 | 156 | 7 | 3 | 2 | 0 | 0 |
| Transportation, communication, and other utilities | 3,550 | 2,098 | 1,363 | 553 | 112 | 34 | 4 | 32 | 1,404 | 1,240 | 95 | 69 | 5 | 17 | 26 |
| Local passenger transportation | 251 | 133 | 111 | 18 | 4 | 0 | 0 | 0 | 114 | 95 | 3 | 16 | 1 | 1 | 2 |
| Motor freight, warehousing, and transportation services | 2,089 | 1,282 | 894 | 288 | 65 | 11 | 3 | 21 | 796 | 700 | 84 | 32 | 2 | 2 | 7 |
| Water transportation | 299 | 250 | 74 | 162 | 6 | 5 | 0 | 3 | 49 | 45 | 3 | 1 | 0 | 0 | 0 |
| Other transportation | 104 | 59 | 38 | 14 | 4 | 1 | 0 | 2 | 38 | 32 | 4 | 2 | 0 | 7 | 0 |
| Communications | 466 | 212 | 149 | 51 | 7 | 1 | 0 | 4 | 244 | 220 | 10 | 14 | 2 | 2 | 6 |
| Heat, light, power, water, and sanitary services | 341 | 162 | 97 | 20 | 26 | 16 | 1 | 2 | 163 | 148 | 11 | 4 | 0 | 5 | 11 |
| Services | 2,288 | 1,325 | 900 | 289 | 86 | 22 | 1 | 27 | 936 | 803 | 87 | 46 | 11 | 1 | 15 |
| Hotel and other lodging places | 386 | 233 | 181 | 35 | 13 | 0 | 0 | 4 | 148 | 127 | 14 | 7 | 1 | 0 | 4 |
| Personal services | 235 | 121 | 89 | 19 | 9 | 1 | 0 | 3 | 111 | 95 | 13 | 3 | 2 | 0 | 1 |
| Automobile repairs, garages, and other miscellaneous repair services | 397 | 161 | 116 | 35 | 7 | 0 | 0 | 3 | 232 | 194 | 20 | 18 | 3 | 0 | 1 |
| Motion picture and other amusement and recreation services | 379 | 295 | 167 | 95 | 19 | 5 | 1 | 8 | 83 | 71 | 10 | 2 | 0 | 1 | 0 |
| Medical and other health services | 62 | 41 | 24 | 5 | 7 | 3 | 0 | 2 | 20 | 16 | 2 | 2 | 1 | 0 | 0 |
| Legal services | 4 | 2 | 2 | 0 | 0 | 0 | 0 | 0 | 2 | 2 | 0 | 0 | 0 | 0 | 0 |
| Educational services | 33 | 26 | 10 | 4 | 8 | 2 | 0 | 2 | 6 | 6 | 0 | 0 | 0 | 0 | 1 |
| Nonprofit membership organizations | 75 | 57 | 37 | 19 | 1 | 0 | 0 | 0 | 17 | 13 | 3 | 1 | 1 | 0 | 0 |
| Miscellaneous services | 717 | 389 | 274 | 77 | 22 | 11 | 0 | 5 | 317 | 279 | 25 | 13 | 3 | 0 | 8 |
- 1 See "Glossary" for definition of terms.
- 2 Source. Standard Industrial Classification, Division of Statistical Standards, U.S. Bureau of the Budget, Washington, 1957
641 of 642 figures sit in a row or column sum that works out. 2 cells break a sum: 'Motor freight, warehousing, an', column 10: prints 796, columns 11 to 13 add to 816; 'Transportation, communication,', column 12: prints 95, rows 'Local passenger tran' to 'Heat, light, power, ' add to 115.
Reader’s notes
p. 237. The table has 16 columns and three heading levels. "Industrial Group^2" (stub) and "All cases" are tall headings spanning all three levels; "Unfair labor practice cases" spans the 7 columns All C cases through CP, and "Representation cases" spans All R cases through RD. The last three spanner headings ("Union deauthorization cases", "Amendment of certification cases", "Unit clarification cases") occupy levels 1-2 with their symbols UD, AC, UC printed on level 3; the other second-level headings (All C cases, CA, ... RD) have no separate third-level entry and so are repeated down into level 3. Footnote markers 1 (on the caption) and 2 (on the stub heading "Industrial Group") are printed, but the footnote texts do not appear on this crop; the table ends in a double rule with no footnote block, so `footnotes` is empty. The marker 1 belongs to the caption, which is excluded per instructions. The crop ends after "Miscellaneous manufacturing": this is only the Manufacturing portion of the table, which continues on the following page with the Nonmanufacturing groups. The printed "Total, all industrial groups" line therefore exceeds the sum of the rows shown here, as expected. In the "Food and kindred products" row, CB column, there is a small stray ink mark immediately before 172 (an apostrophe-like speck at the top-left of the digit group). It is not a footnote marker or a digit and sits above the baseline in the leading whitespace; the value is transcribed as 172. This reading is confirmed by arithmetic: the CB column sums to the printed Manufacturing total of 1,504 only with 172. All arithmetic was cross-checked and is internally consistent: for every one of the 23 industry rows, CA+CB+CC+CD+CE+CP = All C cases, RC+RM+RD = All R cases, and All C + All R + UD + AC + UC = All cases. In addition, all 15 numeric columns sum across the 23 industry rows exactly to the printed "Manufacturing" line. No misprints were detected. The scan renders dotted i's faintly in several row labels and headings (e.g. "Unfair labor practice cases", "Representation cases", "Primary metal industries"), an artifact of the bitonal scan rather than the typesetting; readings are unambiguous.
p. 238. No column headings are printed on this crop: it is the continuation page of a table begun earlier (an industrial-distribution-of-cases table), so header_rows is empty. The grid has 16 columns (stub plus 15 numeric columns), counted from the vertical rules; the three rightmost numeric columns are visibly wider than the rest, each holding a single right-aligned figure per row. Doubtful cell: "Motor freight, warehousing, and transportation services", numeric column 11 (the third column of the right-hand four-column block, i.e. the one whose section total on the "Transportation, communication, and other utilities" line is 95). I read the glyphs as 84 and transcribed them as printed, but two independent arithmetic checks point to 64 instead: the row's own block total 796 = 700 + 64 + 32, and the column adds to 95 only with 64 (3 + 64 + 3 + 4 + 10 + 11). This is a 1-bit scan where 6 and 8 can blur, so treat the cell as uncertain. Every other value in the crop is internally consistent: each row's first numeric column equals the sum of its block totals plus the last three columns, each block total equals the sum of its components, and each industry division's figures equal the sum of the indented subdivisions printed beneath it (Mining, Transportation, and Services all reconcile in all 15 columns). The crop's upper-left corner carries a small stray pen or scanning mark above the stub; it is not table content. Horizontal rules separating the divisions print as doubled or dashed lines in places (notably between "Heat, light, power, water, and sanitary services" and "Services") but carry no data. The two footnote markers are printed only under the table; no raised markers are attached to any row label or value in this crop.
Source image
Source data: U.S. NLRB Annual Reports (public domain). Reconstruction by NLRB Stats Archive. Read by claude-opus-5 (effort max, prompt extract_v1) from the 300-dpi scan; stitched by page. Updated October 2026.