NLRB Stats Archive › Annual Reports › FY1967 › Decisions issued
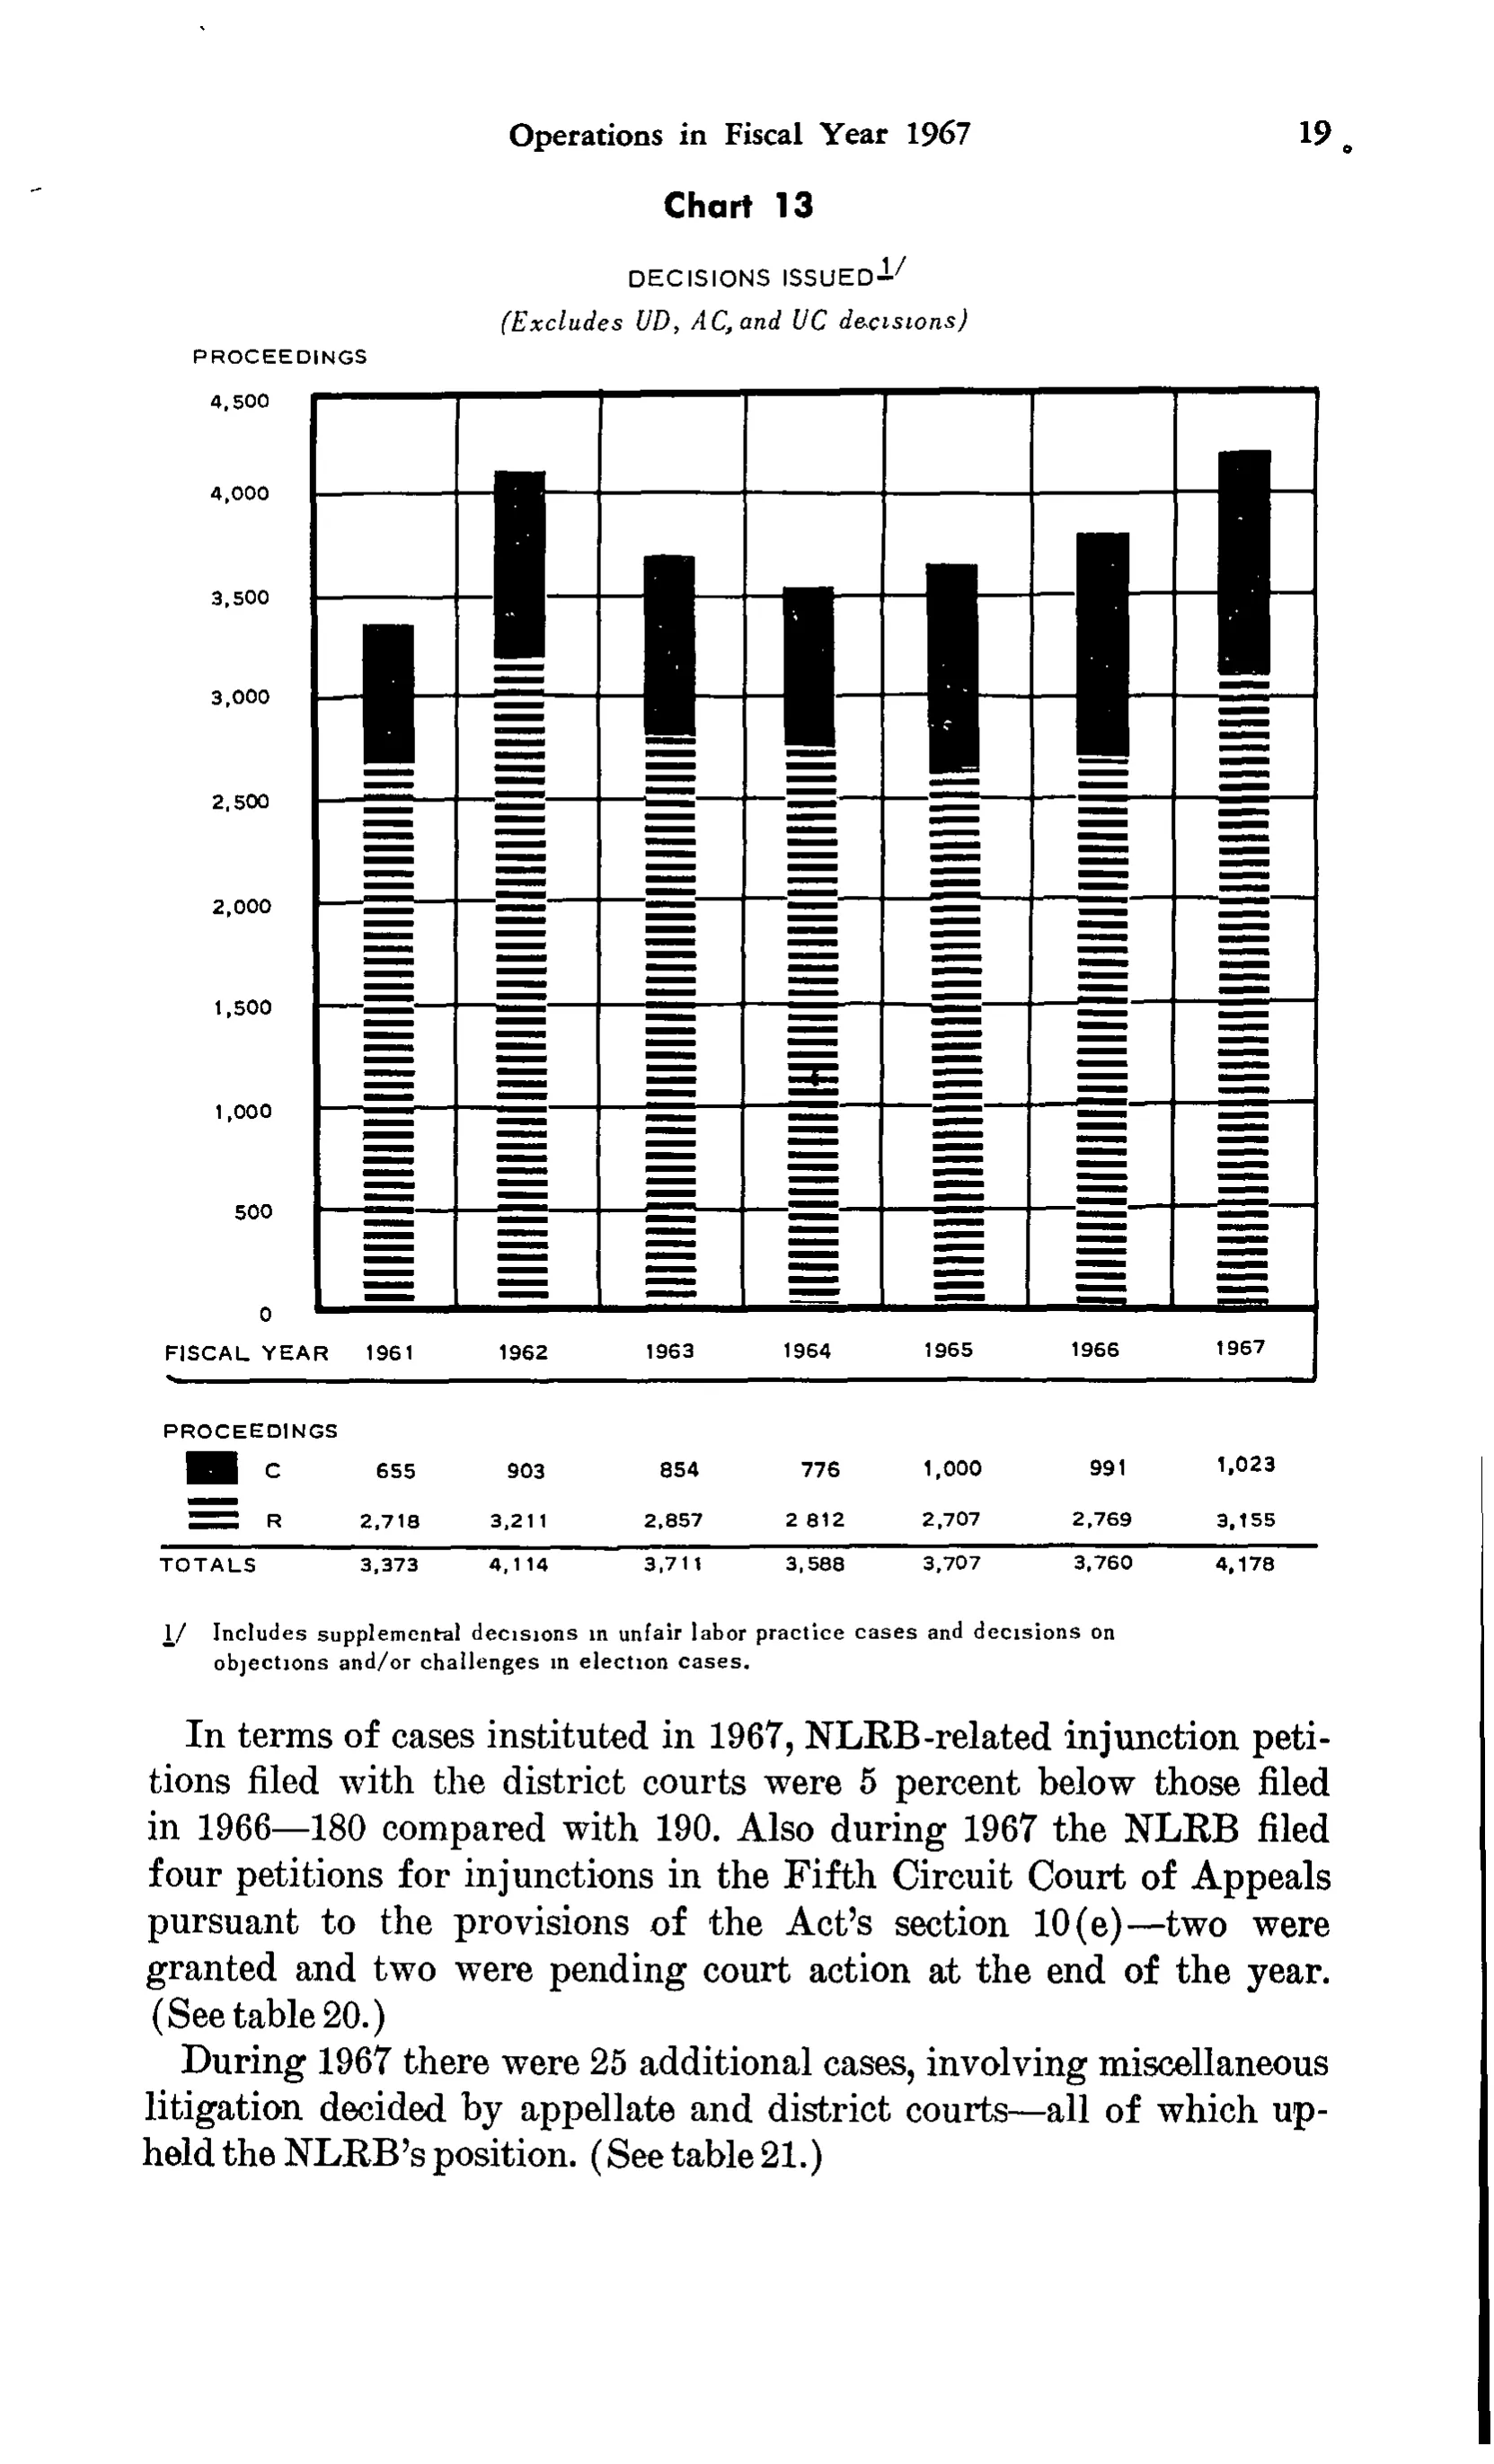
Decisions issued
| FISCAL YEAR | 1961 | 1962 | 1963 | 1964 | 1965 | 1966 | 1967 |
|---|---|---|---|---|---|---|---|
| PROCEEDINGS | |||||||
| C | 655 | 903 | 854 | 776 | 1,000 | 991 | 1,023 |
| R | 2,718 | 3,211 | 2,857 | 2,812 | 2,707 | 2,769 | 3,155 |
| TOTALS | 3,373 | 4,114 | 3,711 | 3,588 | 3,707 | 3,760 | 4,178 |
- 1/ Includes supplemental decisions in unfair labor practice cases and decisions on objections and/or challenges in election cases.
21 of 21 figures sit in a row or column sum that works out.
Reader’s notes
p. 32. The crop is a bar chart (Chart 13, \"DECISIONS ISSUED\"), not a conventional table; what is transcribed is the data/legend panel printed below the plot, whose columns align with the fiscal-year categories on the chart's x-axis. The heading row \"FISCAL YEAR 1961 ... 1967\" is the axis label line directly above that panel and serves as its column headings.\n\nIn the printed panel the stub entries \"C\" and \"R\" are each preceded by a legend key (a solid black swatch for C, a horizontally striped swatch for R); the swatches are graphics and are not transcribed. \"PROCEEDINGS\" is printed alone over the stub column above the C/R lines and is carried as a label-only section row; it also appears separately as the y-axis unit label at the top left of the plot.\n\nRow R, column 1964: printed as \"2 812\" with no visible comma (the other cells in the row all show digit-grouping commas); transcribed as \"2,812\". The printed TOTALS confirm this reading — 776 + 2,812 = 3,588 as printed — and every other column's C + R likewise equals the printed TOTALS.\n\nThe chart's y-axis scale values (0, 500, 1,000 ... 4,500) and the bar graphics are part of the chart, not of the data panel, and are not transcribed. The caption (\"Chart 13\", \"DECISIONS ISSUED 1/\", \"(Excludes UD, AC, and UC decisions)\"), the running head and page number, and the body text below the footnote are excluded.
Source image
Source data: U.S. NLRB Annual Reports (public domain). Reconstruction by NLRB Stats Archive. Read by claude-opus-5 (effort max, prompt extract_v1) from the 300-dpi scan; stitched by page. Updated October 2026.