NLRB Stats Archive › Annual Reports › FY1967 › Unfair labor practice merit factor
Unfair labor practice merit factor
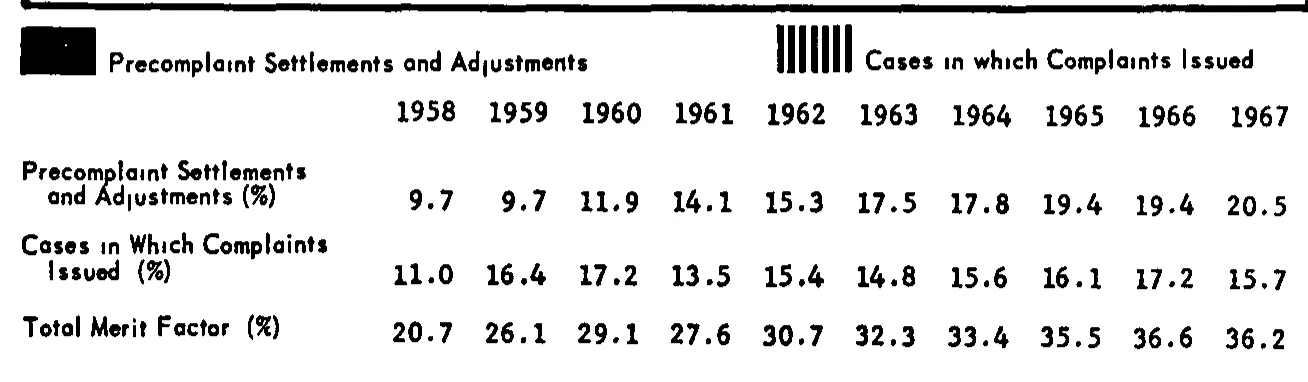
| 1958 | 1959 | 1960 | 1961 | 1962 | 1963 | 1964 | 1965 | 1966 | 1967 | |
|---|---|---|---|---|---|---|---|---|---|---|
| Precomplaint Settlements and Adjustments (%) | 9.7 | 9.7 | 11.9 | 14.1 | 15.3 | 17.5 | 17.8 | 19.4 | 19.4 | 20.5 |
| Cases in Which Complaints Issued (%) | 11.0 | 16.4 | 17.2 | 13.5 | 15.4 | 14.8 | 15.6 | 16.1 | 17.2 | 15.7 |
| Total Merit Factor (%) | 20.7 | 26.1 | 29.1 | 27.6 | 30.7 | 32.3 | 33.4 | 35.5 | 36.6 | 36.2 |
Reader’s notes
p. 22. This crop is the data panel printed beneath a bar chart; the chart itself is cut off above (only the bottom rule of the chart area shows at the top of the image). The line above the year headings is the chart's legend, not a column heading: a solid black swatch labelled "Precomplaint Settlements and Adjustments" and a vertically hatched swatch labelled "Cases in which Complaints Issued". It applies to the chart as a whole rather than to any column, so it is not included in header_rows or rows. The stub column has no printed heading. The scan renders the dotted "i" in several words faintly (e.g. "Adjustments", "in which", "Issued"); wording transcribed as intended. All three value rows are internally consistent (row 1 + row 2 = row 3 in every year column), which supports the digit readings.
Source image
Source data: U.S. NLRB Annual Reports (public domain). Reconstruction by NLRB Stats Archive. Read by claude-opus-5 (effort max, prompt extract_v1) from the 300-dpi scan; stitched by page. Updated October 2026.