NLRB Stats Archive › Annual Reports › FY1967 › ULP case intake by charges and situations filed
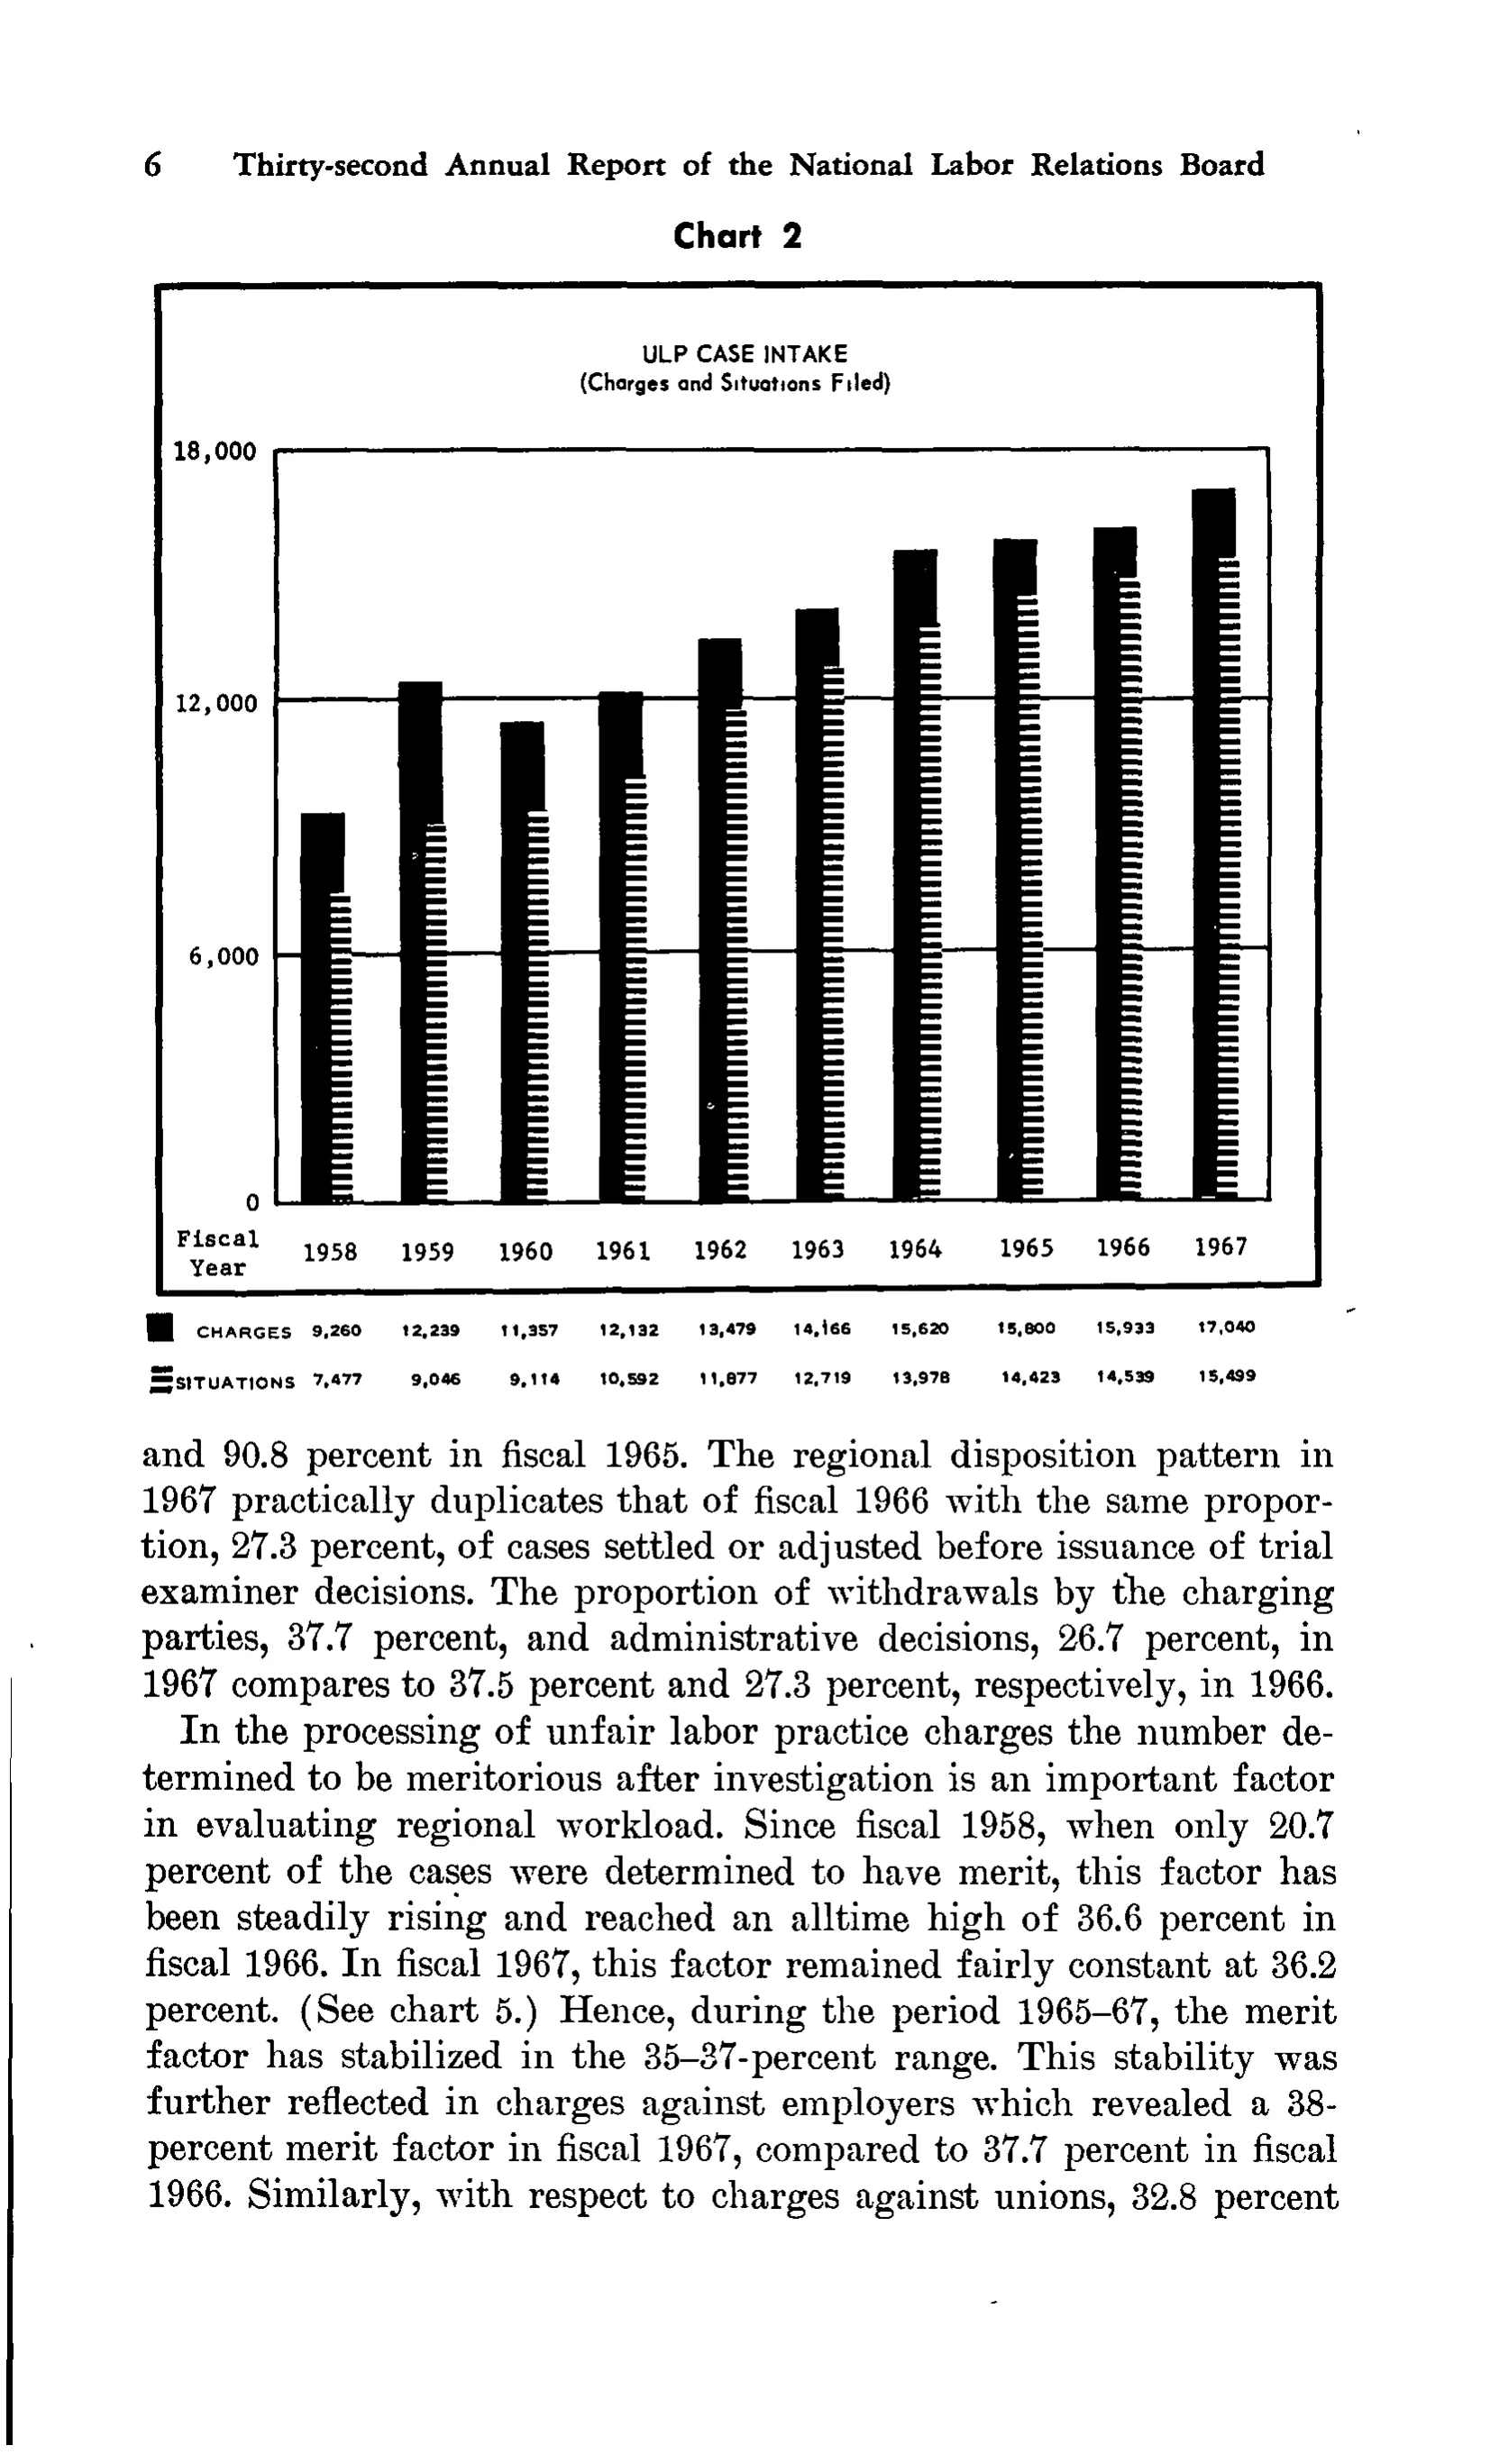
ULP case intake by charges and situations filed
| Fiscal Year | 1958 | 1959 | 1960 | 1961 | 1962 | 1963 | 1964 | 1965 | 1966 | 1967 |
|---|---|---|---|---|---|---|---|---|---|---|
| CHARGES | 9,260 | 12,239 | 11,357 | 12,132 | 13,479 | 14,166 | 15,620 | 15,800 | 15,933 | 17,040 |
| SITUATIONS | 7,477 | 9,046 | 9,114 | 10,592 | 11,877 | 12,719 | 13,978 | 14,423 | 14,539 | 15,499 |
0 of 20 figures sit in a row or column sum that works out.
Reader’s notes
p. 19. The crop is a bar chart (captioned "Chart 2", titled "ULP CASE INTAKE (Charges and Situations Filed)"), not a ruled table. The only tabulated numbers are the data legend printed beneath the plot: a row of fiscal years 1958-1967 on the x-axis (labelled "Fiscal Year" at the left), and two series rows, CHARGES (solid bars) and SITUATIONS (hatched bars), each with one value per year. Those are what is transcribed here; the series names are printed in capitals next to their legend swatches, and the swatches themselves are not transcribed. The y-axis gridline labels (18,000 / 12,000 / 6,000 / 0) are part of the chart scale, not data cells, so they are omitted. Every value was cross-checked against the corresponding bar height on the 0-18,000 scale and all ten pairs agree. One doubtful cell: CHARGES under 1963 prints with a damaged first digit after the comma and reads as either "14,166" or "14,i66"; the bar height (~14,17x on the scale) supports 14,166, which is what is entered. Page body text below the chart and the running head are excluded.
Source image
Source data: U.S. NLRB Annual Reports (public domain). Reconstruction by NLRB Stats Archive. Read by claude-opus-5 (effort max, prompt extract_v1) from the 300-dpi scan; stitched by page. Updated October 2026.