NLRB Stats Archive › Annual Reports › FY1966 › Distribution of Unfair Labor Practice Situations Received, by Number of Employees in Establishment, Fiscal Year 1966
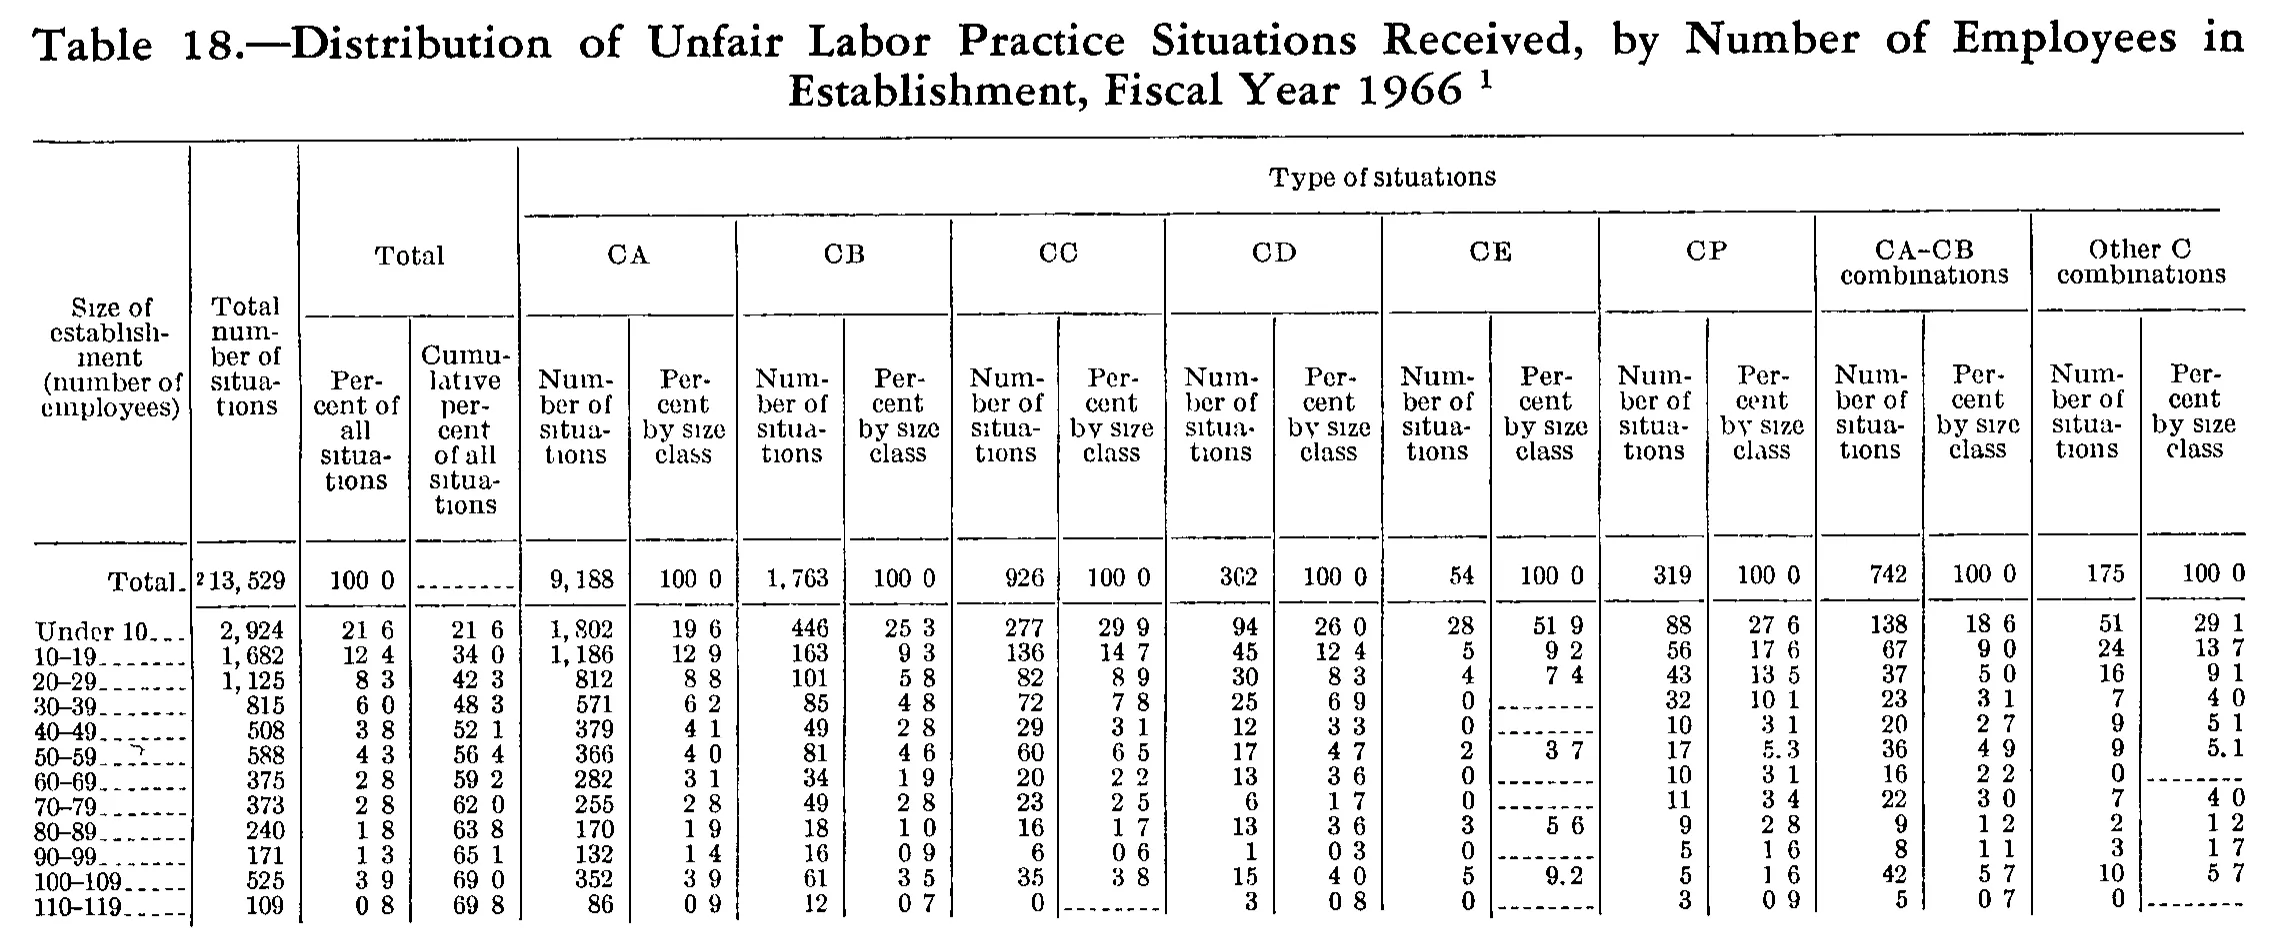
Distribution of Unfair Labor Practice Situations Received, by Number of Employees in Establishment, Fiscal Year 1966
Stitched from pp. 233–234.
| Size of establishment (number of employees) | Total number of situations | Total | Type of situations | ||||||||||||||||
|---|---|---|---|---|---|---|---|---|---|---|---|---|---|---|---|---|---|---|---|
| Size of establishment (number of employees) | Total number of situations | Total | CA | CB | CC | CD | CE | CP | CA-CB combinations | Other C combinations | |||||||||
| Size of establishment (number of employees) | Total number of situations | Percent of all situations | Cumulative percent of all situations | Number of situations | Percent by size class | Number of situations | Percent by size class | Number of situations | Percent by size class | Number of situations | Percent by size class | Number of situations | Percent by size class | Number of situations | Percent by size class | Number of situations | Percent by size class | Number of situations | Percent by size class |
| Total | 13,529 | 100.0 | 9,188 | 100.0 | 1,763 | 100.0 | 926 | 100.0 | 362 | 100.0 | 54 | 100.0 | 319 | 100.0 | 742 | 100.0 | 175 | 100.0 | |
| Under 10 | 2,924 | 21.6 | 21.6 | 1,802 | 19.6 | 446 | 25.3 | 277 | 29.9 | 94 | 26.0 | 28 | 51.9 | 88 | 27.6 | 138 | 18.6 | 51 | 29.1 |
| 10-19 | 1,682 | 12.4 | 34.0 | 1,186 | 12.9 | 163 | 9.3 | 136 | 14.7 | 45 | 12.4 | 5 | 9.2 | 56 | 17.6 | 67 | 9.0 | 24 | 13.7 |
| 20-29 | 1,125 | 8.3 | 42.3 | 812 | 8.8 | 101 | 5.8 | 82 | 8.9 | 30 | 8.3 | 4 | 7.4 | 43 | 13.5 | 37 | 5.0 | 16 | 9.1 |
| 30-39 | 815 | 6.0 | 48.3 | 571 | 6.2 | 85 | 4.8 | 72 | 7.8 | 25 | 6.9 | 0 | 32 | 10.1 | 23 | 3.1 | 7 | 4.0 | |
| 40-49 | 508 | 3.8 | 52.1 | 379 | 4.1 | 49 | 2.8 | 29 | 3.1 | 12 | 3.3 | 0 | 10 | 3.1 | 20 | 2.7 | 9 | 5.1 | |
| 50-59 | 588 | 4.3 | 56.4 | 366 | 4.0 | 81 | 4.6 | 60 | 6.5 | 17 | 4.7 | 2 | 3.7 | 17 | 5.3 | 36 | 4.9 | 9 | 5.1 |
| 60-69 | 375 | 2.8 | 59.2 | 282 | 3.1 | 34 | 1.9 | 20 | 2.2 | 13 | 3.6 | 0 | 10 | 3.1 | 16 | 2.2 | 0 | ||
| 70-79 | 373 | 2.8 | 62.0 | 255 | 2.8 | 49 | 2.8 | 23 | 2.5 | 6 | 1.7 | 0 | 11 | 3.4 | 22 | 3.0 | 7 | 4.0 | |
| 80-89 | 240 | 1.8 | 63.8 | 170 | 1.9 | 18 | 1.0 | 16 | 1.7 | 13 | 3.6 | 3 | 5.6 | 9 | 2.8 | 9 | 1.2 | 2 | 1.2 |
| 90-99 | 171 | 1.3 | 65.1 | 132 | 1.4 | 16 | 0.9 | 6 | 0.6 | 1 | 0.3 | 0 | 5 | 1.6 | 8 | 1.1 | 3 | 1.7 | |
| 100-109 | 525 | 3.9 | 69.0 | 352 | 3.9 | 61 | 3.5 | 35 | 3.8 | 15 | 4.0 | 5 | 9.2 | 5 | 1.6 | 42 | 5.7 | 10 | 5.7 |
| 110-119 | 109 | 0.8 | 69.8 | 86 | 0.9 | 12 | 0.7 | 0 | 3 | 0.8 | 0 | 3 | 0.9 | 5 | 0.7 | 0 | |||
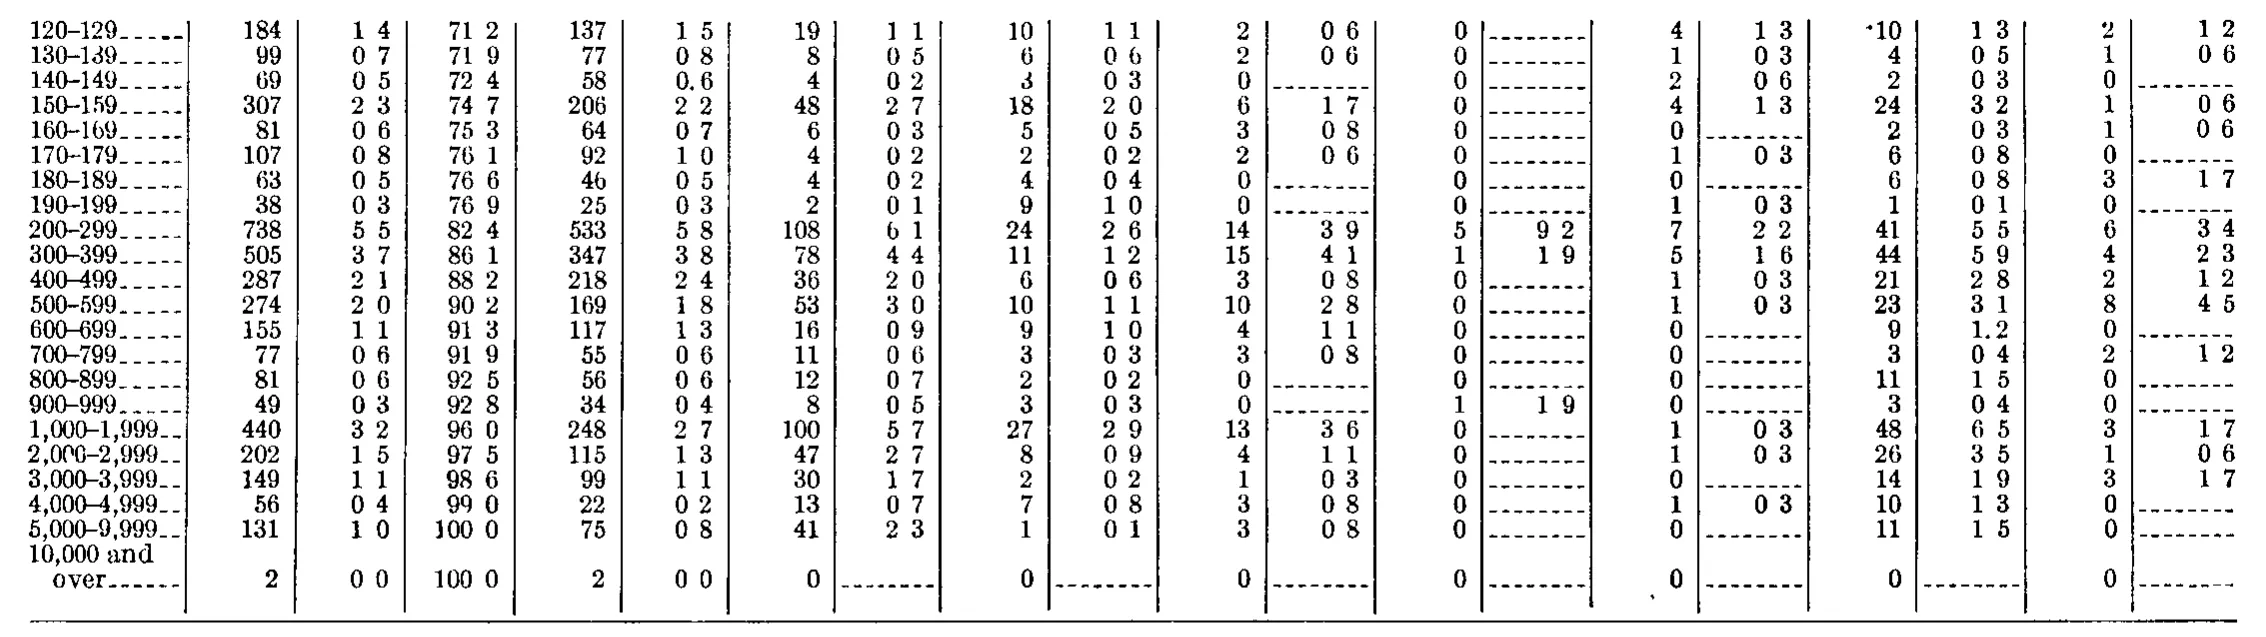
| 120–129 | 184 | 1.4 | 71.2 | 137 | 1.5 | 19 | 1.1 | 10 | 1.1 | 2 | 0.6 | 0 | 4 | 1.3 | 10 | 1.3 | 2 | 1.2 | |
| 130–139 | 99 | 0.7 | 71.9 | 77 | 0.8 | 8 | 0.5 | 6 | 0.6 | 2 | 0.6 | 0 | 1 | 0.3 | 4 | 0.5 | 1 | 0.6 | |
| 140–149 | 69 | 0.5 | 72.4 | 58 | 0.6 | 4 | 0.2 | 3 | 0.3 | 0 | 0 | 2 | 0.6 | 2 | 0.3 | 0 | |||
| 150–159 | 307 | 2.3 | 74.7 | 206 | 2.2 | 48 | 2.7 | 18 | 2.0 | 6 | 1.7 | 0 | 4 | 1.3 | 24 | 3.2 | 1 | 0.6 | |
| 160–169 | 81 | 0.6 | 75.3 | 64 | 0.7 | 6 | 0.3 | 5 | 0.5 | 3 | 0.8 | 0 | 0 | 2 | 0.3 | 1 | 0.6 | ||
| 170–179 | 107 | 0.8 | 76.1 | 92 | 1.0 | 4 | 0.2 | 2 | 0.2 | 2 | 0.6 | 0 | 1 | 0.3 | 6 | 0.8 | 0 | ||
| 180–189 | 63 | 0.5 | 76.6 | 46 | 0.5 | 4 | 0.2 | 4 | 0.4 | 0 | 0 | 0 | 6 | 0.8 | 3 | 1.7 | |||
| 190–199 | 38 | 0.3 | 76.9 | 25 | 0.3 | 2 | 0.1 | 9 | 1.0 | 0 | 0 | 1 | 0.3 | 1 | 0.1 | 0 | |||
| 200–299 | 738 | 5.5 | 82.4 | 533 | 5.8 | 108 | 6.1 | 24 | 2.6 | 14 | 3.9 | 5 | 9.2 | 7 | 2.2 | 41 | 5.5 | 6 | 3.4 |
| 300–399 | 505 | 3.7 | 86.1 | 347 | 3.8 | 78 | 4.4 | 11 | 1.2 | 15 | 4.1 | 1 | 1.9 | 5 | 1.6 | 44 | 5.9 | 4 | 2.3 |
| 400–499 | 287 | 2.1 | 88.2 | 218 | 2.4 | 36 | 2.0 | 6 | 0.6 | 3 | 0.8 | 0 | 1 | 0.3 | 21 | 2.8 | 2 | 1.2 | |
| 500–599 | 274 | 2.0 | 90.2 | 169 | 1.8 | 53 | 3.0 | 10 | 1.1 | 10 | 2.8 | 0 | 1 | 0.3 | 23 | 3.1 | 8 | 4.5 | |
| 600–699 | 155 | 1.1 | 91.3 | 117 | 1.3 | 16 | 0.9 | 9 | 1.0 | 4 | 1.1 | 0 | 0 | 9 | 1.2 | 0 | |||
| 700–799 | 77 | 0.6 | 91.9 | 55 | 0.6 | 11 | 0.6 | 3 | 0.3 | 3 | 0.8 | 0 | 0 | 3 | 0.4 | 2 | 1.2 | ||
| 800–899 | 81 | 0.6 | 92.5 | 56 | 0.6 | 12 | 0.7 | 2 | 0.2 | 0 | 0 | 0 | 11 | 1.5 | 0 | ||||
| 900–999 | 49 | 0.3 | 92.8 | 34 | 0.4 | 8 | 0.5 | 3 | 0.3 | 0 | 1 | 1.9 | 0 | 3 | 0.4 | 0 | |||
| 1,000–1,999 | 440 | 3.2 | 96.0 | 248 | 2.7 | 100 | 5.7 | 27 | 2.9 | 13 | 3.6 | 0 | 1 | 0.3 | 48 | 6.5 | 3 | 1.7 | |
| 2,000–2,999 | 202 | 1.5 | 97.5 | 115 | 1.3 | 47 | 2.7 | 8 | 0.9 | 4 | 1.1 | 0 | 1 | 0.3 | 26 | 3.5 | 1 | 0.6 | |
| 3,000–3,999 | 149 | 1.1 | 98.6 | 99 | 1.1 | 30 | 1.7 | 2 | 0.2 | 1 | 0.3 | 0 | 0 | 14 | 1.9 | 3 | 1.7 | ||
| 4,000–4,999 | 56 | 0.4 | 99.0 | 22 | 0.2 | 13 | 0.7 | 7 | 0.8 | 3 | 0.8 | 0 | 1 | 0.3 | 10 | 1.3 | 0 | ||
| 5,000–9,999 | 131 | 1.0 | 100.0 | 75 | 0.8 | 41 | 2.3 | 1 | 0.1 | 3 | 0.8 | 0 | 0 | 11 | 1.5 | 0 | |||
| 10,000 and over | 2 | 0.0 | 100.0 | 2 | 0.0 | 0 | 0 | 0 | 0 | 0 | 0 | 0 | |||||||
260 of 260 figures sit in a row or column sum that works out.
Reader’s notes
p. 233. Crop is truncated at the bottom. The body ends mid-table at the "110-119" row: the cumulative-percent column has only reached 69.8, so roughly 30 percent of the situations fall in size classes printed below the crop, and no "Total" closing line for those classes is visible. The footnote block is also cut off, so the texts for marker 1 (attached to the caption) and marker 2 (attached to 13,529 in the Total row) are not on this image; `footnotes` is therefore empty rather than absent. Decimal points: this is a degraded 1-bit scan in which most decimal points in the percent columns have dropped out, printing as a gap ("100 0", "21 6"). A few survived and are clearly visible — "5.3" (CP percent, 50-59), "5.1" (Other C percent, 40-49), "9.2" (CE percent, 100-109) — confirming the column format is one decimal place throughout. I have transcribed every percent with its decimal point. No digits were altered. CD total cell (Total row, "CD / Number of situations"): the middle glyph is broken and reads ambiguously as 0 or 6, i.e. "302" or "362". I transcribed 362. Two independent checks favour it: 94/362 = 26.0 percent, matching the printed CD figure for "Under 10" (94/302 would be 31.1 percent), and the eight type-of-situation totals sum to 13,529 exactly with 362 but fall 60 short with 302. The remaining CD percents are likewise consistent with a 362 base. Arithmetic check: with that one reading, the grid is fully self-consistent. All twelve size-class rows sum across the eight type columns to their printed row totals, the cumulative-percent column accumulates exactly, and each percent matches its number divided by the column total. No misprints found. Minor: the stub cell for "50-59" carries a stray ink mark among its leader dots; the label itself is legible. "Total" is printed as a tall heading whose box runs from the top rule down to the CA/CB band, so it is repeated in the first two header levels; "Type of situations" spans the sixteen type columns at the top level only.
p. 234. Crop shows only the lower body of a table continued from the preceding page: no column headings, no caption and no footnotes are printed on this image, so header_rows is empty. The table body is cut off at the top (the crop begins at the size class "120–129"; earlier size classes and any total line are on the part not shown). A double rule closes the body below "10,000 and over", so that is the last printed row. Column structure: 20 columns = stub + a first group of 3 columns (number, percent, cumulative percent) + eight 2-column groups (number, percent). Column 3 is a cumulative percent: it equals the exact running sum of column 2 down every row, and in every row the eight group-number columns (4, 6, 8, 10, 12, 14, 16, 18) sum exactly to the column-1 total. Both checks pass for all 22 rows, which confirms the column assignment of each figure. Decimal points: the percent columns are printed to one decimal, but the scan has dropped most of the decimal points, leaving a gap (e.g. "71 2", "1 4", "100 0"). A few survive and are legible as printed periods — "0.6" in row 140–149 (column 5) and "1.2" in row 600–699 (column 17) — and the cumulative-percent arithmetic only works with one decimal place. The decimal point is therefore written in every percent cell; nothing else was altered, computed or rounded. Row 120–129, column 16: a small raised dot or tick sits immediately before the figure 10. It may be a footnote marker or a scan speck; no footnote text is printed on this crop and the row's components sum to the printed total 184 with the value read as 10, so it is transcribed as a plain 10. Row label "2,000–2,999": the third character is broken in the scan and reads like a "C" ("2,0C0–2,999"); it is a zero, as confirmed by the surrounding sequence of size classes. Cells printed with a dash rule ("-------") in place of a percent are transcribed as "". Range labels use an en dash, as printed. "10,000 and over" wraps onto two printed lines and is transcribed as one row.
Source image
Source data: U.S. NLRB Annual Reports (public domain). Reconstruction by NLRB Stats Archive. Read by claude-opus-5 (effort max, prompt extract_v1) from the 300-dpi scan; stitched by page. Updated October 2026.