NLRB Stats Archive › Annual Reports › FY1966 › Size of Units in Representation Election Cases Closed, Fiscal Year 1966
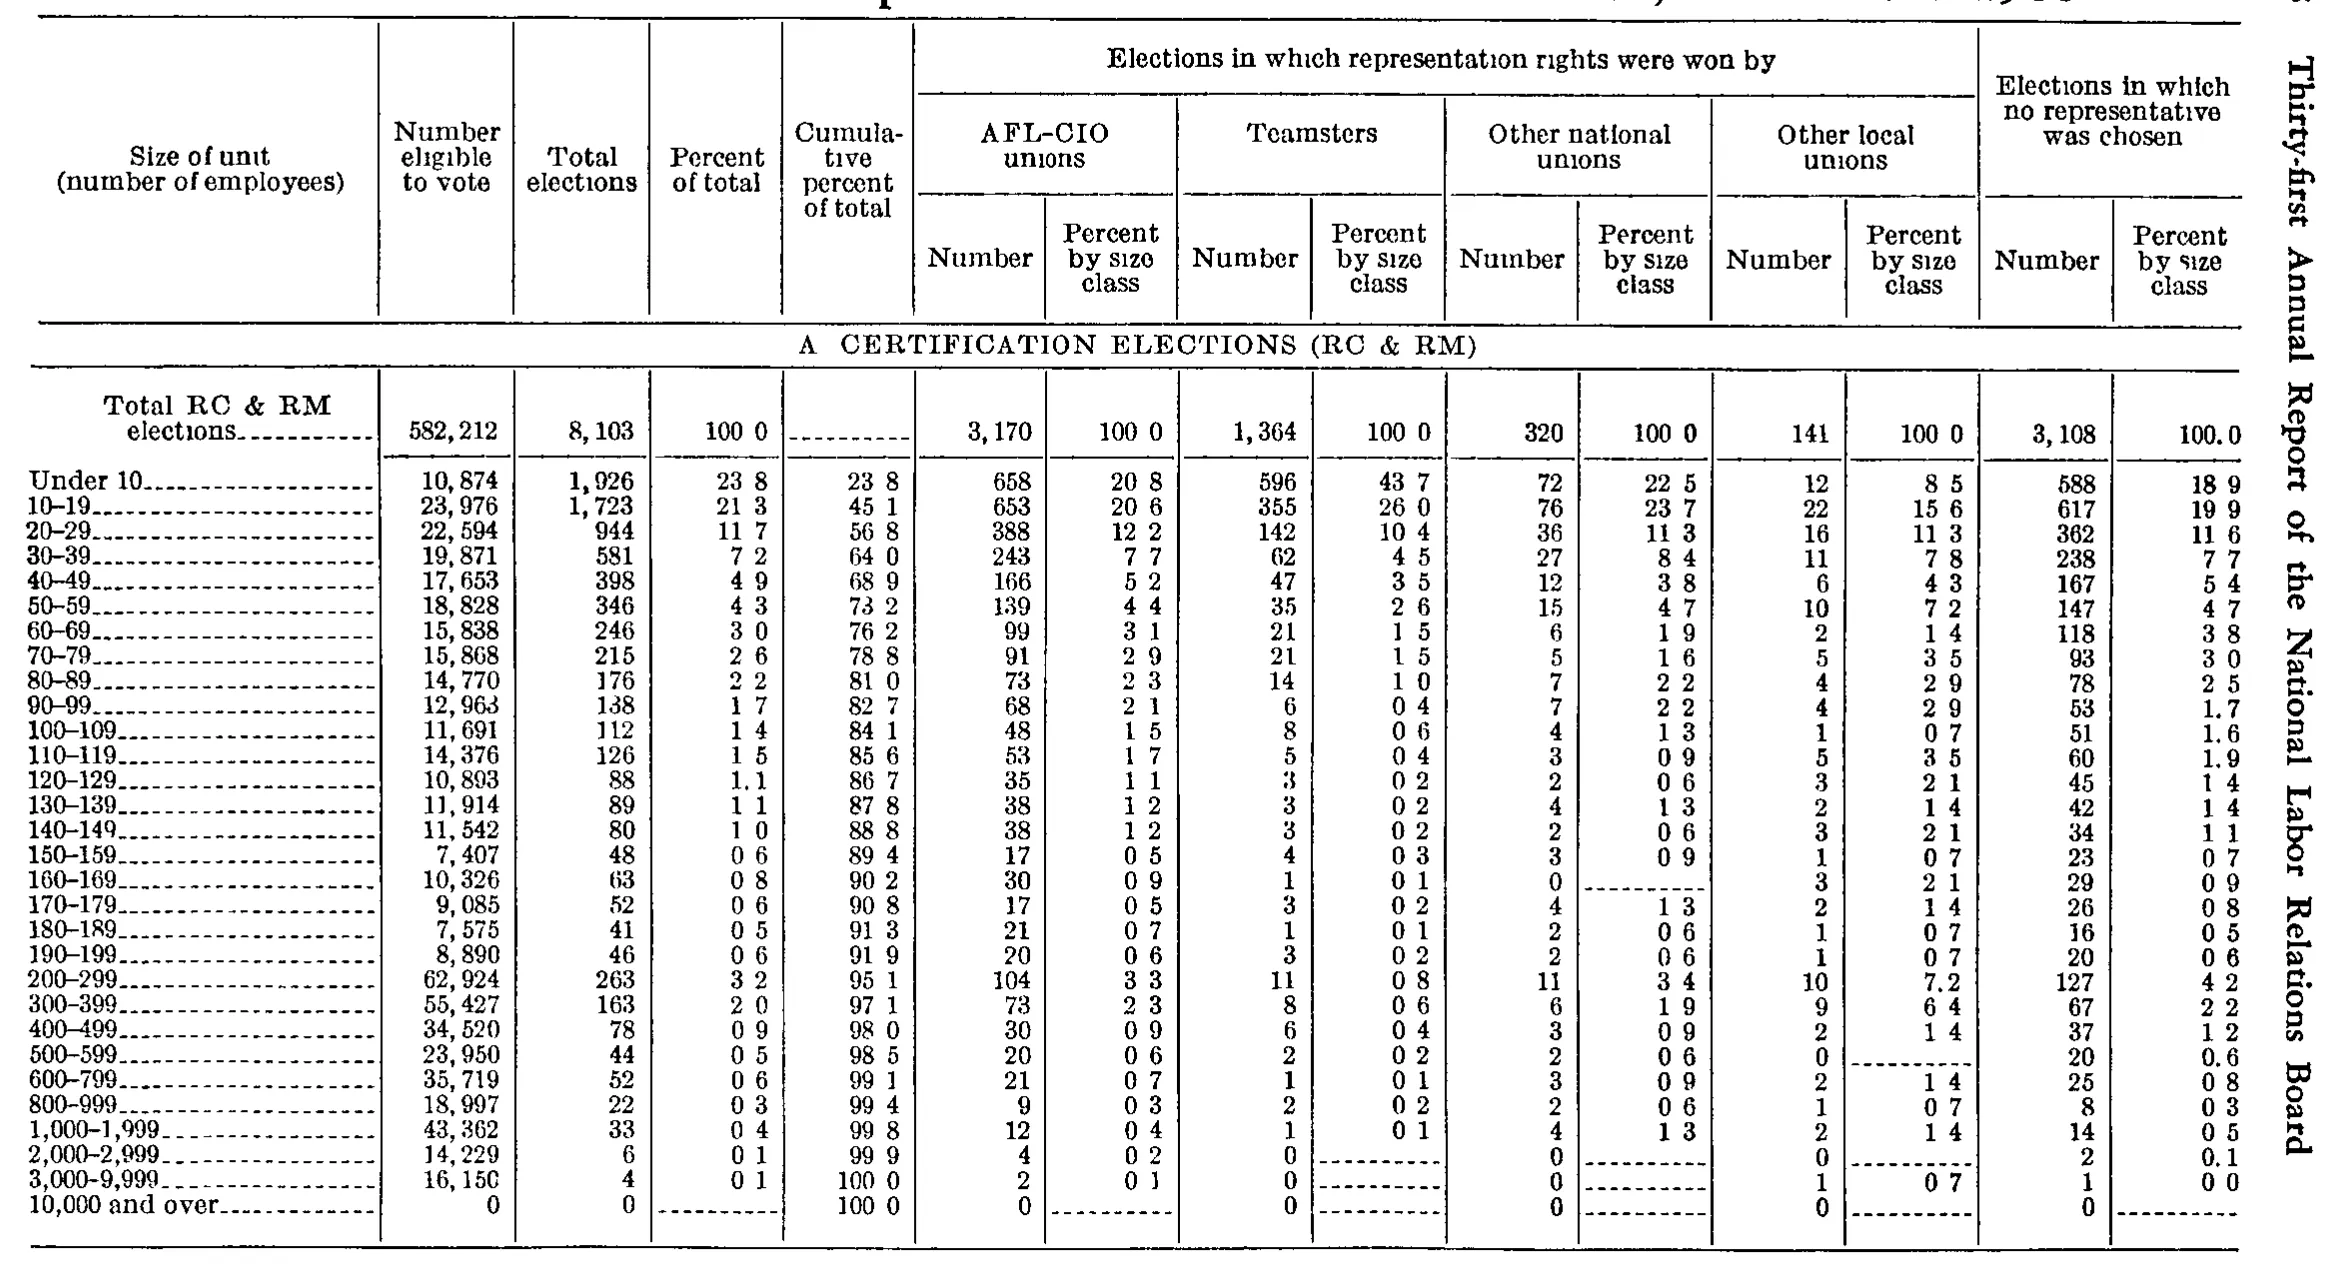
Size of Units in Representation Election Cases Closed, Fiscal Year 1966
Stitched from pp. 231–232.
| Size of unit (number of employees) | Number eligible to vote | Total elections | Percent of total | Cumulative percent of total | Elections in which representation rights were won by | Elections in which no representative was chosen | ||||||||
|---|---|---|---|---|---|---|---|---|---|---|---|---|---|---|
| Size of unit (number of employees) | Number eligible to vote | Total elections | Percent of total | Cumulative percent of total | AFL-CIO unions | Teamsters | Other national unions | Other local unions | Elections in which no representative was chosen | |||||
| Size of unit (number of employees) | Number eligible to vote | Total elections | Percent of total | Cumulative percent of total | Number | Percent by size class | Number | Percent by size class | Number | Percent by size class | Number | Percent by size class | Number | Percent by size class |
| A. CERTIFICATION ELECTIONS (RC & RM) | ||||||||||||||
| Total RC & RM elections | 582,212 | 8,103 | 100.0 | 3,170 | 100.0 | 1,364 | 100.0 | 320 | 100.0 | 141 | 100.0 | 3,108 | 100.0 | |
| Under 10 | 10,874 | 1,926 | 23.8 | 23.8 | 658 | 20.8 | 596 | 43.7 | 72 | 22.5 | 12 | 8.5 | 588 | 18.9 |
| 10-19 | 23,976 | 1,723 | 21.3 | 45.1 | 653 | 20.6 | 355 | 26.0 | 76 | 23.7 | 22 | 15.6 | 617 | 19.9 |
| 20-29 | 22,594 | 944 | 11.7 | 56.8 | 388 | 12.2 | 142 | 10.4 | 36 | 11.3 | 16 | 11.3 | 362 | 11.6 |
| 30-39 | 19,871 | 581 | 7.2 | 64.0 | 243 | 7.7 | 62 | 4.5 | 27 | 8.4 | 11 | 7.8 | 238 | 7.7 |
| 40-49 | 17,653 | 398 | 4.9 | 68.9 | 166 | 5.2 | 47 | 3.5 | 12 | 3.8 | 6 | 4.3 | 167 | 5.4 |
| 50-59 | 18,828 | 346 | 4.3 | 73.2 | 139 | 4.4 | 35 | 2.6 | 15 | 4.7 | 10 | 7.2 | 147 | 4.7 |
| 60-69 | 15,838 | 246 | 3.0 | 76.2 | 99 | 3.1 | 21 | 1.5 | 6 | 1.9 | 2 | 1.4 | 118 | 3.8 |
| 70-79 | 15,868 | 215 | 2.6 | 78.8 | 91 | 2.9 | 21 | 1.5 | 5 | 1.6 | 5 | 3.5 | 93 | 3.0 |
| 80-89 | 14,770 | 176 | 2.2 | 81.0 | 73 | 2.3 | 14 | 1.0 | 7 | 2.2 | 4 | 2.9 | 78 | 2.5 |
| 90-99 | 12,963 | 138 | 1.7 | 82.7 | 68 | 2.1 | 6 | 0.4 | 7 | 2.2 | 4 | 2.9 | 53 | 1.7 |
| 100-109 | 11,691 | 112 | 1.4 | 84.1 | 48 | 1.5 | 8 | 0.6 | 4 | 1.3 | 1 | 0.7 | 51 | 1.6 |
| 110-119 | 14,376 | 126 | 1.5 | 85.6 | 53 | 1.7 | 5 | 0.4 | 3 | 0.9 | 5 | 3.5 | 60 | 1.9 |
| 120-129 | 10,893 | 88 | 1.1 | 86.7 | 35 | 1.1 | 3 | 0.2 | 2 | 0.6 | 3 | 2.1 | 45 | 1.4 |
| 130-139 | 11,914 | 89 | 1.1 | 87.8 | 38 | 1.2 | 3 | 0.2 | 4 | 1.3 | 2 | 1.4 | 42 | 1.4 |
| 140-149 | 11,542 | 80 | 1.0 | 88.8 | 38 | 1.2 | 3 | 0.2 | 2 | 0.6 | 3 | 2.1 | 34 | 1.1 |
| 150-159 | 7,407 | 48 | 0.6 | 89.4 | 17 | 0.5 | 4 | 0.3 | 3 | 0.9 | 1 | 0.7 | 23 | 0.7 |
| 160-169 | 10,326 | 63 | 0.8 | 90.2 | 30 | 0.9 | 1 | 0.1 | 0 | 3 | 2.1 | 29 | 0.9 | |
| 170-179 | 9,085 | 52 | 0.6 | 90.8 | 17 | 0.5 | 3 | 0.2 | 4 | 1.3 | 2 | 1.4 | 26 | 0.8 |
| 180-189 | 7,575 | 41 | 0.5 | 91.3 | 21 | 0.7 | 1 | 0.1 | 2 | 0.6 | 1 | 0.7 | 16 | 0.5 |
| 190-199 | 8,890 | 46 | 0.6 | 91.9 | 20 | 0.6 | 3 | 0.2 | 2 | 0.6 | 1 | 0.7 | 20 | 0.6 |
| 200-299 | 62,924 | 263 | 3.2 | 95.1 | 104 | 3.3 | 11 | 0.8 | 11 | 3.4 | 10 | 7.2 | 127 | 4.2 |
| 300-399 | 55,427 | 163 | 2.0 | 97.1 | 73 | 2.3 | 8 | 0.6 | 6 | 1.9 | 9 | 6.4 | 67 | 2.2 |
| 400-499 | 34,520 | 78 | 0.9 | 98.0 | 30 | 0.9 | 6 | 0.4 | 3 | 0.9 | 2 | 1.4 | 37 | 1.2 |
| 500-599 | 23,950 | 44 | 0.5 | 98.5 | 20 | 0.6 | 2 | 0.2 | 2 | 0.6 | 0 | 20 | 0.6 | |
| 600-799 | 35,719 | 52 | 0.6 | 99.1 | 21 | 0.7 | 1 | 0.1 | 3 | 0.9 | 2 | 1.4 | 25 | 0.8 |
| 800-999 | 18,997 | 22 | 0.3 | 99.4 | 9 | 0.3 | 2 | 0.2 | 2 | 0.6 | 1 | 0.7 | 8 | 0.3 |
| 1,000-1,999 | 43,362 | 33 | 0.4 | 99.8 | 12 | 0.4 | 1 | 0.1 | 4 | 1.3 | 2 | 1.4 | 14 | 0.5 |
| 2,000-2,999 | 14,229 | 6 | 0.1 | 99.9 | 4 | 0.2 | 0 | 0 | 0 | 2 | 0.1 | |||
| 3,000-9,999 | 16,150 | 4 | 0.1 | 100.0 | 2 | 0.1 | 0 | 0 | 1 | 0.7 | 1 | 0.0 | ||
| 10,000 and over | 0 | 0 | 100.0 | 0 | 0 | 0 | 0 | 0 | ||||||
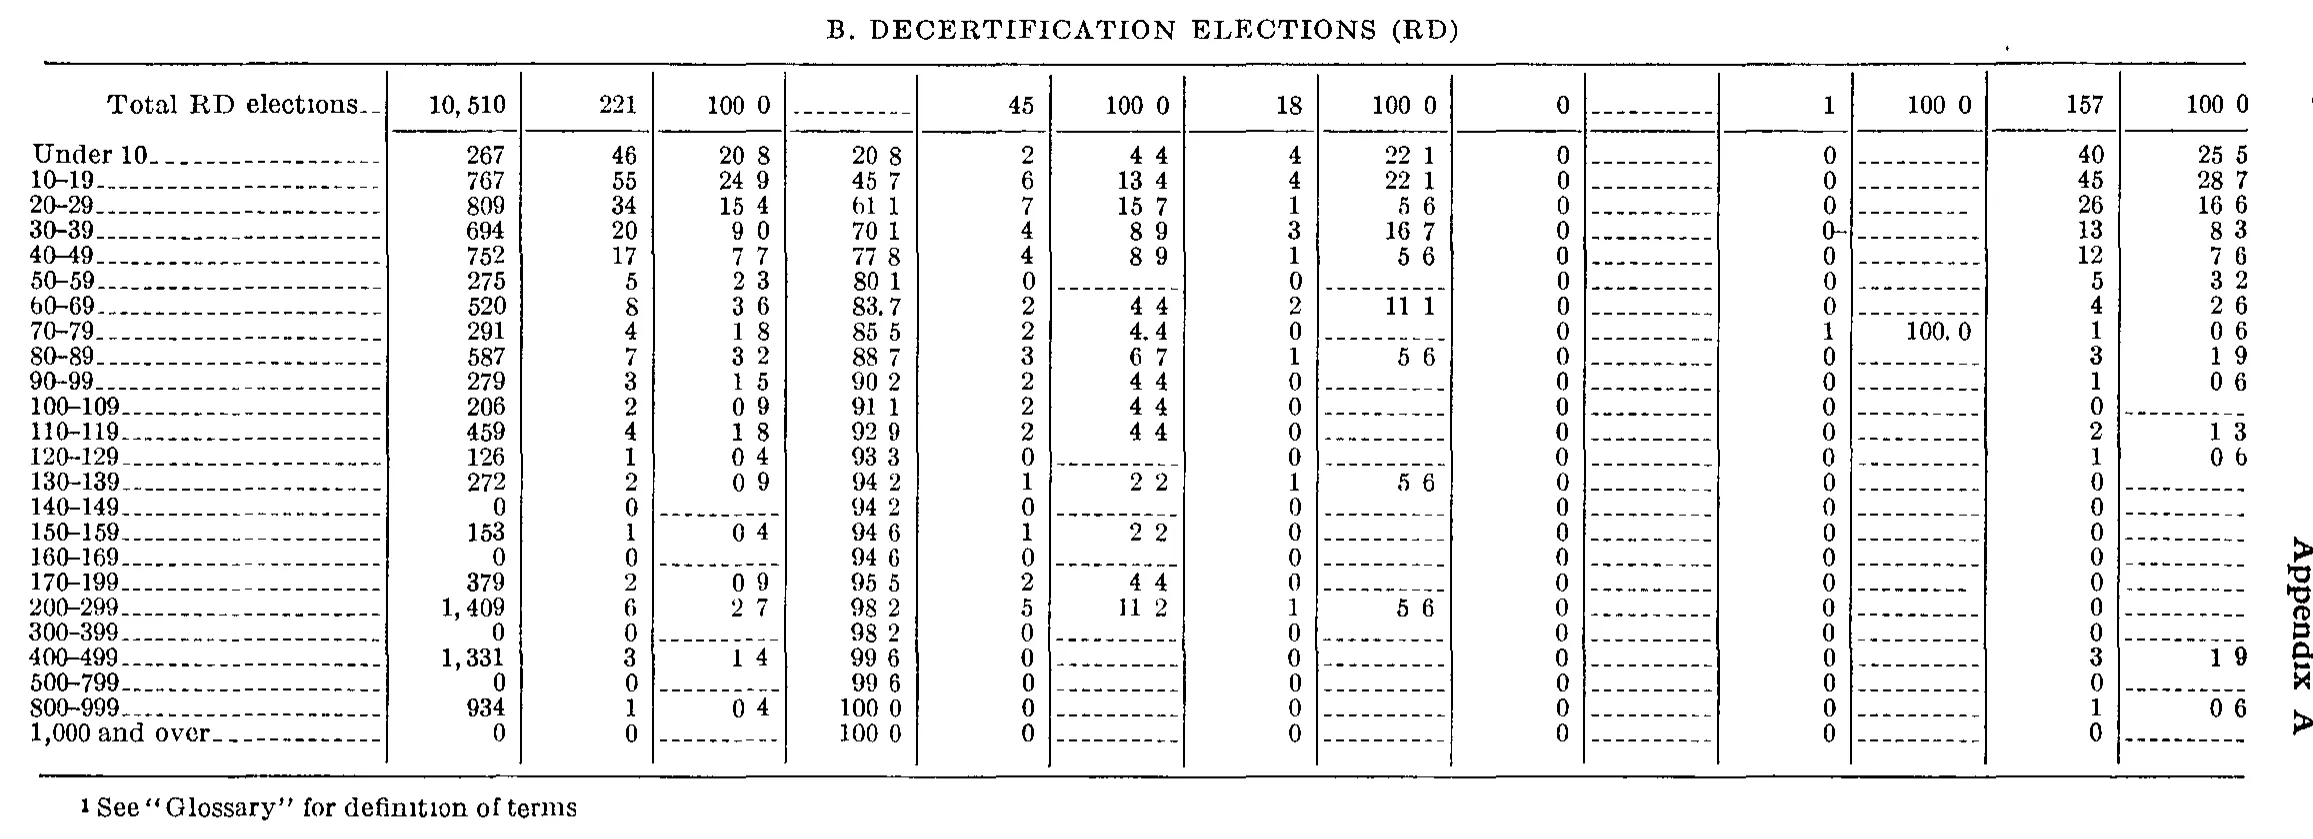
| B. DECERTIFICATION ELECTIONS (RD) | ||||||||||||||
| Total RD elections | 10,510 | 221 | 100.0 | 45 | 100.0 | 18 | 100.0 | 0 | 1 | 100.0 | 157 | 100.0 | ||
| Under 10 | 267 | 46 | 20.8 | 20.8 | 2 | 4.4 | 4 | 22.1 | 0 | 0 | 40 | 25.5 | ||
| 10-19 | 767 | 55 | 24.9 | 45.7 | 6 | 13.4 | 4 | 22.1 | 0 | 0 | 45 | 28.7 | ||
| 20-29 | 809 | 34 | 15.4 | 61.1 | 7 | 15.7 | 1 | 5.6 | 0 | 0 | 26 | 16.6 | ||
| 30-39 | 694 | 20 | 9.0 | 70.1 | 4 | 8.9 | 3 | 16.7 | 0 | 0 | 13 | 8.3 | ||
| 40-49 | 752 | 17 | 7.7 | 77.8 | 4 | 8.9 | 1 | 5.6 | 0 | 0 | 12 | 7.6 | ||
| 50-59 | 275 | 5 | 2.3 | 80.1 | 0 | 0 | 0 | 0 | 5 | 3.2 | ||||
| 60-69 | 520 | 8 | 3.6 | 83.7 | 2 | 4.4 | 2 | 11.1 | 0 | 0 | 4 | 2.6 | ||
| 70-79 | 291 | 4 | 1.8 | 85.5 | 2 | 4.4 | 0 | 0 | 1 | 100.0 | 1 | 0.6 | ||
| 80-89 | 587 | 7 | 3.2 | 88.7 | 3 | 6.7 | 1 | 5.6 | 0 | 0 | 3 | 1.9 | ||
| 90-99 | 279 | 3 | 1.5 | 90.2 | 2 | 4.4 | 0 | 0 | 0 | 1 | 0.6 | |||
| 100-109 | 206 | 2 | 0.9 | 91.1 | 2 | 4.4 | 0 | 0 | 0 | 0 | ||||
| 110-119 | 459 | 4 | 1.8 | 92.9 | 2 | 4.4 | 0 | 0 | 0 | 2 | 1.3 | |||
| 120-129 | 126 | 1 | 0.4 | 93.3 | 0 | 0 | 0 | 0 | 1 | 0.6 | ||||
| 130-139 | 272 | 2 | 0.9 | 94.2 | 1 | 2.2 | 1 | 5.6 | 0 | 0 | 0 | |||
| 140-149 | 0 | 0 | 94.2 | 0 | 0 | 0 | 0 | 0 | ||||||
| 150-159 | 153 | 1 | 0.4 | 94.6 | 1 | 2.2 | 0 | 0 | 0 | 0 | ||||
| 160-169 | 0 | 0 | 94.6 | 0 | 0 | 0 | 0 | 0 | ||||||
| 170-199 | 379 | 2 | 0.9 | 95.5 | 2 | 4.4 | 0 | 0 | 0 | 0 | ||||
| 200-299 | 1,409 | 6 | 2.7 | 98.2 | 5 | 11.2 | 1 | 5.6 | 0 | 0 | 0 | |||
| 300-399 | 0 | 0 | 98.2 | 0 | 0 | 0 | 0 | 0 | ||||||
| 400-499 | 1,331 | 3 | 1.4 | 99.6 | 0 | 0 | 0 | 0 | 3 | 1.9 | ||||
| 500-799 | 0 | 0 | 99.6 | 0 | 0 | 0 | 0 | 0 | ||||||
| 800-999 | 934 | 1 | 0.4 | 100.0 | 0 | 0 | 0 | 0 | 1 | 0.6 | ||||
| 1,000 and over | 0 | 0 | 100.0 | 0 | 0 | 0 | 0 | 0 | ||||||
- 1 See "Glossary" for definition of terms
286 of 286 figures sit in a row or column sum that works out.
Reader’s notes
p. 231. Decimal points: this 1-bit scan drops most decimal points in the percent columns, so values print as e.g. "23 8", "100 0" (a few, such as "1.7", "1.1", "7.2", "0.6", "100.0", retain a visible dot). All such cells are transcribed with the decimal point, since the columns are percentages and the surviving dots confirm the typography; no digits were changed. Section line: the header band reads "A CERTIFICATION ELECTIONS (RC & RM)"; the period after "A" is not legible at this resolution and has been supplied by analogy with the surviving dots elsewhere. Only panel A appears in this crop — the table's later sections continue on following pages, and the caption is cut off above the top rule. Verification: every count column sums exactly to its printed total — Number eligible to vote 582,212; Total elections 8,103; AFL-CIO 3,170; Teamsters 1,364; Other national 320; Other local 141; No representative 3,108. The cumulative-percent column also agrees with the running sum of the percent-of-total column throughout. This confirms "3,000-9,999" / Number eligible to vote, which images as "16, 15C" with a degraded final glyph, is 16,150. Doubtful percent cells (read as printed; each differs by 0.1 from the value implied by its own column total, so it is either an original rounding slip or a misread glyph): "50-59" and "200-299" / Other local unions, Percent by size class, read 7.2 (10/141 = 7.1); "80-89" and "90-99" / Other local unions, Percent by size class, read 2.9 (4/141 = 2.8); "200-299" / Elections in which no representative was chosen, Percent by size class, read 4.2 (127/3,108 = 4.1); "2,000-2,999" / AFL-CIO unions, Percent by size class, read 0.2 (4/3,170 = 0.1), though the adjacent "3,000-9,999" cell is clearly a different glyph, 0.1. Cells shown as a dash rule ("------") are transcribed as empty: the cumulative-percent cell of the "Total RC & RM elections" row, the percent cells accompanying a zero count in "160-169", "500-599", "2,000-2,999" and "3,000-9,999", and the percent-of-total plus all five percent-by-size-class cells of "10,000 and over". Printed zeros in those rows are kept as 0.
p. 232. Continuation page: no column headings are printed on this crop (they stand on the preceding page), so header_rows is empty. The grid has 15 columns — stub plus 14 data columns, read off the column rules: (1) a count column whose figures sum to the printed total 10,510; (2)-(3) a number and percent pair; (4) a cumulative-percent column (blank on the total line); then (5)-(6), (7)-(8), (9)-(10), (11)-(12), (13)-(14) as further number/percent pairs. "B. DECERTIFICATION ELECTIONS (RD)" is printed centred in caps above the table's top rule; I have kept it as a label-only section row at the head of the body, but a reader who treats it as part of the caption should drop that row. Decimal points: in this 1-bit scan the period in the percent columns is often lost, so values print as "20 8", "100 0". They are decimal fractions (the period survives in "83.7" and "100. 0"), and I have written them as 20.8, 100.0, etc. No digits were added or removed. Column 10 (the percent column paired with the all-zero column 9) carries only dash rules in every row including the total, so it is empty throughout; column 9 is a printed 0 in every row. In row "30-39", column 11 reads "0-": the 0 is the value and the hyphen is the first stroke of the leader dashes running into column 12. No value was computed or corrected, but as a check on column placement every column reproduces its own arithmetic exactly: columns 1, 2, 5, 7, 11 and 13 sum to the printed totals 10,510 / 221 / 45 / 18 / 1 / 157; percent columns 3, 6, 8 and 14 each sum to 100.0; and column 4 is the running sum of column 3 (e.g. 88.7 + 1.5 = 90.2, confirming the doubtful "1 5" in row 90-99 as 1.5 rather than 1.4). A few printed percentages differ by 0.1 from the raw quotient (13.4 for 6/45, 15.7 for 7/45, 11.2 for 5/45, 22.1 for 4/18, 2.6 for 4/157); these are as printed and are what make each column total exactly 100.0. The vertical "Appendix A" along the right margin is a running head and is omitted.
Source image
Source data: U.S. NLRB Annual Reports (public domain). Reconstruction by NLRB Stats Archive. Read by claude-opus-5 (effort max, prompt extract_v1) from the 300-dpi scan; stitched by page. Updated October 2026.