NLRB Stats Archive › Annual Reports › FY1966 › Geographic distribution of representation elections
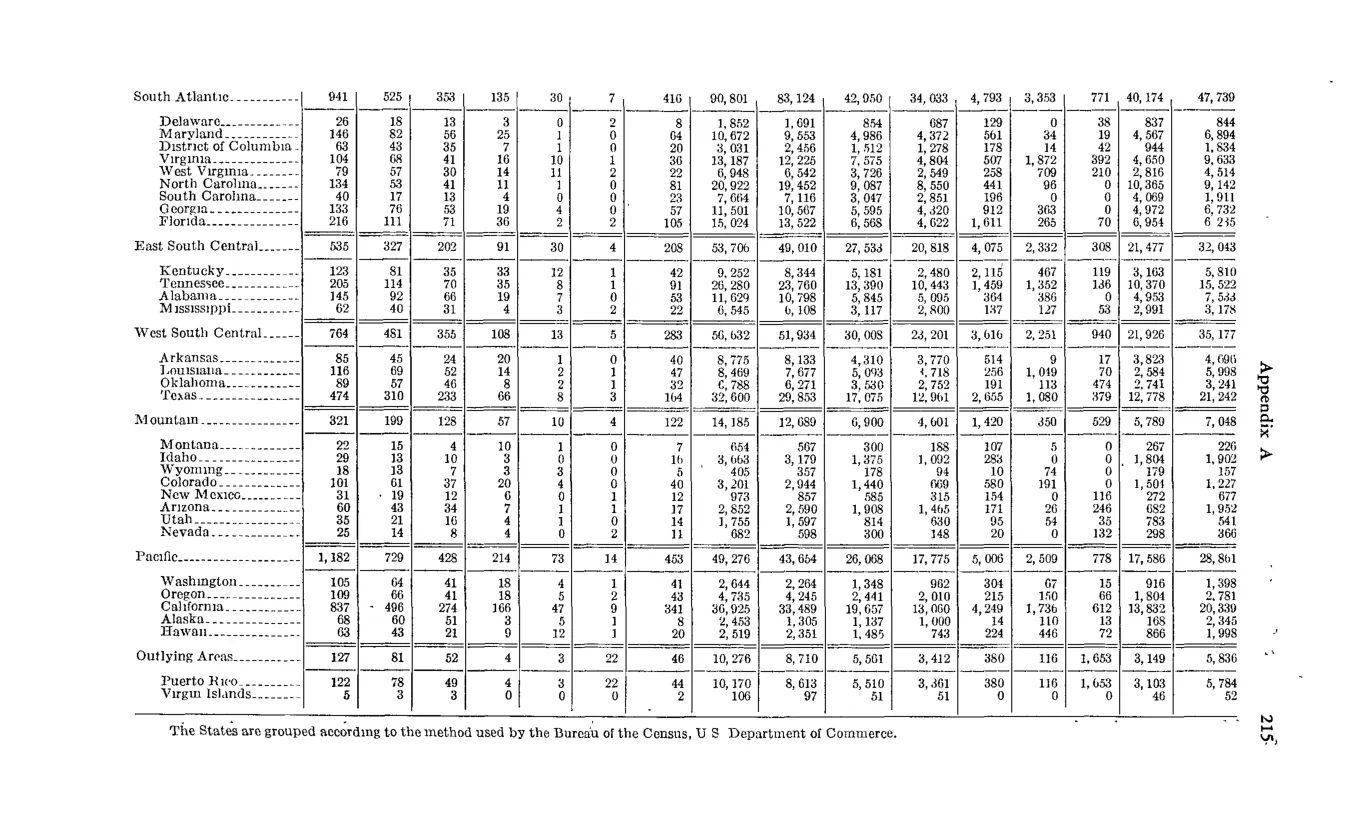
Geographic distribution of representation elections
| Division and State | Total elections | Number won by unions Total | Number won by AFL-CIO | Number won by Teamsters | Number won by Other national | Number won by Other local | Number in which no representative was chosen | Number of employees eligible to vote | Total valid votes cast | Valid votes cast for unions Total | Valid votes for AFL-CIO | Valid votes for Teamsters | Valid votes for Other national | Valid votes for Other local | Valid votes for no union | Eligible employees in elections choosing representation | |
|---|---|---|---|---|---|---|---|---|---|---|---|---|---|---|---|---|---|
| South Atlantic | 941 | 525 | 353 | 135 | 35 | 7 | 416 | 90,810 | 83,124 | 42,050 | 34,083 | 4,703 | 3,353 | 771 | 40,174 | 47,739 | |
| SA state | |||||||||||||||||
| East South Central | 535 | 327 | 202 | 93 | 30 | 4 | 208 | 53,706 | 49,795 | 30,819 | 21,488 | 4,075 | 2,332 | 208 | 21,477 | 32,083 | |
| West South Central | 764 | 481 | 355 | 108 | 13 | 5 | 283 | 56,452 | 51,924 | 30,408 | 24,201 | 3,646 | 2,231 | 330 | 21,516 | 35,177 | |
| WSC state | |||||||||||||||||
| Mountain | 321 | 199 | 128 | 57 | 10 | 4 | 122 | 14,185 | 12,680 | 6,800 | 4,561 | 1,420 | 450 | 529 | 5,789 | 7,048 | |
| Pacific | 1,182 | 739 | 428 | 214 | 73 | 16 | 433 | 49,276 | 45,604 | 26,098 | 17,775 | 5,000 | 2,550 | 778 | 17,686 | 26,861 | |
| Pacific state | |||||||||||||||||
| Outlying Areas | 127 | 81 | 52 | 24 | 1 | 4 | 46 | 10,228 | 8,710 | 5,553 | 3,412 | 385 | 165 | 1,653 | 5,834 |
Source image
Source data: U.S. NLRB Annual Reports (public domain). Reconstruction by NLRB Stats Archive. Updated June 2026.