NLRB Stats Archive › Annual Reports › FY1966 › Elections in Which Certification Issued After Objections to Election Were Filed and/or in Which Determination of Challenges Was Required, Fiscal Year 1966
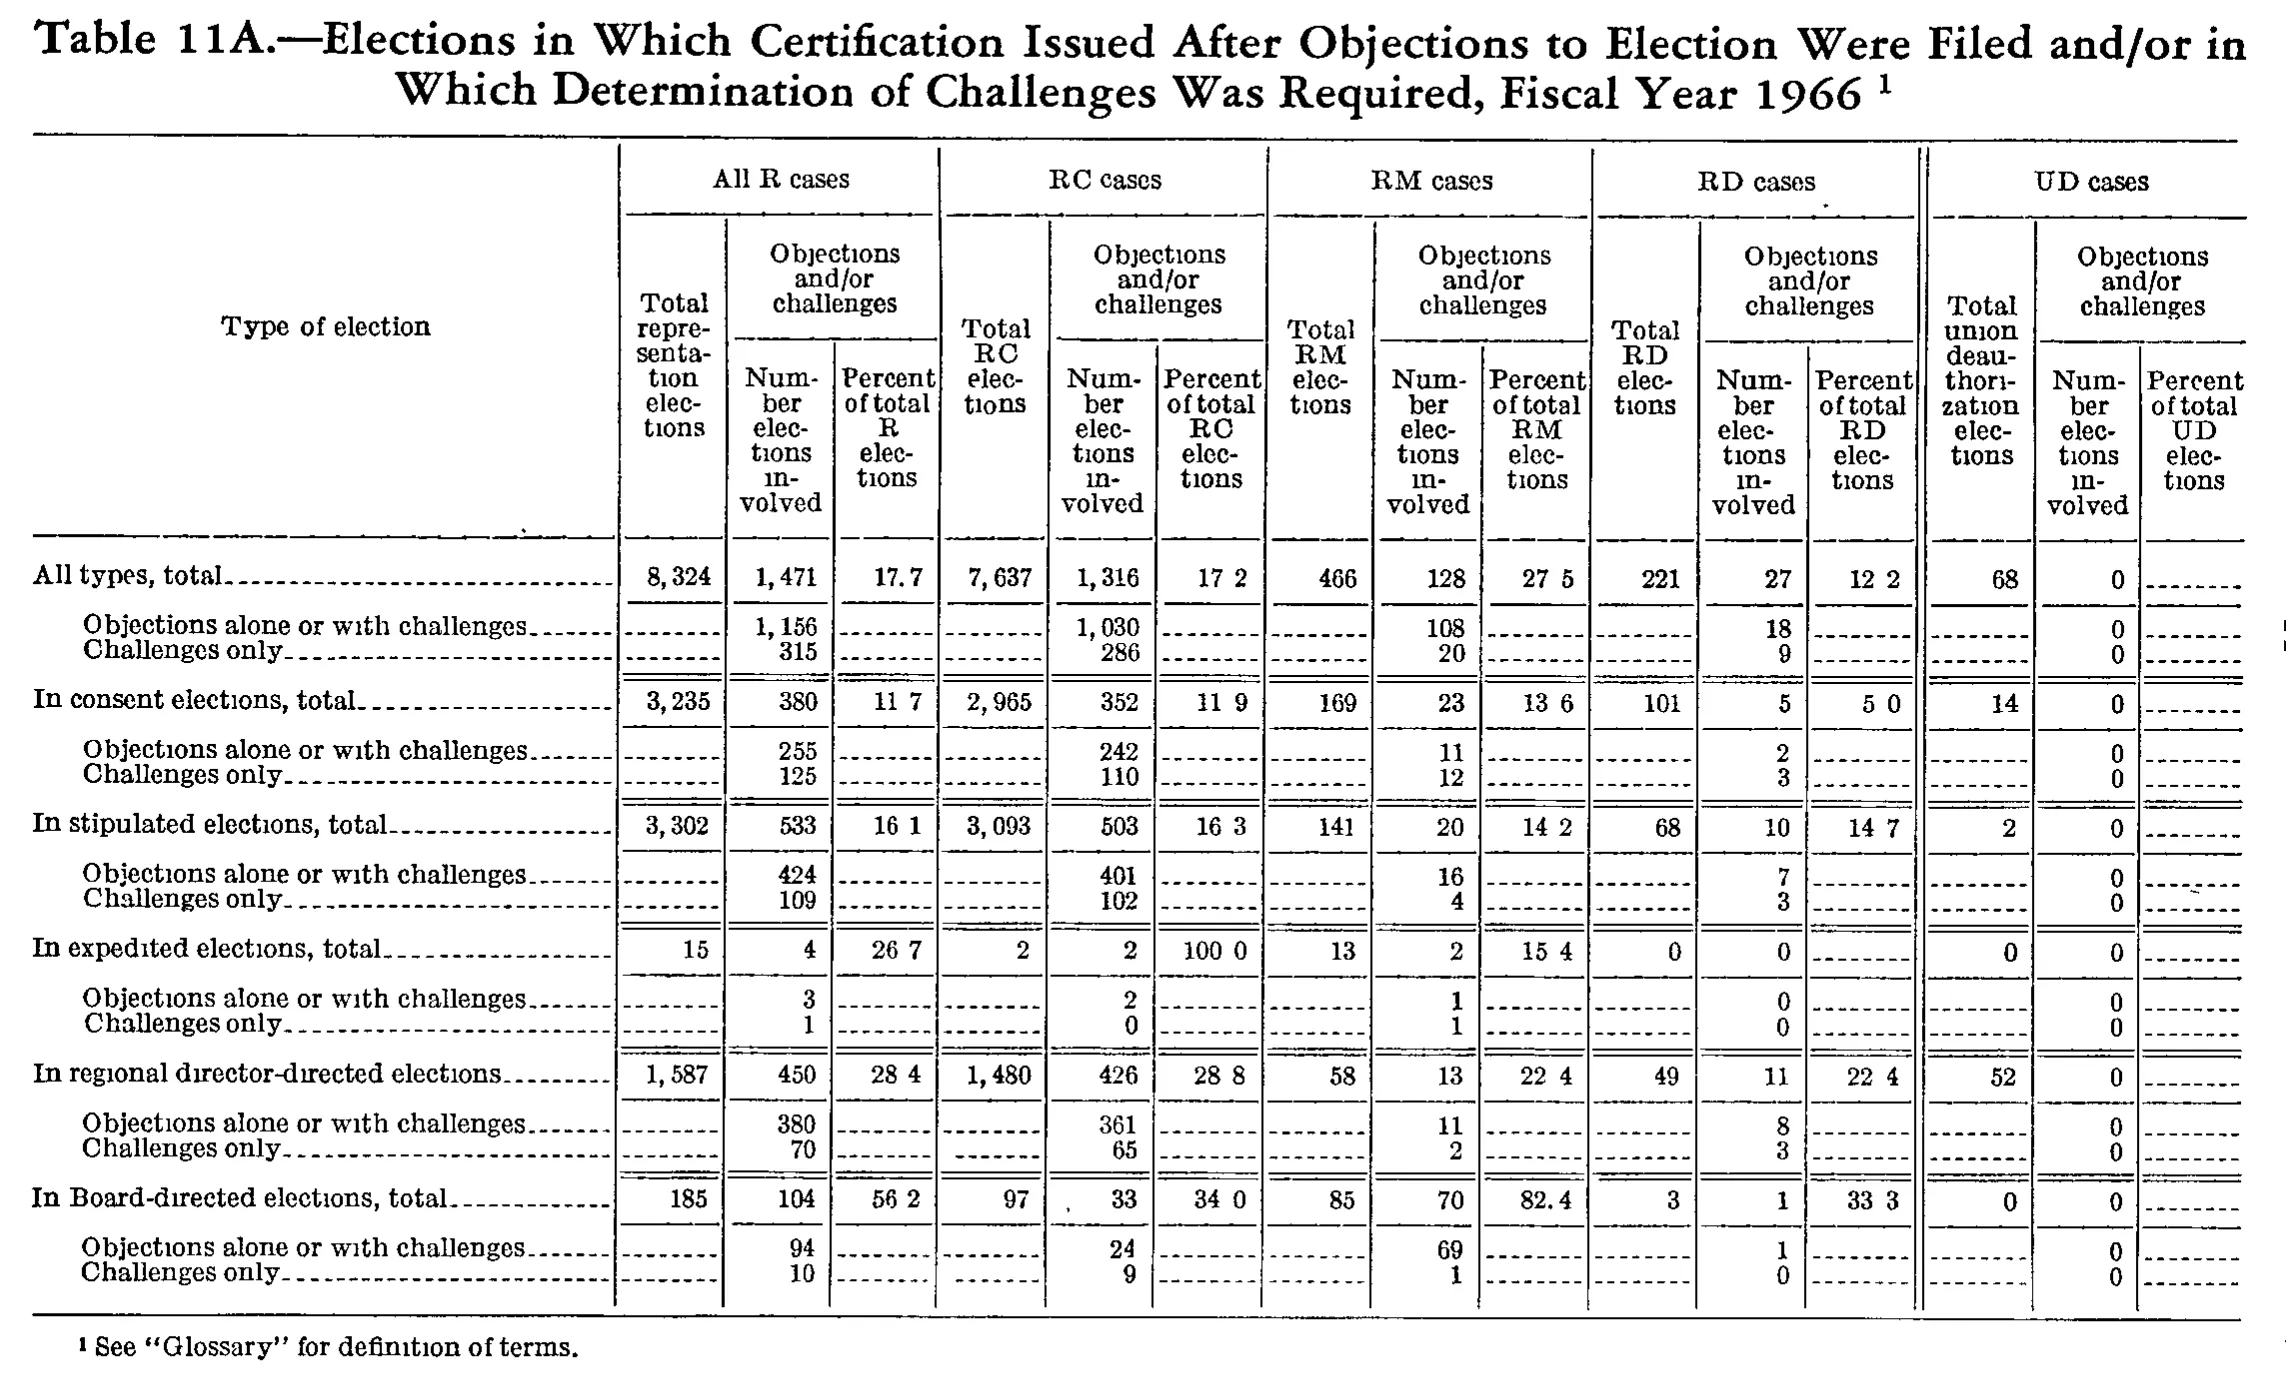
Elections in Which Certification Issued After Objections to Election Were Filed and/or in Which Determination of Challenges Was Required, Fiscal Year 1966
| Type of election | All R cases | RC cases | RM cases | RD cases | UD cases | ||||||||||
|---|---|---|---|---|---|---|---|---|---|---|---|---|---|---|---|
| Type of election | Total representation elections | Objections and/or challenges | Total RC elections | Objections and/or challenges | Total RM elections | Objections and/or challenges | Total RD elections | Objections and/or challenges | Total union deauthorization elections | Objections and/or challenges | |||||
| Type of election | Total representation elections | Number elections involved | Percent of total R elections | Total RC elections | Number elections involved | Percent of total RC elections | Total RM elections | Number elections involved | Percent of total RM elections | Total RD elections | Number elections involved | Percent of total RD elections | Total union deauthorization elections | Number elections involved | Percent of total UD elections |
| All types, total | 8,324 | 1,471 | 17.7 | 7,637 | 1,316 | 17.2 | 466 | 128 | 27.5 | 221 | 27 | 12.2 | 68 | 0 | |
| Objections alone or with challenges | 1,156 | 1,030 | 108 | 18 | 0 | ||||||||||
| Challenges only | 315 | 286 | 20 | 9 | 0 | ||||||||||
| In consent elections, total | 3,235 | 380 | 11.7 | 2,965 | 352 | 11.9 | 169 | 23 | 13.6 | 101 | 5 | 5.0 | 14 | 0 | |
| Objections alone or with challenges | 255 | 242 | 11 | 2 | 0 | ||||||||||
| Challenges only | 125 | 110 | 12 | 3 | 0 | ||||||||||
| In stipulated elections, total | 3,302 | 533 | 16.1 | 3,093 | 503 | 16.3 | 141 | 20 | 14.2 | 68 | 10 | 14.7 | 2 | 0 | |
| Objections alone or with challenges | 424 | 401 | 16 | 7 | 0 | ||||||||||
| Challenges only | 109 | 102 | 4 | 3 | 0 | ||||||||||
| In expedited elections, total | 15 | 4 | 26.7 | 2 | 2 | 100.0 | 13 | 2 | 15.4 | 0 | 0 | 0 | 0 | ||
| Objections alone or with challenges | 3 | 2 | 1 | 0 | 0 | ||||||||||
| Challenges only | 1 | 0 | 1 | 0 | 0 | ||||||||||
| In regional director-directed elections | 1,587 | 450 | 28.4 | 1,480 | 426 | 28.8 | 58 | 13 | 22.4 | 49 | 11 | 22.4 | 52 | 0 | |
| Objections alone or with challenges | 380 | 361 | 11 | 8 | 0 | ||||||||||
| Challenges only | 70 | 65 | 2 | 3 | 0 | ||||||||||
| In Board-directed elections, total | 185 | 104 | 56.2 | 97 | 33 | 34.0 | 85 | 70 | 82.4 | 3 | 1 | 33.3 | 0 | 0 | |
| Objections alone or with challenges | 94 | 24 | 69 | 1 | 0 | ||||||||||
| Challenges only | 10 | 9 | 1 | 0 | 0 | ||||||||||
- 1 See "Glossary" for definition of terms.
0 of 94 figures sit in a row or column sum that works out.
Reader’s notes
p. 216. 16 columns: stub plus five case groups (All R, RC, RM, RD, UD) of three columns each. Decimal points in the percent columns: the scan is 1-bit and most of the small periods have dropped out, so cells print as "17 2", "27 5", "100 0", etc. Only "17.7" (All R percent, "All types, total") and "82.4" (RM percent, "In Board-directed elections, total") show the period clearly. All of these are one-decimal percentages and every one of them reproduces the printed numerator/denominator ratio exactly (e.g. 1,316/7,637 = 17.2; 2/2 = 100.0), so I have written them with the decimal point restored. If a literal rendering is wanted, replace each decimal point in the percent columns with a space. Row 13 is printed "In regional director-directed elections" with no ", total", unlike the other section totals; transcribed as printed. "In expedited elections, total": the RD percent and UD percent cells are dash rules (RD total and number are both 0), transcribed as "". The UD percent column is a dash rule on every row of the table. No misprints found: every stub-section total equals the sum of its "Objections alone or with challenges" and "Challenges only" lines, and the "All types, total" row equals the sum of the five election-type rows, in all ten value columns.
Source image
Source data: U.S. NLRB Annual Reports (public domain). Reconstruction by NLRB Stats Archive. Read by claude-opus-5 (effort max, prompt extract_v1) from the 300-dpi scan; stitched by page. Updated October 2026.