NLRB Stats Archive › Annual Reports › FY1966 › Geographic Distribution of Cases Received, Fiscal Year 1966
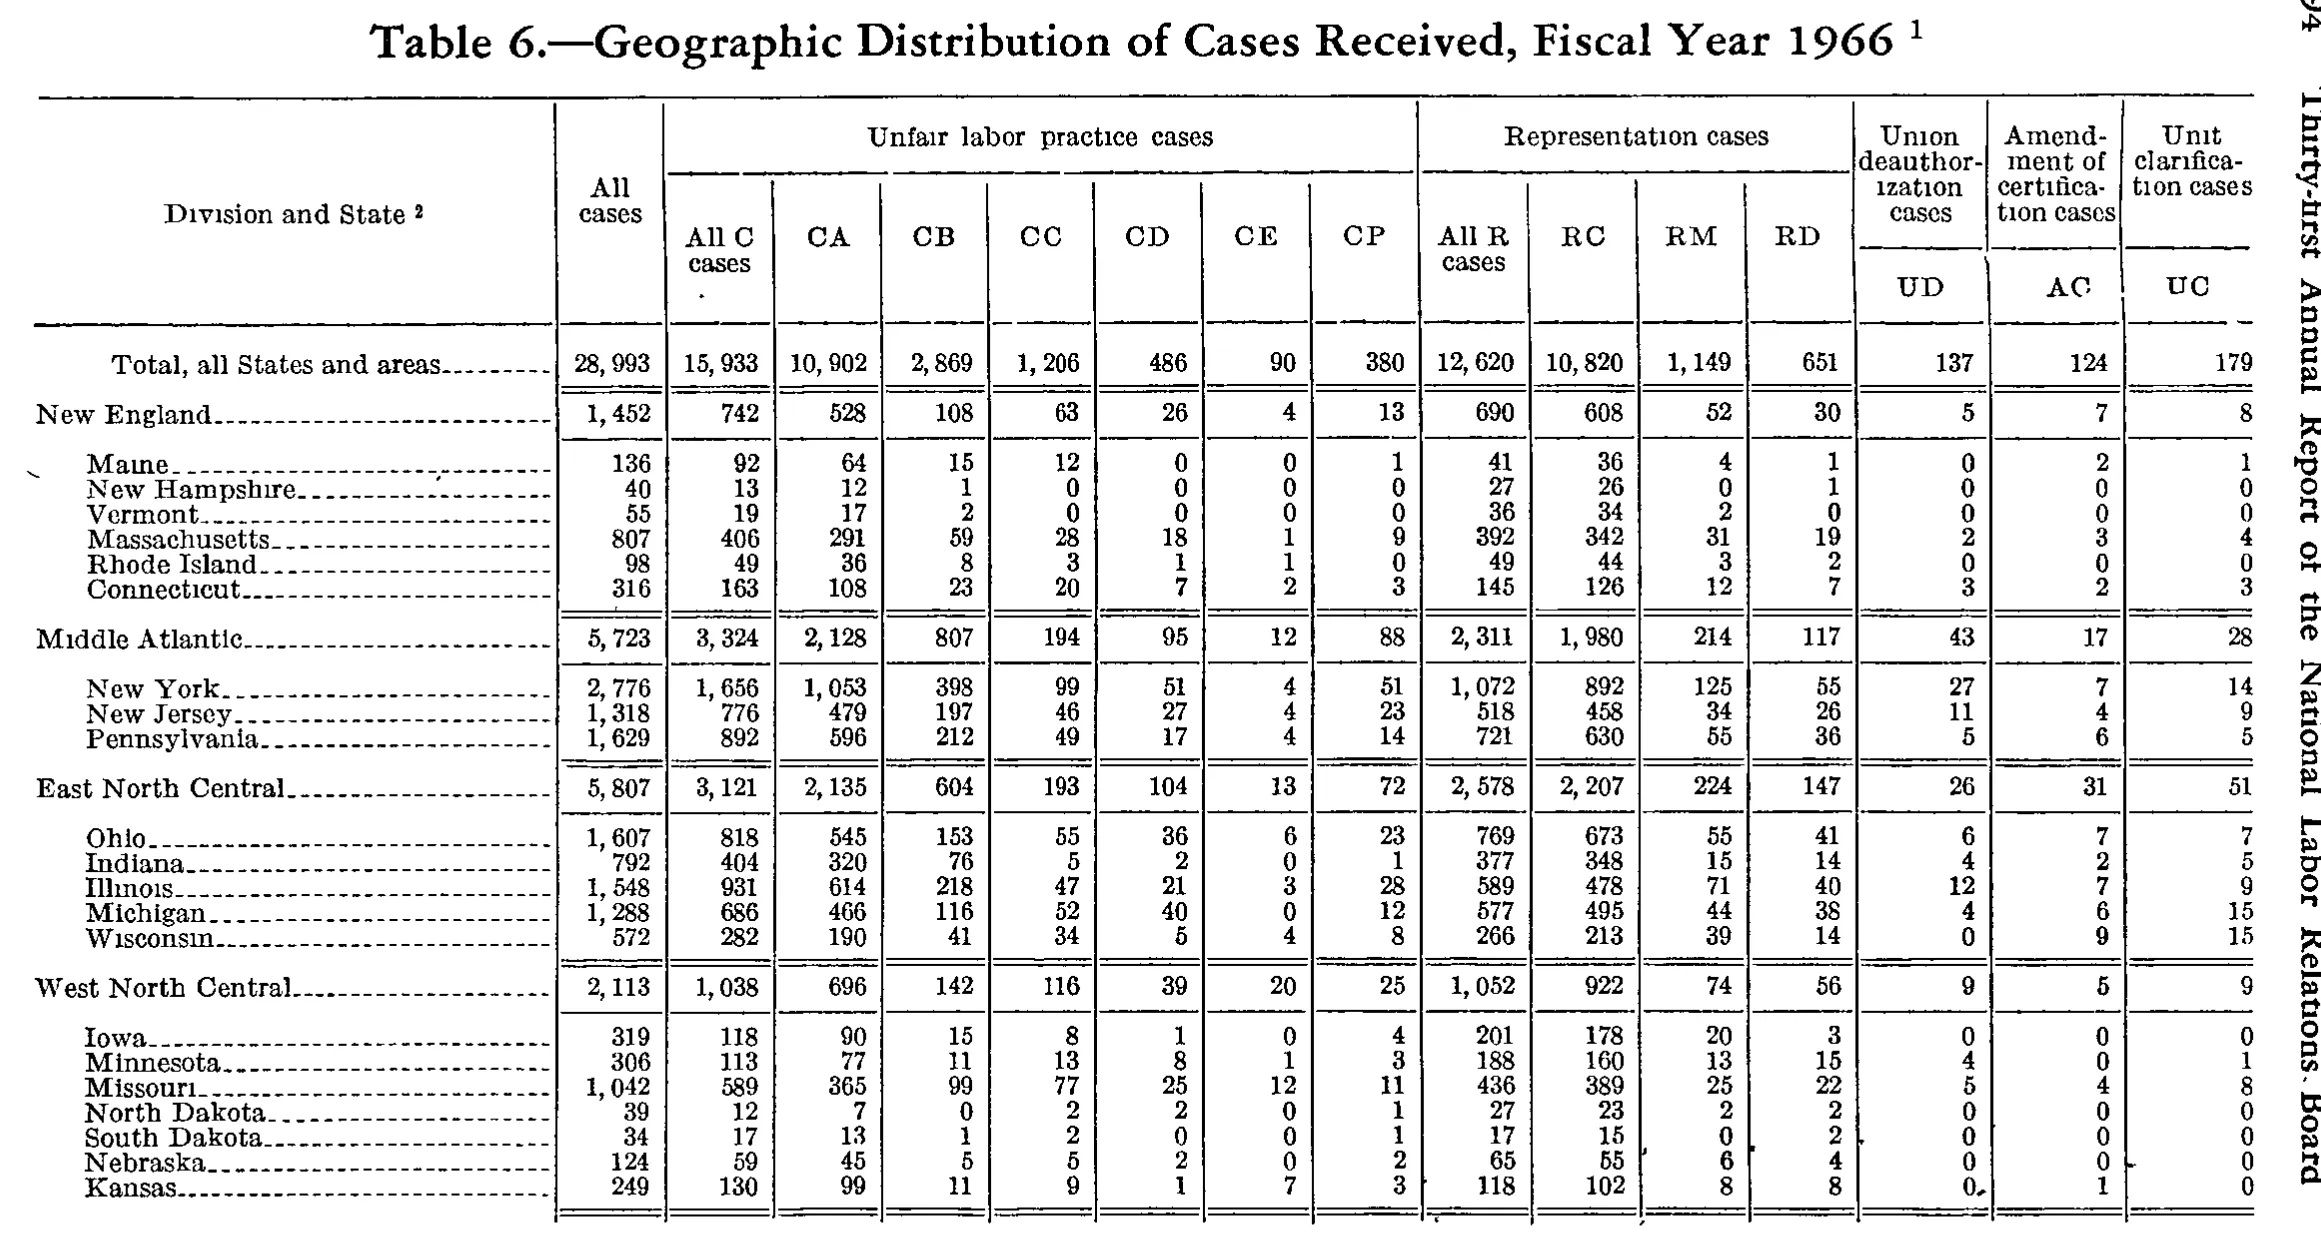
Geographic Distribution of Cases Received, Fiscal Year 1966
Stitched from pp. 207–208.
| Division and State | All cases | Unfair labor practice cases | Representation cases | Union deauthorization cases | Amendment of certification cases | Unit clarification cases | |||||||||
|---|---|---|---|---|---|---|---|---|---|---|---|---|---|---|---|
| Division and State | All cases | All C cases | CA | CB | CC | CD | CE | CP | All R cases | RC | RM | RD | Union deauthorization cases | Amendment of certification cases | Unit clarification cases |
| Division and State | All cases | All C cases | CA | CB | CC | CD | CE | CP | All R cases | RC | RM | RD | UD | AC | UC |
| Total, all States and areas | 28,993 | 15,933 | 10,902 | 2,869 | 1,206 | 486 | 90 | 380 | 12,620 | 10,820 | 1,149 | 651 | 137 | 124 | 179 |
| New England | 1,452 | 742 | 528 | 108 | 63 | 26 | 4 | 13 | 690 | 608 | 52 | 30 | 5 | 7 | 8 |
| Maine | 136 | 92 | 64 | 15 | 12 | 0 | 0 | 1 | 41 | 36 | 4 | 1 | 0 | 2 | 1 |
| New Hampshire | 40 | 13 | 12 | 1 | 0 | 0 | 0 | 0 | 27 | 26 | 0 | 1 | 0 | 0 | 0 |
| Vermont | 55 | 19 | 17 | 2 | 0 | 0 | 0 | 0 | 36 | 34 | 2 | 0 | 0 | 0 | 0 |
| Massachusetts | 807 | 406 | 291 | 59 | 28 | 18 | 1 | 9 | 392 | 342 | 31 | 19 | 2 | 3 | 4 |
| Rhode Island | 98 | 49 | 36 | 8 | 3 | 1 | 1 | 0 | 49 | 44 | 3 | 2 | 0 | 0 | 0 |
| Connecticut | 316 | 163 | 108 | 23 | 20 | 7 | 2 | 3 | 145 | 126 | 12 | 7 | 3 | 2 | 3 |
| Middle Atlantic | 5,723 | 3,324 | 2,128 | 807 | 194 | 95 | 12 | 88 | 2,311 | 1,980 | 214 | 117 | 43 | 17 | 28 |
| New York | 2,776 | 1,656 | 1,053 | 398 | 99 | 51 | 4 | 51 | 1,072 | 892 | 125 | 55 | 27 | 7 | 14 |
| New Jersey | 1,318 | 776 | 479 | 197 | 46 | 27 | 4 | 23 | 518 | 458 | 34 | 26 | 11 | 4 | 9 |
| Pennsylvania | 1,629 | 892 | 596 | 212 | 49 | 17 | 4 | 14 | 721 | 630 | 55 | 36 | 5 | 6 | 5 |
| East North Central | 5,807 | 3,121 | 2,135 | 604 | 193 | 104 | 13 | 72 | 2,578 | 2,207 | 224 | 147 | 26 | 31 | 51 |
| Ohio | 1,607 | 818 | 545 | 153 | 55 | 36 | 6 | 23 | 769 | 673 | 55 | 41 | 6 | 7 | 7 |
| Indiana | 792 | 404 | 320 | 76 | 5 | 2 | 0 | 1 | 377 | 348 | 15 | 14 | 4 | 2 | 5 |
| Illinois | 1,548 | 931 | 614 | 218 | 47 | 21 | 3 | 28 | 589 | 478 | 71 | 40 | 12 | 7 | 9 |
| Michigan | 1,288 | 686 | 466 | 116 | 52 | 40 | 0 | 12 | 577 | 495 | 44 | 38 | 4 | 6 | 15 |
| Wisconsin | 572 | 282 | 190 | 41 | 34 | 5 | 4 | 8 | 266 | 213 | 39 | 14 | 0 | 9 | 15 |
| West North Central | 2,113 | 1,038 | 696 | 142 | 116 | 39 | 20 | 25 | 1,052 | 922 | 74 | 56 | 9 | 5 | 9 |
| Iowa | 319 | 118 | 90 | 15 | 8 | 1 | 0 | 4 | 201 | 178 | 20 | 3 | 0 | 0 | 0 |
| Minnesota | 306 | 113 | 77 | 11 | 13 | 8 | 1 | 3 | 188 | 160 | 13 | 15 | 4 | 0 | 1 |
| Missouri | 1,042 | 589 | 365 | 99 | 77 | 25 | 12 | 11 | 436 | 389 | 25 | 22 | 5 | 4 | 8 |
| North Dakota | 39 | 12 | 7 | 0 | 2 | 2 | 0 | 1 | 27 | 23 | 2 | 2 | 0 | 0 | 0 |
| South Dakota | 34 | 17 | 13 | 1 | 2 | 0 | 0 | 1 | 17 | 15 | 0 | 2 | 0 | 0 | 0 |
| Nebraska | 124 | 59 | 45 | 5 | 5 | 2 | 0 | 2 | 65 | 55 | 6 | 4 | 0 | 0 | 0 |
| Kansas | 249 | 130 | 99 | 11 | 9 | 1 | 7 | 3 | 118 | 102 | 8 | 8 | 0 | 1 | 0 |
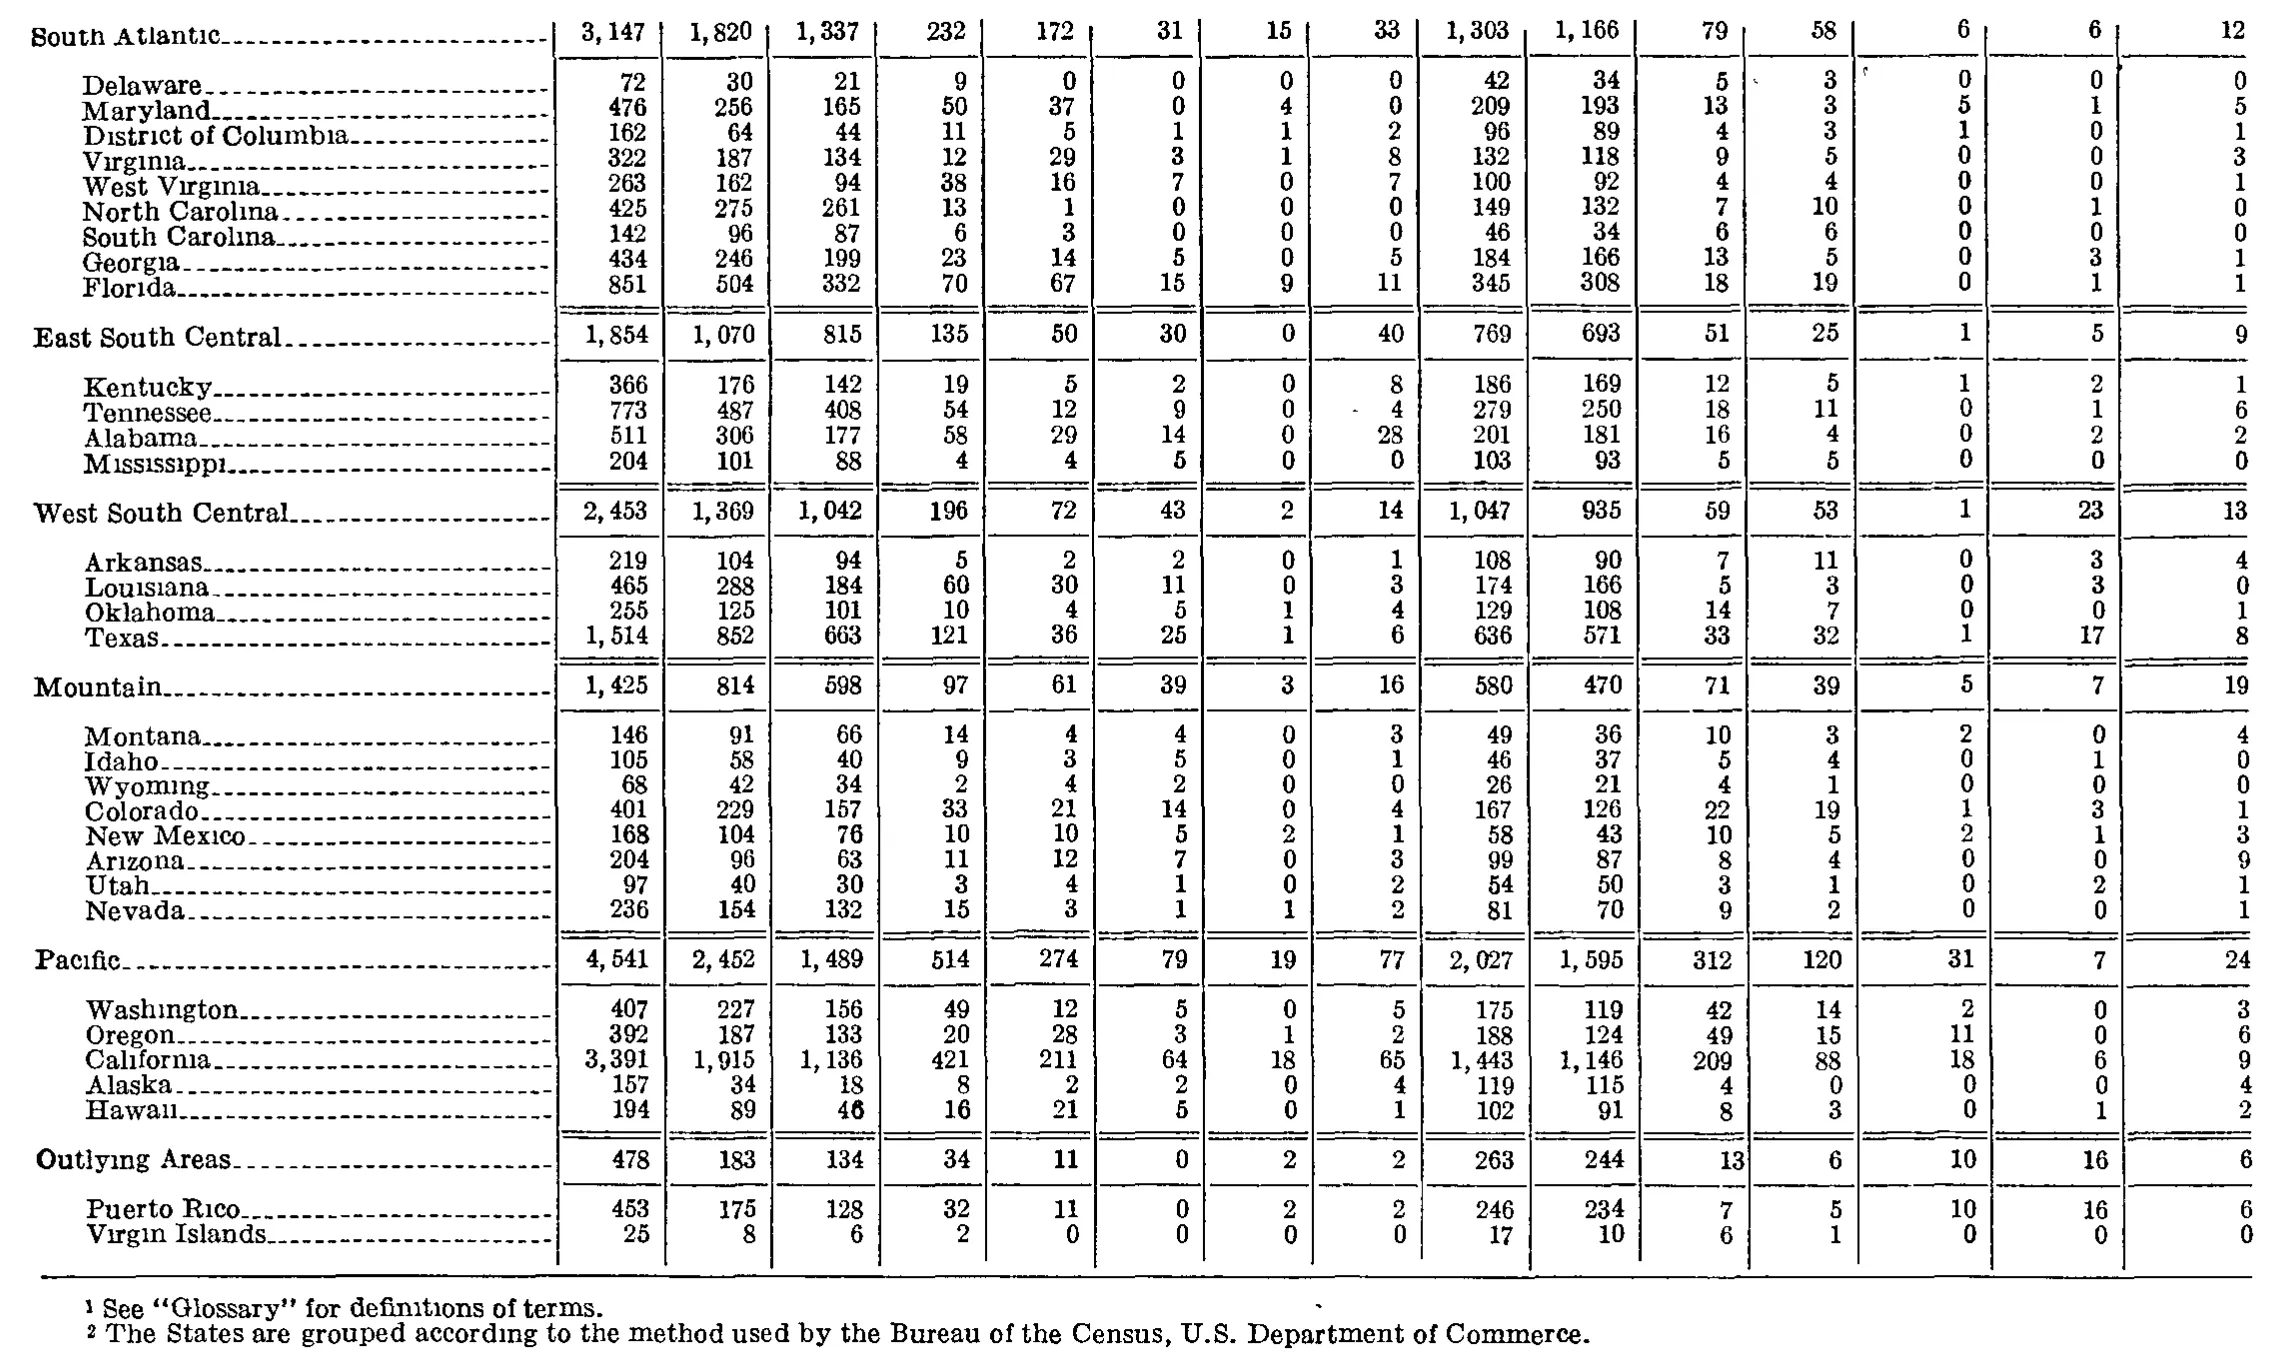
| South Atlantic | 3,147 | 1,820 | 1,337 | 232 | 172 | 31 | 15 | 33 | 1,303 | 1,166 | 79 | 58 | 6 | 6 | 12 |
| Delaware | 72 | 30 | 21 | 9 | 0 | 0 | 0 | 0 | 42 | 34 | 5 | 3 | 0 | 0 | 0 |
| Maryland | 476 | 256 | 165 | 50 | 37 | 0 | 4 | 0 | 209 | 193 | 13 | 3 | 5 | 1 | 5 |
| District of Columbia | 162 | 64 | 44 | 11 | 5 | 1 | 1 | 2 | 96 | 89 | 4 | 3 | 1 | 0 | 1 |
| Virginia | 322 | 187 | 134 | 12 | 29 | 3 | 1 | 8 | 132 | 118 | 9 | 5 | 0 | 0 | 3 |
| West Virginia | 263 | 162 | 94 | 38 | 16 | 7 | 0 | 7 | 100 | 92 | 4 | 4 | 0 | 0 | 1 |
| North Carolina | 425 | 275 | 261 | 13 | 1 | 0 | 0 | 0 | 149 | 132 | 7 | 10 | 0 | 1 | 1 |
| South Carolina | 142 | 96 | 87 | 6 | 3 | 0 | 0 | 0 | 46 | 34 | 6 | 6 | 0 | 0 | 0 |
| Georgia | 434 | 246 | 199 | 23 | 14 | 5 | 0 | 5 | 184 | 166 | 13 | 5 | 0 | 3 | 1 |
| Florida | 851 | 504 | 332 | 70 | 67 | 15 | 9 | 11 | 345 | 308 | 18 | 19 | 0 | 1 | 1 |
| East South Central | 1,854 | 1,070 | 815 | 135 | 50 | 30 | 0 | 40 | 769 | 693 | 51 | 25 | 1 | 5 | 9 |
| Kentucky | 366 | 176 | 142 | 19 | 5 | 2 | 0 | 8 | 186 | 169 | 12 | 5 | 1 | 2 | 1 |
| Tennessee | 773 | 487 | 408 | 54 | 12 | 9 | 0 | 4 | 279 | 250 | 18 | 11 | 0 | 1 | 6 |
| Alabama | 511 | 306 | 177 | 58 | 29 | 14 | 0 | 28 | 201 | 181 | 16 | 4 | 0 | 2 | 2 |
| Mississippi | 204 | 101 | 88 | 4 | 4 | 5 | 0 | 0 | 103 | 93 | 5 | 5 | 0 | 0 | 0 |
| West South Central | 2,453 | 1,369 | 1,042 | 196 | 72 | 43 | 2 | 14 | 1,047 | 935 | 59 | 53 | 1 | 23 | 13 |
| Arkansas | 219 | 104 | 94 | 5 | 2 | 2 | 0 | 1 | 108 | 90 | 7 | 11 | 0 | 3 | 4 |
| Louisiana | 465 | 288 | 184 | 60 | 30 | 11 | 0 | 3 | 174 | 166 | 5 | 3 | 0 | 3 | 0 |
| Oklahoma | 255 | 125 | 101 | 10 | 4 | 5 | 1 | 4 | 129 | 108 | 14 | 7 | 0 | 0 | 1 |
| Texas | 1,514 | 852 | 663 | 121 | 36 | 25 | 1 | 6 | 636 | 571 | 33 | 32 | 1 | 17 | 8 |
| Mountain | 1,425 | 814 | 598 | 97 | 61 | 39 | 3 | 16 | 580 | 470 | 71 | 39 | 5 | 7 | 19 |
| Montana | 146 | 91 | 66 | 14 | 4 | 4 | 0 | 3 | 49 | 36 | 10 | 3 | 2 | 0 | 4 |
| Idaho | 105 | 58 | 40 | 9 | 3 | 5 | 0 | 1 | 46 | 37 | 5 | 4 | 0 | 1 | 0 |
| Wyoming | 68 | 42 | 34 | 2 | 4 | 2 | 0 | 0 | 26 | 21 | 4 | 1 | 0 | 0 | 0 |
| Colorado | 401 | 229 | 157 | 33 | 21 | 14 | 0 | 4 | 167 | 126 | 22 | 19 | 1 | 3 | 1 |
| New Mexico | 168 | 104 | 76 | 10 | 10 | 5 | 2 | 1 | 58 | 43 | 10 | 5 | 2 | 1 | 3 |
| Arizona | 204 | 96 | 63 | 11 | 12 | 7 | 0 | 3 | 99 | 87 | 8 | 4 | 0 | 0 | 9 |
| Utah | 97 | 40 | 30 | 3 | 4 | 1 | 0 | 2 | 54 | 50 | 3 | 1 | 0 | 2 | 1 |
| Nevada | 236 | 154 | 132 | 15 | 3 | 1 | 1 | 2 | 81 | 70 | 9 | 2 | 0 | 0 | 1 |
| Pacific | 4,541 | 2,452 | 1,489 | 514 | 274 | 79 | 19 | 77 | 2,027 | 1,595 | 312 | 120 | 31 | 7 | 24 |
| Washington | 407 | 227 | 156 | 49 | 12 | 5 | 0 | 5 | 175 | 119 | 42 | 14 | 2 | 0 | 3 |
| Oregon | 392 | 187 | 133 | 20 | 28 | 3 | 1 | 2 | 188 | 124 | 49 | 15 | 11 | 0 | 6 |
| California | 3,391 | 1,915 | 1,136 | 421 | 211 | 64 | 18 | 65 | 1,443 | 1,146 | 209 | 88 | 18 | 6 | 9 |
| Alaska | 157 | 34 | 18 | 8 | 2 | 2 | 0 | 4 | 119 | 115 | 4 | 0 | 0 | 0 | 4 |
| Hawaii | 194 | 89 | 46 | 16 | 21 | 5 | 0 | 1 | 102 | 91 | 8 | 3 | 0 | 1 | 2 |
| Outlying Areas | 478 | 183 | 134 | 34 | 11 | 0 | 2 | 2 | 263 | 244 | 13 | 6 | 10 | 16 | 6 |
| Puerto Rico | 453 | 175 | 128 | 32 | 11 | 0 | 2 | 2 | 246 | 234 | 7 | 5 | 10 | 16 | 6 |
| Virgin Islands | 25 | 8 | 6 | 2 | 0 | 0 | 0 | 0 | 17 | 10 | 6 | 1 | 0 | 0 | 0 |
- 1 See "Glossary" for definitions of terms.
- 2 The States are grouped according to the method used by the Bureau of the Census, U.S. Department of Commerce.
829 of 830 figures sit in a row or column sum that works out. 2 cells break a sum: 'North Carolina', column 2: prints 425, the subtotals in columns 3 to 16 add to 426; 'South Atlantic', column 16: prints 12, rows 'Delaware' to 'Florida' add to 13.
Reader’s notes
p. 207. 16 columns. The three right-hand columns are tall two-line headings ("Union deauthorization cases" / "UD", "Amendment of certification cases" / "AC", "Unit clarification cases" / "UC"); their descriptive names are placed in the top two header levels and the code letters in the third, so the grid stays rectangular. The stub heading "Division and State^2" and "All cases" each span all three header levels and are repeated accordingly. Hyphenated line breaks repaired in the headings: "Union deauthor-ization cases", "Amend-ment of certifica-tion cases", "Unit clarifica-tion cases". No footnote text is printed on this crop; the markers "^1" (in the excluded caption) and "^2" (on the stub heading) refer to notes that appear elsewhere in the report, so `footnotes` is empty. The table is cut off by the crop at the bottom: the body ends with a double rule after Kansas and the remaining divisions (South Atlantic onward) continue on the following page. Scan-quality notes, all resolved against the printed subtotals (every one of the 15 value columns in each of the four division subtotals, and each state's across-row breakdown, reconciles exactly with the member figures as transcribed): - Connecticut, UD/AC/UC columns: faint and tightly set; read as 3 / 2 / 3. - Kansas, UD column: printed "0" followed by a stray ink dot; transcribed as 0. - Michigan, RD column: the glyph resembles "3S" in the scan; it is 38. - Nebraska, RM and RD columns: a vertical rule artifact crosses the digits; read as 6 and 4. No arithmetic was computed into any cell — the checksums were used only to disambiguate doubtful glyphs. No printed total appears to be misprinted.
p. 208. This crop is a continuation page: no column headings are printed on it, so header_rows is empty. The grid is 16 columns — the stub plus 15 numeric columns — confirmed from the column rules and from every row carrying 15 values. The crop begins mid-table (the earlier census regions and the U.S. total are on the preceding page) and ends with the two footnotes, so the bottom of the table is complete. Arithmetic check of the printed region subtotals against their member states: every one of the 15 columns reconciles exactly for East South Central, West South Central, Mountain, Pacific and Outlying Areas, and 14 of 15 columns reconcile for South Atlantic. The single exception is South Atlantic, last (15th) column: the printed subtotal is 12, but the nine listed states (Delaware 0, Maryland 5, District of Columbia 1, Virginia 3, West Virginia 1, North Carolina 1, South Carolina 0, Georgia 1, Florida 1) sum to 13. I re-read that column on a second pass and the digits are as transcribed; the discrepancy appears to be a misprint in the source, and nothing has been corrected here. Minor scan artifacts, none affecting a value: a stray speck sits between the 11th and 12th columns on the Delaware row, and a short stray dash precedes the 4 in the 8th column on the Tennessee row (the value is 4). "Hawaii" column 3 prints thickly from ink spread but reads 46.
Source image
Source data: U.S. NLRB Annual Reports (public domain). Reconstruction by NLRB Stats Archive. Read by claude-opus-5 (effort max, prompt extract_v1) from the 300-dpi scan; stitched by page. Updated October 2026.