NLRB Stats Archive › Annual Reports › FY1966 › Board case backlog
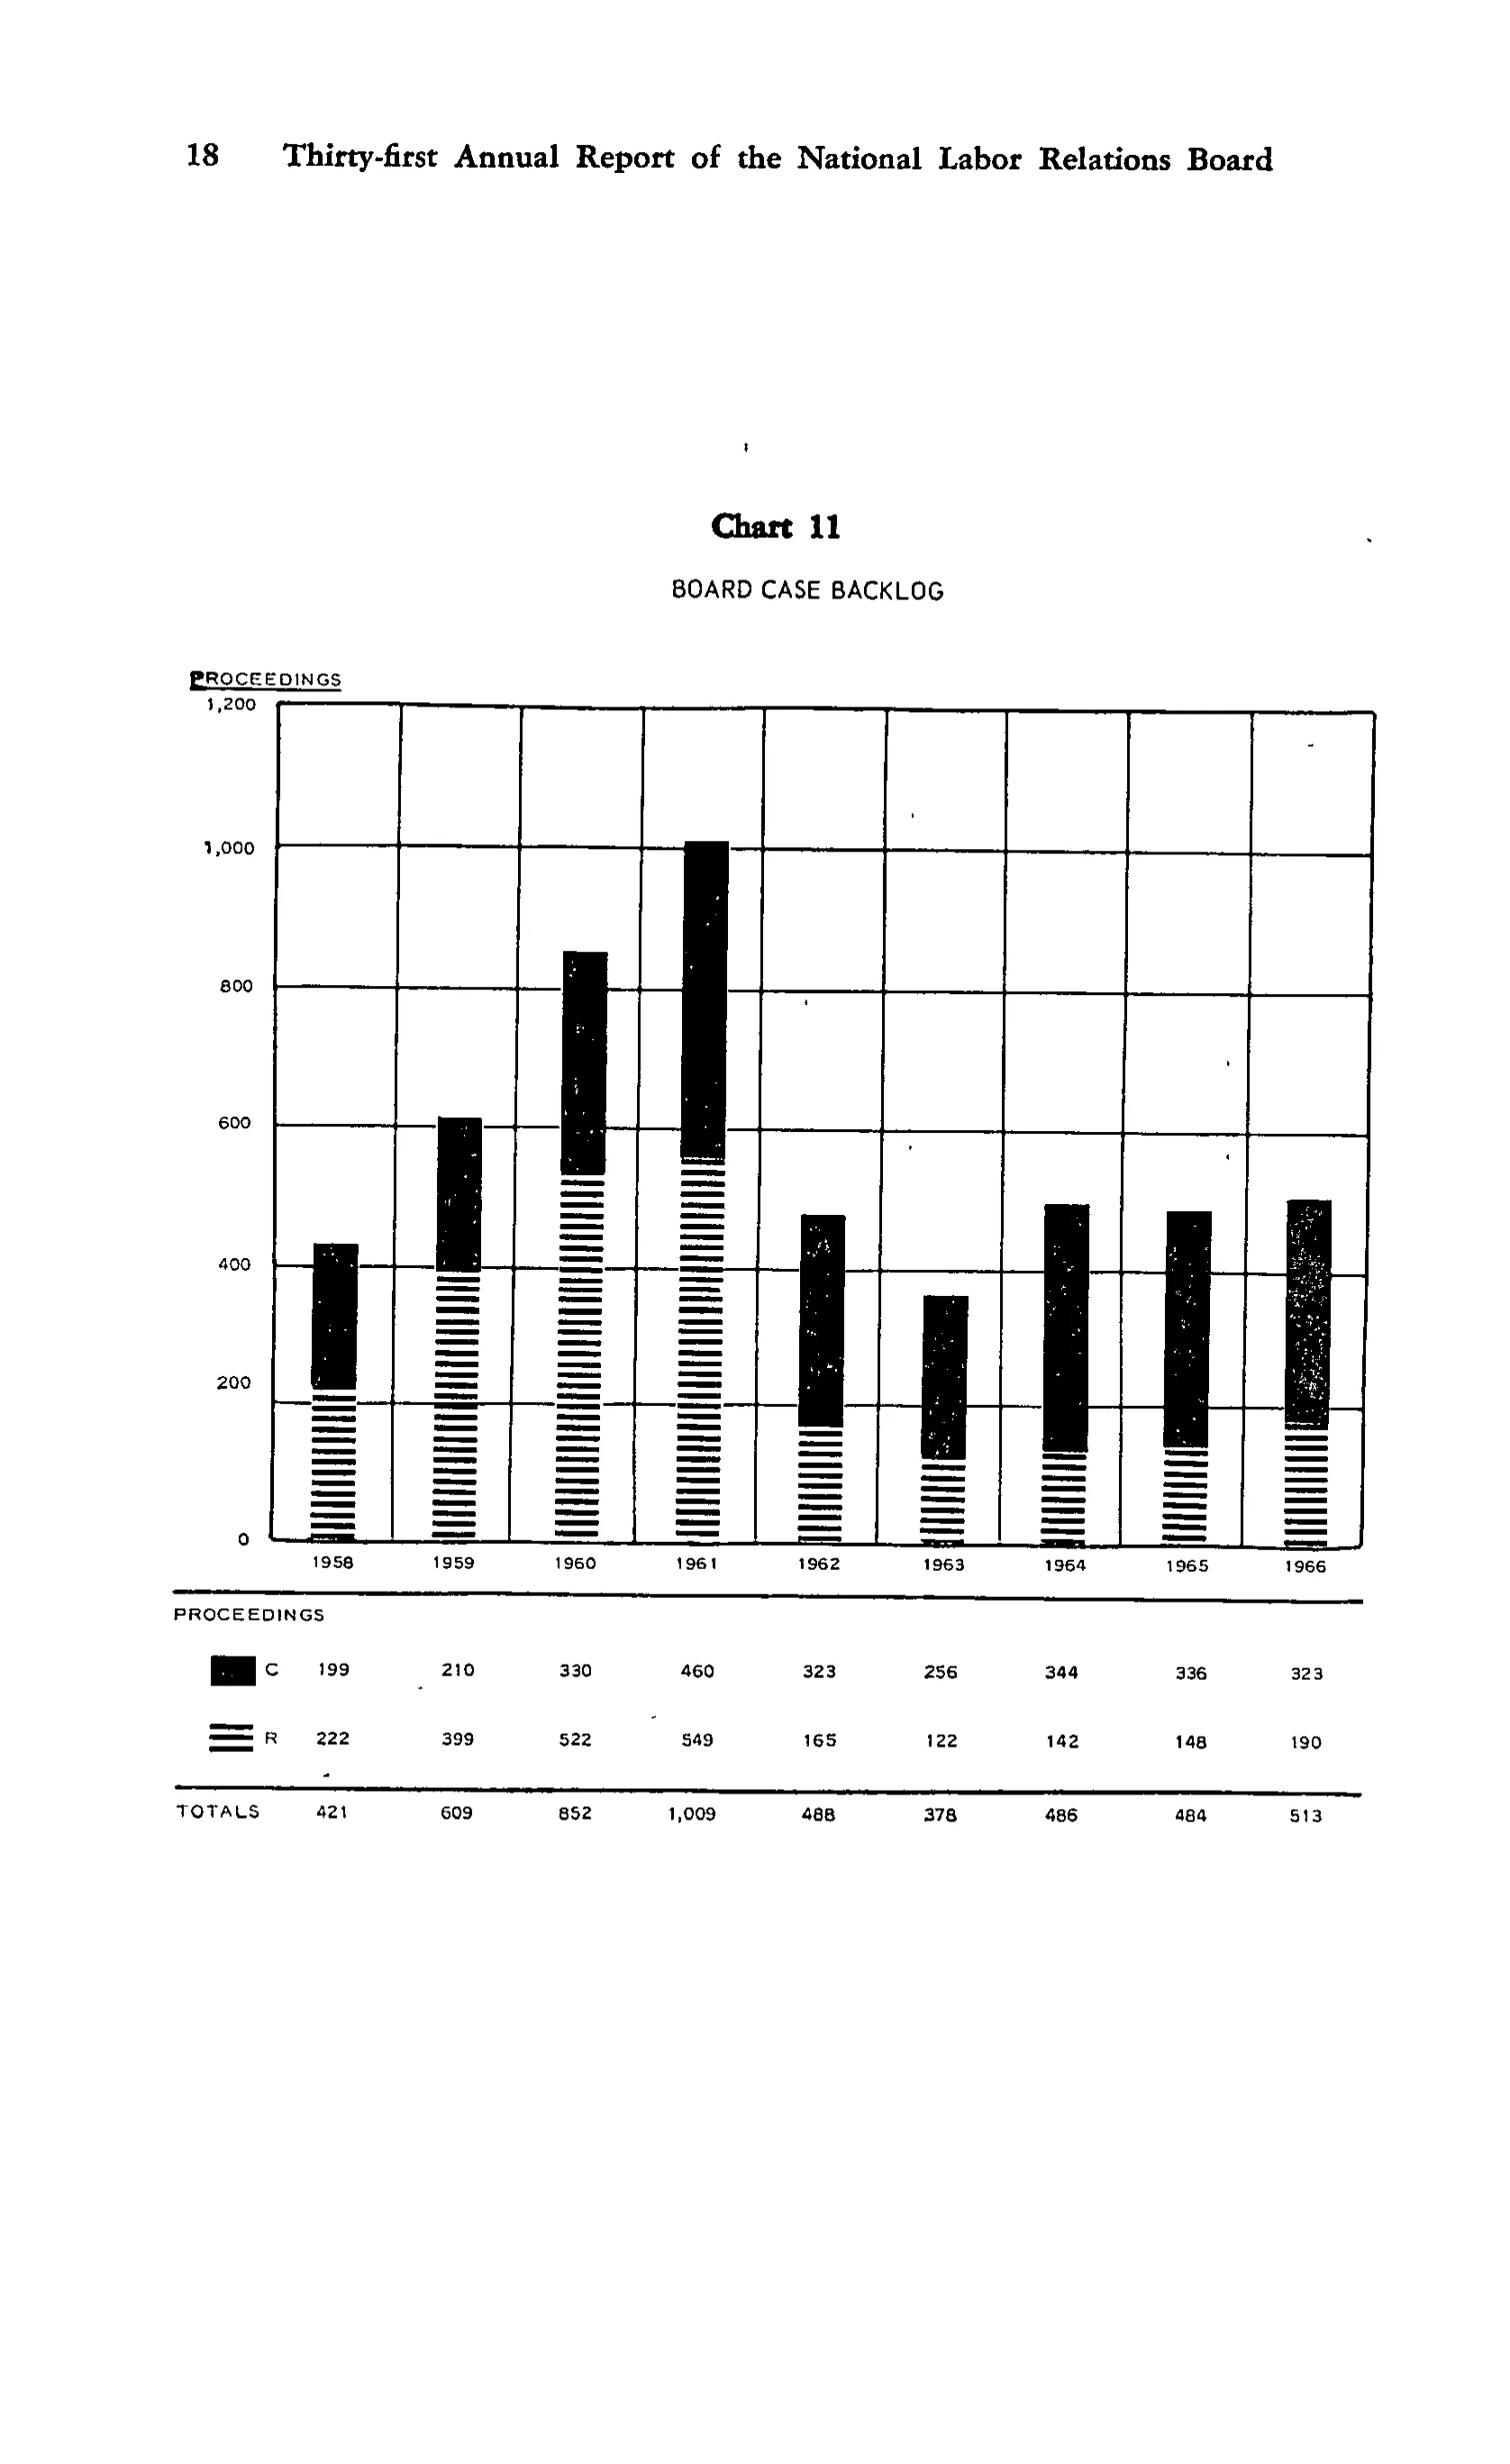
Board case backlog
| PROCEEDINGS | 1958 | 1959 | 1960 | 1961 | 1962 | 1963 | 1964 | 1965 | 1966 |
|---|---|---|---|---|---|---|---|---|---|
| C | 199 | 210 | 330 | 460 | 323 | 256 | 344 | 336 | 323 |
| R | 222 | 399 | 522 | 549 | 165 | 122 | 142 | 148 | 190 |
| TOTALS | 421 | 609 | 852 | 1,009 | 488 | 378 | 486 | 484 | 513 |
27 of 27 figures sit in a row or column sum that works out.
Reader’s notes
p. 31. The crop is Chart 11, "BOARD CASE BACKLOG" (a stacked bar chart), with a small data panel printed below the chart's horizontal axis; that data panel is what is transcribed here. The column headings 1958-1966 are the chart's x-axis year labels, which sit directly above and align with the data panel's columns; "PROCEEDINGS" is printed as the stub heading of the data panel on its own line below the year labels. In the printed panel each of the rows "C" and "R" is preceded by a small legend swatch (a solid black box for C, a horizontally striped box for R) keyed to the bar shading; those swatches are legend symbols, not text, and are not transcribed. The word "PROCEEDINGS" also appears a second time at the upper left of the chart as the vertical-axis label (above the 1,200 tick); that occurrence belongs to the chart, not the table. All nine printed TOTALS equal C + R as printed, so no misprint is suspected. All digits are legible; the only slightly soft figures are 1961 R ("549") and 1960 TOTALS ("852"), both of which are confirmed by the column sums.
Source image
Source data: U.S. NLRB Annual Reports (public domain). Reconstruction by NLRB Stats Archive. Read by claude-opus-5 (effort max, prompt extract_v1) from the 300-dpi scan; stitched by page. Updated October 2026.