NLRB Stats Archive › Annual Reports › FY1966 › Time required to process representation cases
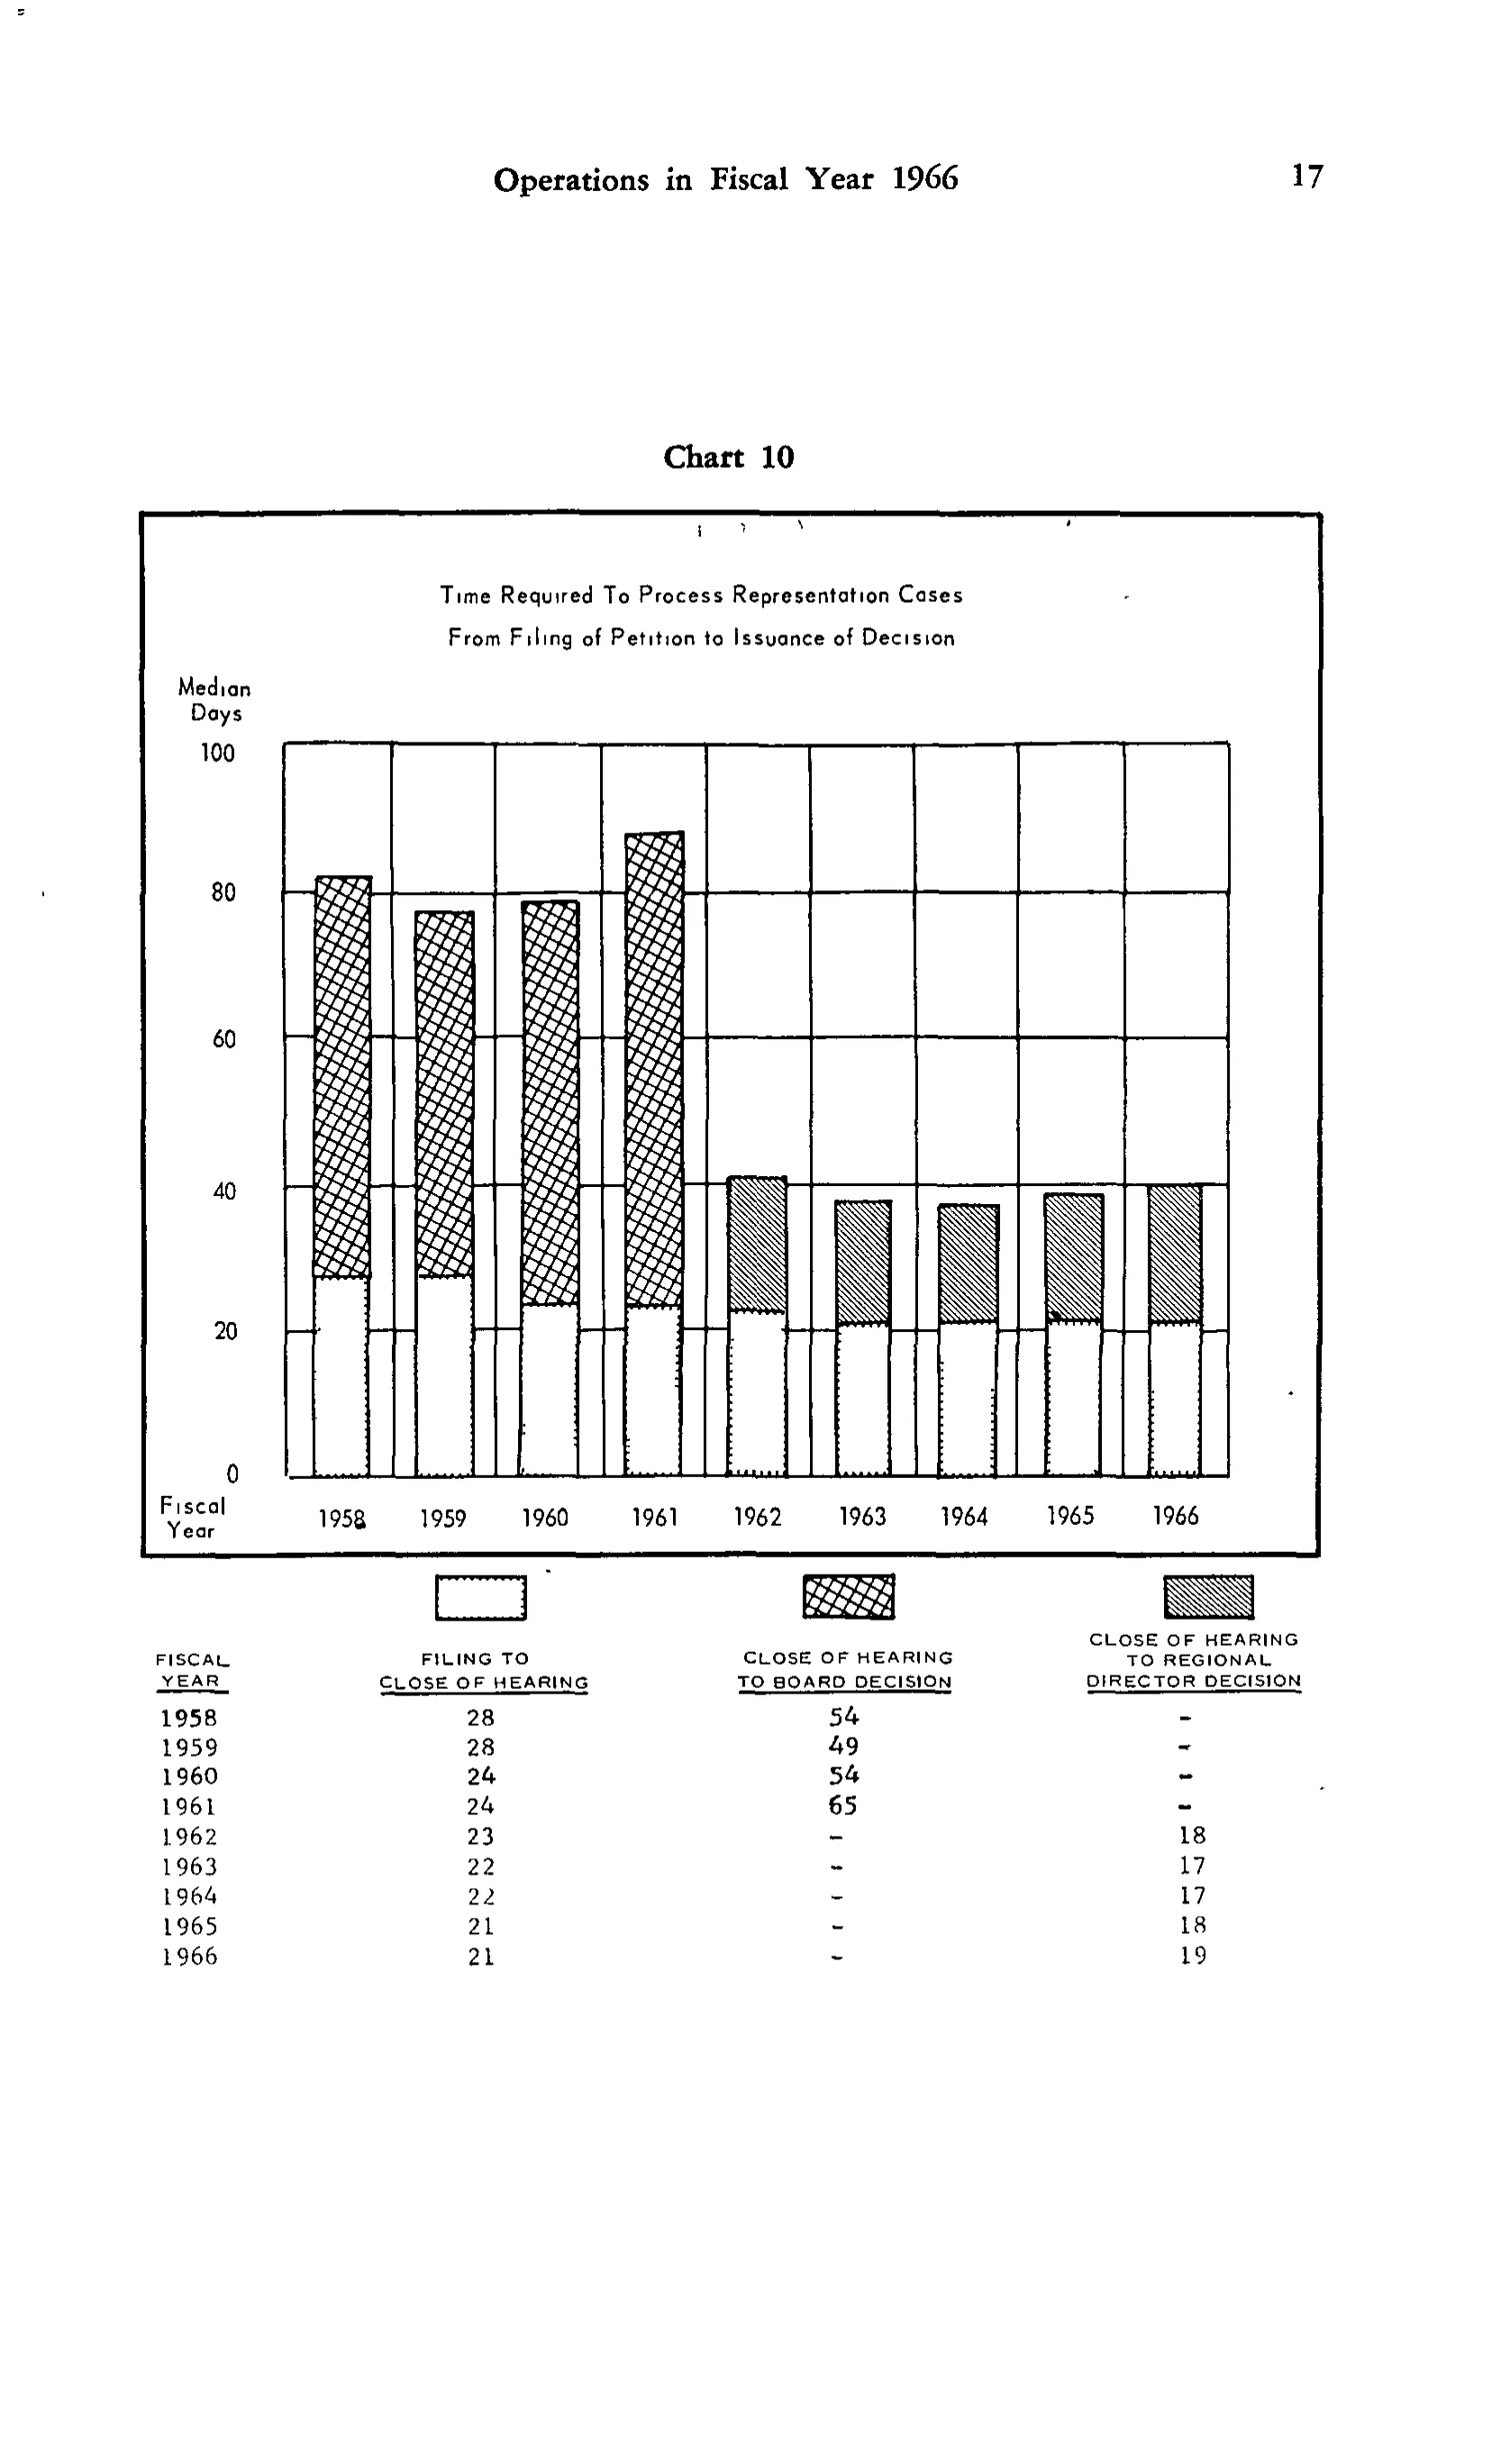
Time required to process representation cases
| FISCAL YEAR | FILING TO CLOSE OF HEARING | CLOSE OF HEARING TO BOARD DECISION | CLOSE OF HEARING TO REGIONAL DIRECTOR DECISION |
|---|---|---|---|
| 1958 | 28 | 54 | |
| 1959 | 28 | 49 | |
| 1960 | 24 | 54 | |
| 1961 | 24 | 65 | |
| 1962 | 23 | 18 | |
| 1963 | 22 | 17 | |
| 1964 | 22 | 17 | |
| 1965 | 21 | 18 | |
| 1966 | 21 | 19 |
0 of 18 figures sit in a row or column sum that works out.
Reader’s notes
p. 30. The crop is Chart 10 ("Time Required To Process Representation Cases From Filing of Petition to Issuance of Decision"), a stacked bar chart of median days by fiscal year, with a small data table printed underneath it; only that data table is transcribed. Immediately above the column headings the page prints three pattern swatches (the chart legend) tying each column to a bar segment; these are graphics, not text, so no row is given for them. The headings are printed in two or three lines each (FISCAL / YEAR; FILING TO / CLOSE OF HEARING; CLOSE OF HEARING / TO BOARD DECISION; CLOSE OF HEARING / TO REGIONAL / DIRECTOR DECISION) and have been joined. In the "CLOSE OF HEARING TO REGIONAL DIRECTOR DECISION" column for 1958-1961 and in the "CLOSE OF HEARING TO BOARD DECISION" column for 1962-1966 the page prints a short dash meaning no data; these are given as "". The dashes for 1958-1961 in the last column are faint and slightly irregular in the scan but are clearly dashes, not digits. The chart's y-axis ("Median Days", 0 to 100) and x-axis year labels are chart apparatus and are not transcribed as table cells.
Source image
Source data: U.S. NLRB Annual Reports (public domain). Reconstruction by NLRB Stats Archive. Read by claude-opus-5 (effort max, prompt extract_v1) from the 300-dpi scan; stitched by page. Updated October 2026.