NLRB Stats Archive › Annual Reports › FY1966 › Unfair labor practice merit factor
Unfair labor practice merit factor
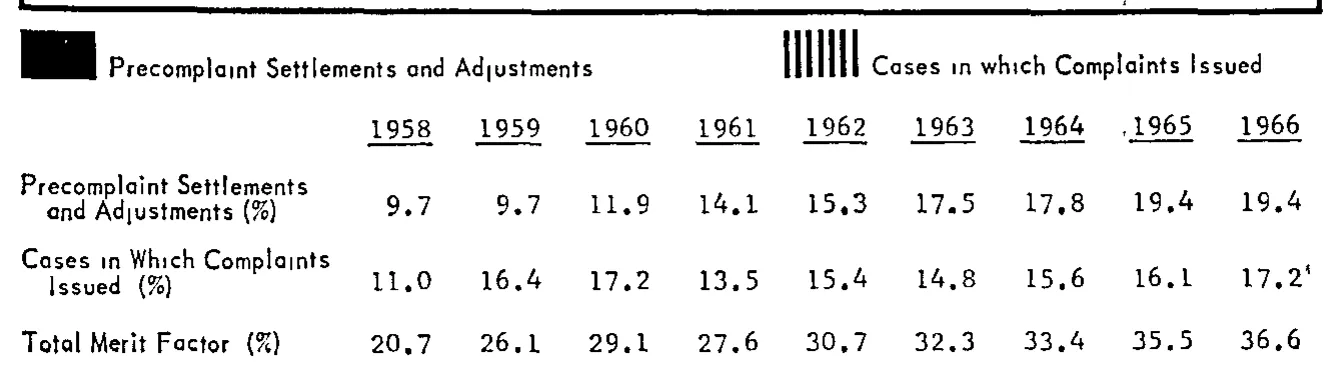
| 1958 | 1959 | 1960 | 1961 | 1962 | 1963 | 1964 | 1965 | 1966 | |
|---|---|---|---|---|---|---|---|---|---|
| Precomplaint Settlements and Adjustments (%) | 9.7 | 9.7 | 11.9 | 14.1 | 15.3 | 17.5 | 17.8 | 19.4 | 19.4 |
| Cases in Which Complaints Issued (%) | 11.0 | 16.4 | 17.2 | 13.5 | 15.4 | 14.8 | 15.6 | 16.1 | 17.2 |
| Total Merit Factor (%) | 20.7 | 26.1 | 29.1 | 27.6 | 30.7 | 32.3 | 33.4 | 35.5 | 36.6 |
Reader’s notes
p. 24. This crop is the data table printed beneath a bar chart; the bottom rule of the chart itself is clipped at the top edge of the image. Between that rule and the year headings there is a chart legend (a solid black swatch labelled "Precomplaint Settlements and Adjustments" and a vertically hatched swatch labelled "Cases in which Complaints Issued"); it is a key to the chart, not a column heading, so it is not included in header_rows. The stub column has no printed heading. A small raised tick is visible immediately after "17.2" in the 1966 column of the "Cases in Which Complaints Issued (%)" row; no footnote is printed under the table, and the column sums (19.4 + 17.2 = 36.6) confirm the value is 17.2, so the mark is most likely a scan artifact and has been omitted from the cell. Scan quality is poor in places: the decimal points often read as commas (e.g. "9,7", "20,7") and the dotted i's in "in"/"Which" are faint; values transcribed with decimal points as intended. All three rows are internally consistent (each Total Merit Factor equals the sum of the two rows above it).
Source image
Source data: U.S. NLRB Annual Reports (public domain). Reconstruction by NLRB Stats Archive. Read by claude-opus-5 (effort max, prompt extract_v1) from the 300-dpi scan; stitched by page. Updated October 2026.