NLRB Stats Archive › Annual Reports › FY1965 › Distribution of Unfair Labor Practice Situations Received, by Number of Employees in Establishment, Fiscal Year 1965
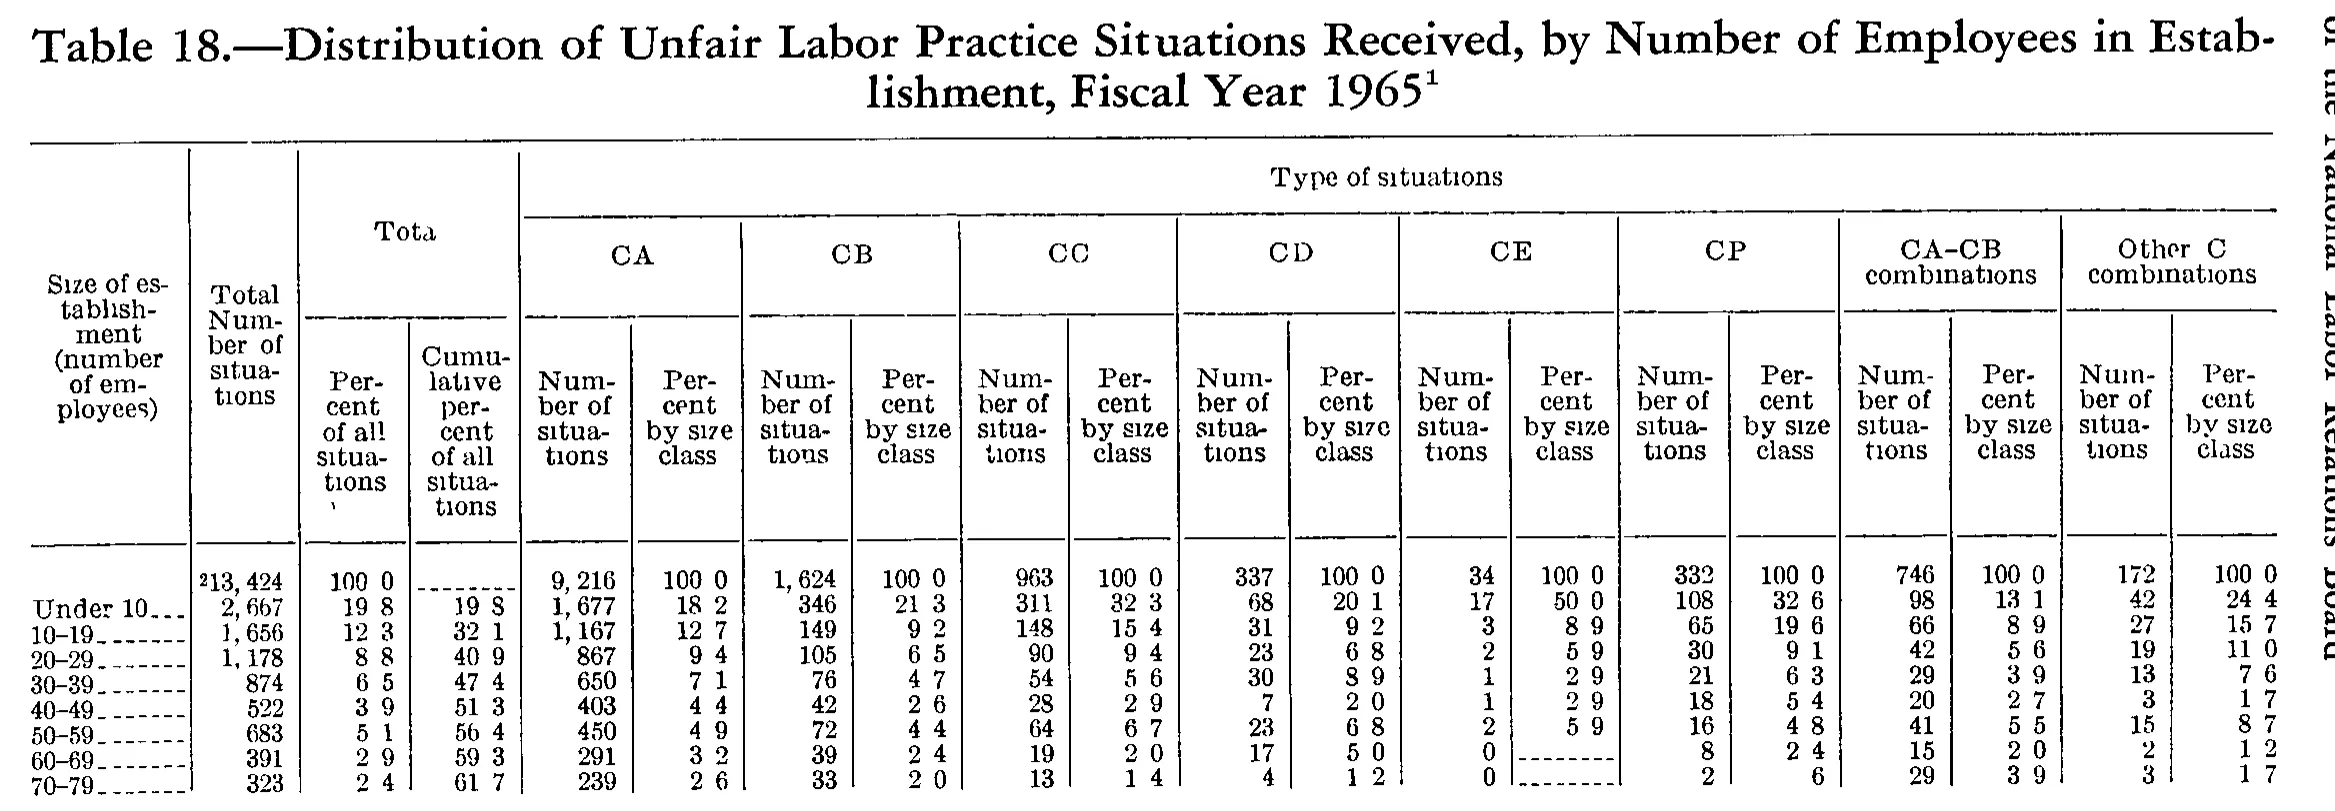
Distribution of Unfair Labor Practice Situations Received, by Number of Employees in Establishment, Fiscal Year 1965
Stitched from pp. 223–224.
| Size of establishment (number of employees) | Total Number of situations | Total | Type of situations | ||||||||||||||||
|---|---|---|---|---|---|---|---|---|---|---|---|---|---|---|---|---|---|---|---|
| Size of establishment (number of employees) | Total Number of situations | Total | CA | CB | CC | CD | CE | CP | CA-CB combinations | Other C combinations | |||||||||
| Size of establishment (number of employees) | Total Number of situations | Percent of all situations | Cumulative percent of all situations | Number of situations | Percent by size class | Number of situations | Percent by size class | Number of situations | Percent by size class | Number of situations | Percent by size class | Number of situations | Percent by size class | Number of situations | Percent by size class | Number of situations | Percent by size class | Number of situations | Percent by size class |
| 13,424 | 100.0 | 9,216 | 100.0 | 1,624 | 100.0 | 963 | 100.0 | 337 | 100.0 | 34 | 100.0 | 332 | 100.0 | 746 | 100.0 | 172 | 100.0 | ||
| Under 10 | 2,667 | 19.8 | 19.8 | 1,677 | 18.2 | 346 | 21.3 | 311 | 32.3 | 68 | 20.1 | 17 | 50.0 | 108 | 32.6 | 98 | 13.1 | 42 | 24.4 |
| 10-19 | 1,656 | 12.3 | 32.1 | 1,167 | 12.7 | 149 | 9.2 | 148 | 15.4 | 31 | 9.2 | 3 | 8.9 | 65 | 19.6 | 66 | 8.9 | 27 | 15.7 |
| 20-29 | 1,178 | 8.8 | 40.9 | 867 | 9.4 | 105 | 6.5 | 90 | 9.4 | 23 | 6.8 | 2 | 5.9 | 30 | 9.1 | 42 | 5.6 | 19 | 11.0 |
| 30-39 | 874 | 6.5 | 47.4 | 650 | 7.1 | 76 | 4.7 | 54 | 5.6 | 30 | 8.9 | 1 | 2.9 | 21 | 6.3 | 29 | 3.9 | 13 | 7.6 |
| 40-49 | 522 | 3.9 | 51.3 | 403 | 4.4 | 42 | 2.6 | 28 | 2.9 | 7 | 2.0 | 1 | 2.9 | 18 | 5.4 | 20 | 2.7 | 3 | 1.7 |
| 50-59 | 683 | 5.1 | 56.4 | 450 | 4.9 | 72 | 4.4 | 64 | 6.7 | 23 | 6.8 | 2 | 5.9 | 16 | 4.8 | 41 | 5.5 | 15 | 8.7 |
| 60-69 | 391 | 2.9 | 59.3 | 291 | 3.2 | 39 | 2.4 | 19 | 2.0 | 17 | 5.0 | 0 | 8 | 2.4 | 15 | 2.0 | 2 | 1.2 | |
| 70-79 | 323 | 2.4 | 61.7 | 239 | 2.6 | 33 | 2.0 | 13 | 1.4 | 4 | 1.2 | 0 | 2 | .6 | 29 | 3.9 | 3 | 1.7 | |
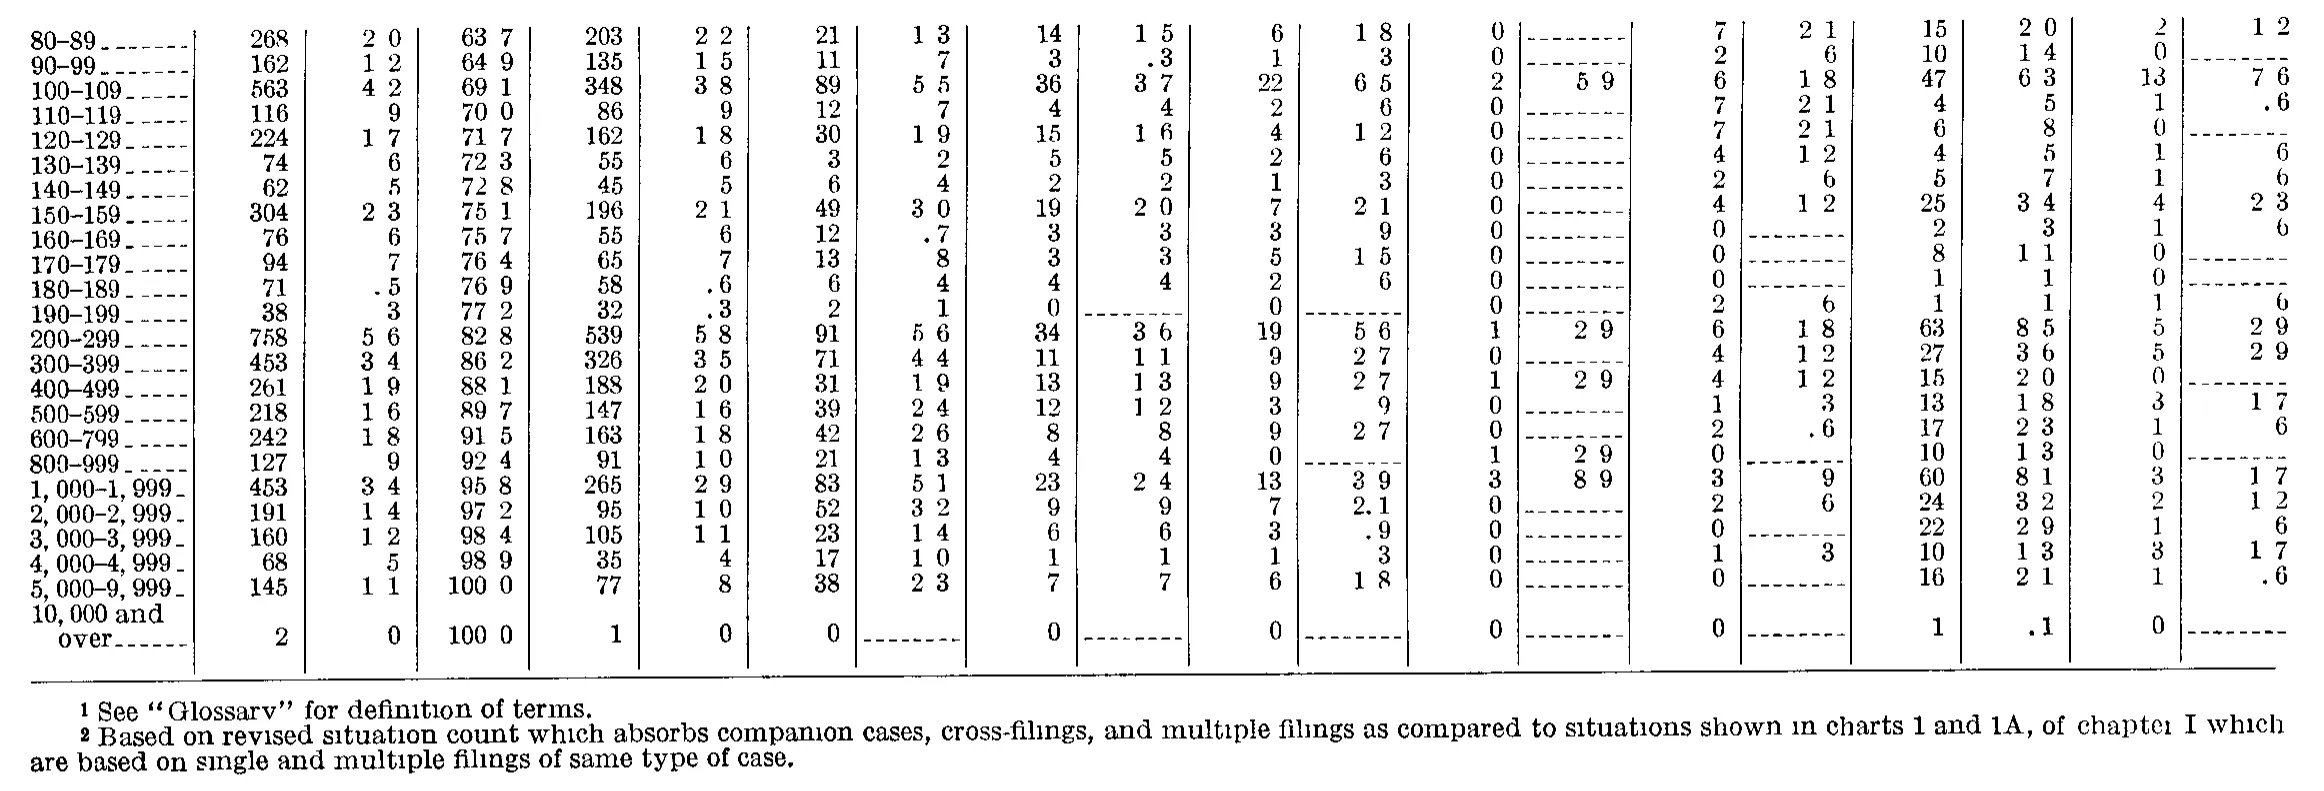
| 80-89 | 268 | 2.0 | 63.7 | 203 | 2.2 | 21 | 1.3 | 14 | 1.5 | 6 | 1.8 | 0 | 7 | 2.1 | 15 | 2.0 | 2 | 1.2 | |
| 90-99 | 162 | 1.2 | 64.9 | 135 | 1.5 | 11 | .7 | 3 | .3 | 1 | .3 | 0 | 2 | .6 | 10 | 1.4 | 0 | ||
| 100-109 | 563 | 4.2 | 69.1 | 348 | 3.8 | 89 | 5.5 | 36 | 3.7 | 22 | 6.5 | 2 | 5.9 | 6 | 1.8 | 47 | 6.3 | 13 | 7.6 |
| 110-119 | 116 | .9 | 70.0 | 86 | .9 | 12 | .7 | 4 | .4 | 2 | .6 | 0 | 7 | 2.1 | 4 | .5 | 1 | .6 | |
| 120-129 | 224 | 1.7 | 71.7 | 162 | 1.8 | 30 | 1.9 | 15 | 1.6 | 4 | 1.2 | 0 | 7 | 2.1 | 6 | .8 | 0 | ||
| 130-139 | 74 | .6 | 72.3 | 55 | .6 | 3 | .2 | 5 | .5 | 2 | .6 | 0 | 4 | 1.2 | 4 | .5 | 1 | .6 | |
| 140-149 | 62 | .5 | 72.8 | 45 | .5 | 6 | .4 | 2 | .2 | 1 | .3 | 0 | 2 | .6 | 5 | .7 | 1 | .6 | |
| 150-159 | 304 | 2.3 | 75.1 | 196 | 2.1 | 49 | 3.0 | 19 | 2.0 | 7 | 2.1 | 0 | 4 | 1.2 | 25 | 3.4 | 4 | 2.3 | |
| 160-169 | 76 | .6 | 75.7 | 55 | .6 | 12 | .7 | 3 | .3 | 3 | .9 | 0 | 0 | 2 | .3 | 1 | .6 | ||
| 170-179 | 94 | .7 | 76.4 | 65 | .7 | 13 | .8 | 3 | .3 | 5 | 1.5 | 0 | 0 | 8 | 1.1 | 0 | |||
| 180-189 | 71 | .5 | 76.9 | 58 | .6 | 6 | .4 | 4 | .4 | 2 | .6 | 0 | 0 | 1 | .1 | 0 | |||
| 190-199 | 38 | .3 | 77.2 | 32 | .3 | 2 | .1 | 0 | 0 | 0 | 2 | .6 | 1 | .1 | 1 | .6 | |||
| 200-299 | 758 | 5.6 | 82.8 | 539 | 5.8 | 91 | 5.6 | 34 | 3.6 | 19 | 5.6 | 1 | 2.9 | 6 | 1.8 | 63 | 8.5 | 5 | 2.9 |
| 300-399 | 453 | 3.4 | 86.2 | 326 | 3.5 | 71 | 4.4 | 11 | 1.1 | 9 | 2.7 | 0 | 4 | 1.2 | 27 | 3.6 | 5 | 2.9 | |
| 400-499 | 261 | 1.9 | 88.1 | 188 | 2.0 | 31 | 1.9 | 13 | 1.3 | 9 | 2.7 | 1 | 2.9 | 4 | 1.2 | 15 | 2.0 | 0 | |
| 500-599 | 218 | 1.6 | 89.7 | 147 | 1.6 | 39 | 2.4 | 12 | 1.2 | 3 | .9 | 0 | 1 | .3 | 13 | 1.8 | 3 | 1.7 | |
| 600-799 | 242 | 1.8 | 91.5 | 163 | 1.8 | 42 | 2.6 | 8 | .8 | 9 | 2.7 | 0 | 2 | .6 | 17 | 2.3 | 1 | .6 | |
| 800-999 | 127 | .9 | 92.4 | 91 | 1.0 | 21 | 1.3 | 4 | .4 | 0 | 1 | 2.9 | 0 | 10 | 1.3 | 0 | |||
| 1,000-1,999 | 453 | 3.4 | 95.8 | 265 | 2.9 | 83 | 5.1 | 23 | 2.4 | 13 | 3.9 | 3 | 8.9 | 3 | .9 | 60 | 8.1 | 3 | 1.7 |
| 2,000-2,999 | 191 | 1.4 | 97.2 | 95 | 1.0 | 52 | 3.2 | 9 | .9 | 7 | 2.1 | 0 | 2 | .6 | 24 | 3.2 | 2 | 1.2 | |
| 3,000-3,999 | 160 | 1.2 | 98.4 | 105 | 1.1 | 23 | 1.4 | 6 | .6 | 3 | .9 | 0 | 0 | 22 | 2.9 | 1 | .6 | ||
| 4,000-4,999 | 68 | .5 | 98.9 | 35 | .4 | 17 | 1.0 | 1 | .1 | 1 | .3 | 0 | 1 | .3 | 10 | 1.3 | 3 | 1.7 | |
| 5,000-9,999 | 145 | 1.1 | 100.0 | 77 | .8 | 38 | 2.3 | 7 | .7 | 6 | 1.8 | 0 | 0 | 16 | 2.1 | 1 | .6 | ||
| 10,000 and over | 2 | 0 | 100.0 | 1 | 0 | 0 | 0 | 0 | 0 | 0 | 1 | .1 | 0 | ||||||
- 1 See "Glossary" for definition of terms.
- 2 Based on revised situation count which absorbs companion cases, cross-filings, and multiple filings as compared to situations shown in charts 1 and 1A, of chapter I which are based on single and multiple filings of same type of case.
256 of 256 figures sit in a row or column sum that works out.
Reader’s notes
p. 223. The crop is cut off at the bottom: the body ends mid-table at the "70-79" row (the larger size classes, any "Total"/"Not reported" lines and the printed footnotes are below the crop). Footnote marker 1 is attached to the caption (excluded) and marker 2 to 13,424 in the first row; neither footnote text is visible on this image, so `footnotes` is empty. Column count is 20: stub, "Total Number of situations", the two "Total" percent columns, then eight type-of-situation panels of two columns each (CA, CB, CC, CD, CE, CP, CA-CB combinations, Other C combinations). First body row (the all-sizes total line, 13,424^2) has no printed row label in the stub column on this crop, so cell 0 is "". Its "Cumulative percent of all situations" cell is a dash rule and is transcribed as "". The CE "Percent by size class" cells for "60-69" and "70-79" are likewise dash rules ("") beside a printed 0. The scan is 1-bit and has dropped nearly all small dots (note the dotless "sıtuatıons" throughout the headings): decimal points in the percent columns do not survive, printing as "100 0", "19 8", "12 3". I have restored them as "100.0", "19.8", "12.3", etc., the same way a comma-space is closed up. The "Total" spanner over the two percent columns images as "Tota" (terminal l faint) and is transcribed "Total"; "Percent by sı7c class" over CD is the same heading as the other panels ("Percent by size class"). "70-79" / CP "Percent by size class" images as a bare "6" with the leading point lost; it is read as ".6" (2 of 332 = 0.6 percent, and the column's percents then sum consistently). The "Under 10" cumulative percent images as "19 S" and is read "19.8", matching that row's own percent. Arithmetic checks pass throughout and support the digits: the eight type totals sum to 13,424, and each size-class row's eight type counts sum exactly to its "Total Number of situations" (2,667; 1,656; 1,178; 874; 522; 683; 391; 323). Nothing was computed or corrected — these were used only as verification.
p. 224. CROP / STRUCTURE: This is the tail of a table continued from the preceding page. No column headings are printed on this image, so header_rows is empty. The grid has 20 columns: the stub, then one three-column group (number, percent, cumulative percent) followed by eight two-column groups (number, percent). The size classes below 80 and all total lines are on the earlier page, so the percent columns here do not sum to 100 within this crop (the cumulative-percent column enters at 63.7 and reaches 100.0). COLUMN ASSIGNMENT VERIFIED: in all 24 rows the eight "number" columns (cols 4, 6, 8, 10, 12, 14, 16, 18) add exactly to the first number column (col 1) — e.g. 203+21+14+6+0+7+15+2 = 268 for row "80-89" and 539+91+34+19+1+6+63+5 = 758 for row "200-299". No printed total in this crop looks wrong. DECIMAL POINTS: the percent columns are printed to one decimal, but at the resolution the Read tool delivers (the 2,324 px scan is downscaled to 2,000 px) many decimal points are faint or dropped, rendering e.g. "2 0" and "63 7". I have written them as the printed values "2.0" and "63.7". This is not a normalization: the cumulative-percent column confirms the point in every row (63.7 + 1.2 = 64.9, + 4.2 = 69.1, + 0.9 = 70.0, ... + 1.1 = 100.0), and each of the other percent columns is internally consistent against a single implied column base (about 9,227 for col 5; 1,620 for col 7; 960 for col 9; 338 for col 11; 34 for col 13; 333 for col 15; 745 for col 17; 172 for col 19). Leading "." on values under 1 percent is likewise printed but often lost in the downscale. DOUBTFUL CELLS: - Row "160-169", last column (col 19): read as ".6". The glyph is faint and could be mistaken for a dash rule. I resolved it to ".6" because col 18 for that row must be 1 for the row to sum to 76, and every other row with 1 in col 18 prints ".6"; the seven dash rules in that column fall exactly on the seven rows where col 18 is 0. - Row "10,000 and over", cols 2 and 5: read as "0". At this resolution I cannot tell whether the original prints a bare "0" or ".0"; the characters as seen are a single zero. - Row "100-109" col 9 ("3.7") versus row "200-299" col 9 ("3.6"): both second digits are indistinct, and the two are mutually slightly inconsistent against a single column base, so one of them may be off by one in the tenths place. - Cells rendered as a dashed rule ("------") are given as "" per instruction; there are 41 of them, all on rows where the adjacent count is 0. FOOTNOTES: the scan renders footnote 1 as "Glossarv" and footnote 2 as "chaptei"; both are scan artifacts of "Glossary" and "chapter" and I have given the intended words. Footnote markers 1 and 2 are not attached to anything visible in this crop — they refer to headings on the earlier page.
Source image
Source data: U.S. NLRB Annual Reports (public domain). Reconstruction by NLRB Stats Archive. Read by claude-opus-5 (effort max, prompt extract_v1) from the 300-dpi scan; stitched by page. Updated October 2026.