NLRB Stats Archive › Annual Reports › FY1965 › Size of Units in Representation Election Cases Closed, Fiscal Year 1965
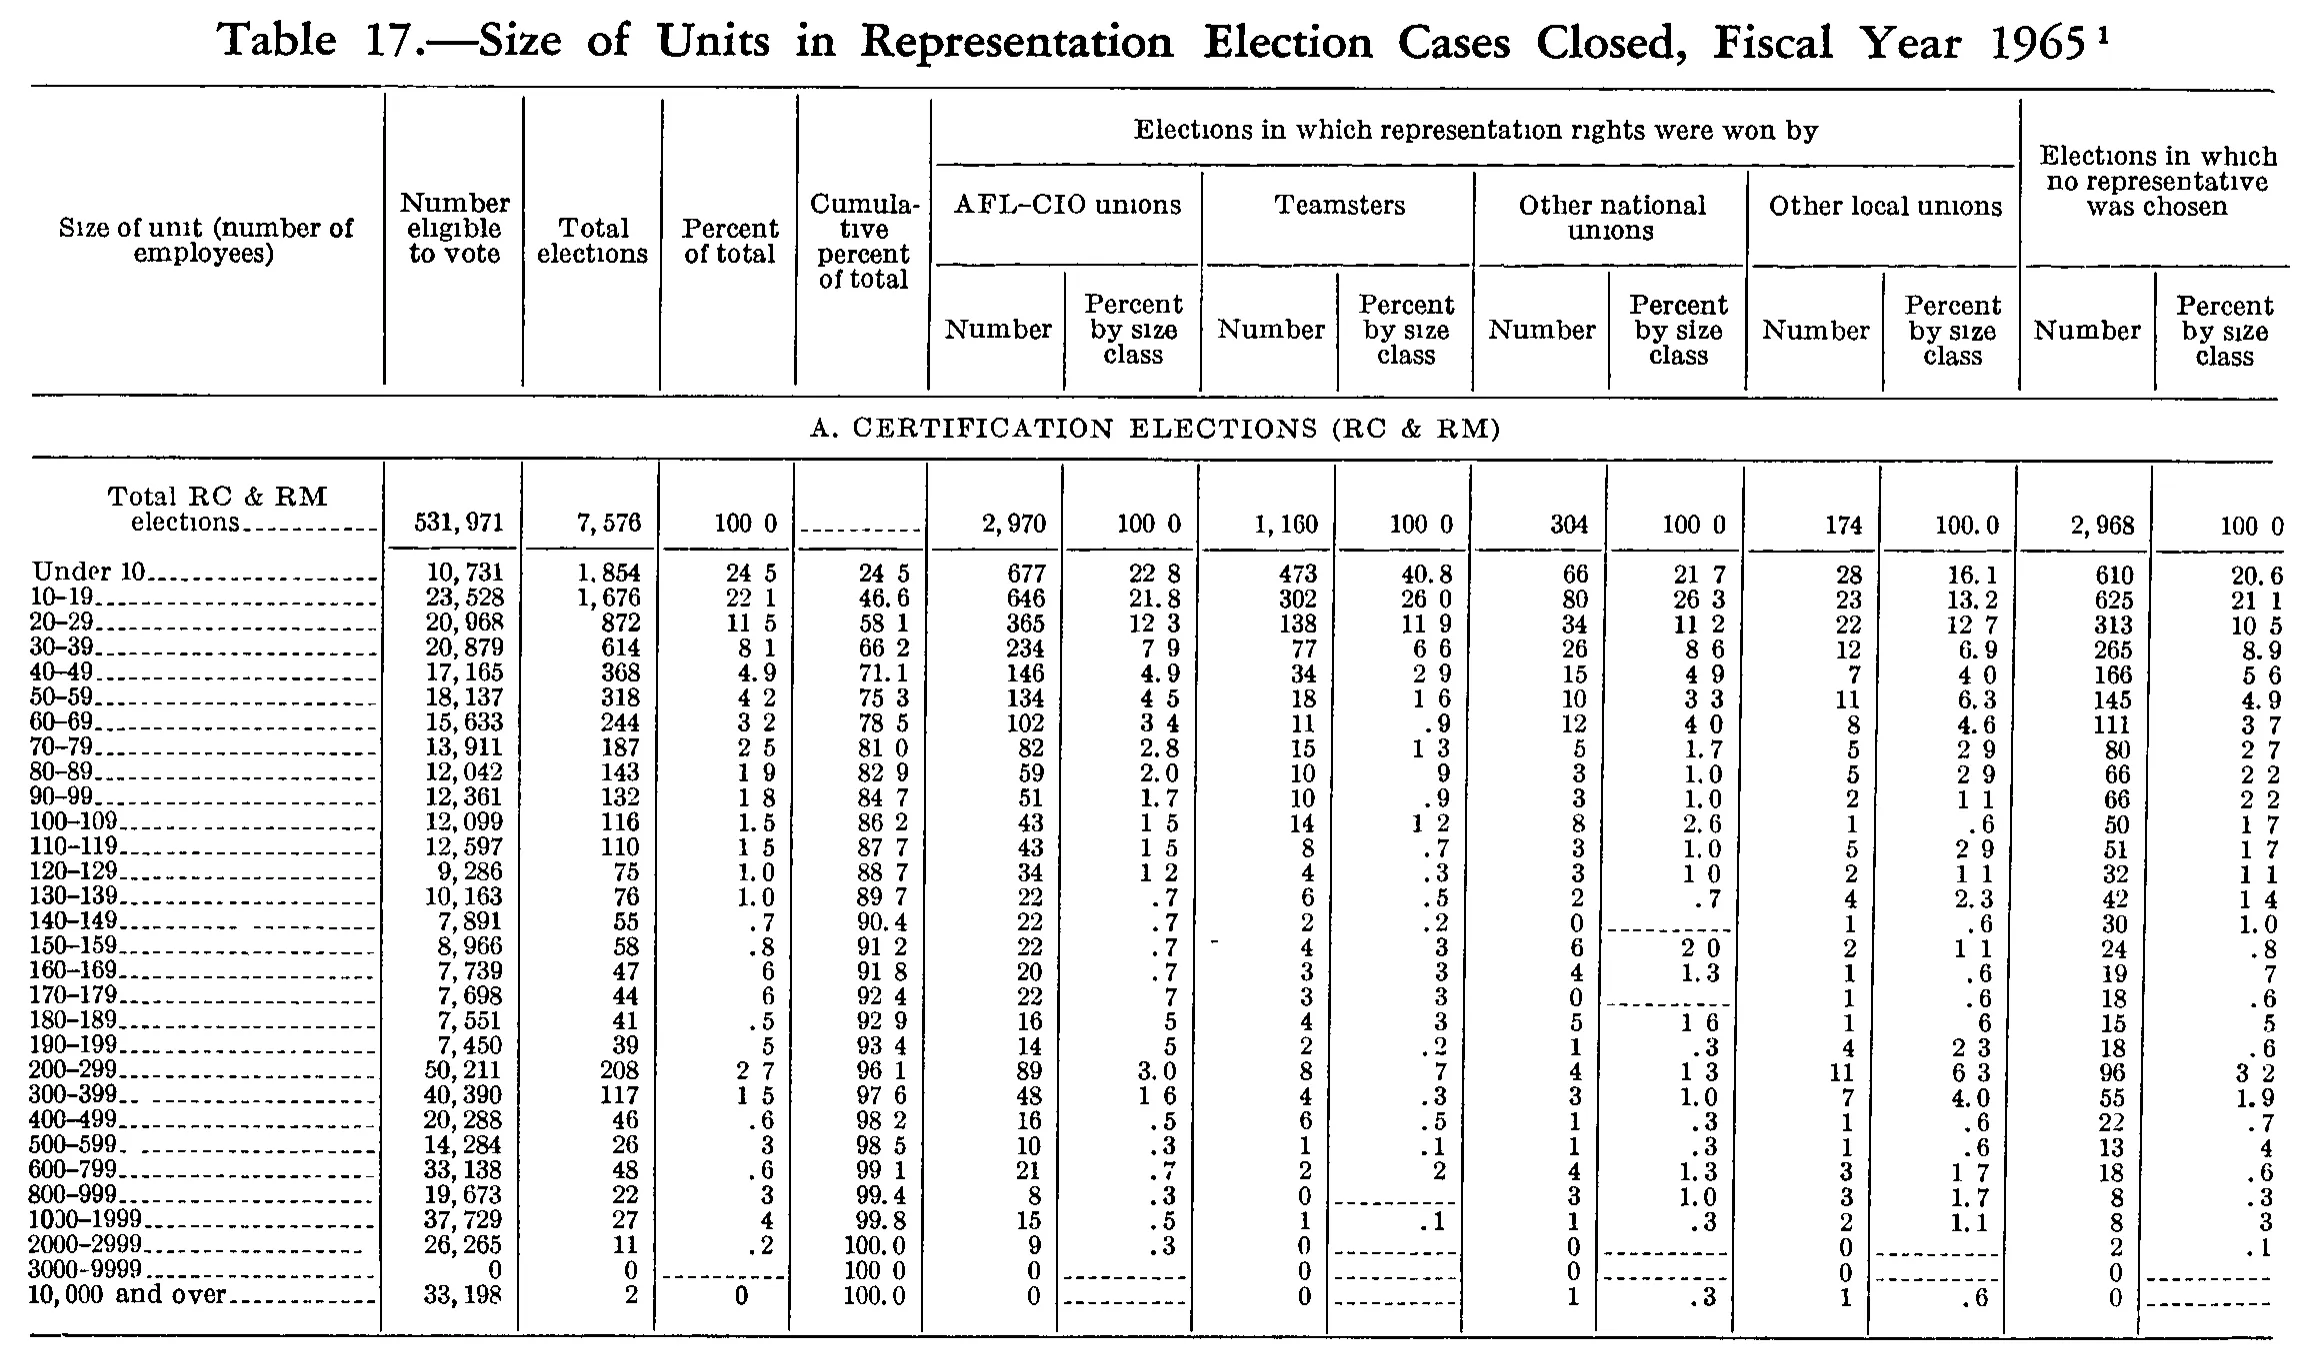
Size of Units in Representation Election Cases Closed, Fiscal Year 1965
Stitched from pp. 221–222.
| Size of unit (number of employees) | Number eligible to vote | Total elections | Percent of total | Cumulative percent of total | Elections in which representation rights were won by | Elections in which no representative was chosen | ||||||||
|---|---|---|---|---|---|---|---|---|---|---|---|---|---|---|
| Size of unit (number of employees) | Number eligible to vote | Total elections | Percent of total | Cumulative percent of total | AFL-CIO unions | Teamsters | Other national unions | Other local unions | Elections in which no representative was chosen | |||||
| Size of unit (number of employees) | Number eligible to vote | Total elections | Percent of total | Cumulative percent of total | Number | Percent by size class | Number | Percent by size class | Number | Percent by size class | Number | Percent by size class | Number | Percent by size class |
| A. CERTIFICATION ELECTIONS (RC & RM) | ||||||||||||||
| Total RC & RM elections | 531,971 | 7,576 | 100.0 | 2,970 | 100.0 | 1,160 | 100.0 | 304 | 100.0 | 174 | 100.0 | 2,968 | 100.0 | |
| Under 10 | 10,731 | 1,854 | 24.5 | 24.5 | 677 | 22.8 | 473 | 40.8 | 66 | 21.7 | 28 | 16.1 | 610 | 20.6 |
| 10-19 | 23,528 | 1,676 | 22.1 | 46.6 | 646 | 21.8 | 302 | 26.0 | 80 | 26.3 | 23 | 13.2 | 625 | 21.1 |
| 20-29 | 20,968 | 872 | 11.5 | 58.1 | 365 | 12.3 | 138 | 11.9 | 34 | 11.2 | 22 | 12.7 | 313 | 10.5 |
| 30-39 | 20,879 | 614 | 8.1 | 66.2 | 234 | 7.9 | 77 | 6.6 | 26 | 8.6 | 12 | 6.9 | 265 | 8.9 |
| 40-49 | 17,165 | 368 | 4.9 | 71.1 | 146 | 4.9 | 34 | 2.9 | 15 | 4.9 | 7 | 4.0 | 166 | 5.6 |
| 50-59 | 18,137 | 318 | 4.2 | 75.3 | 134 | 4.5 | 18 | 1.6 | 10 | 3.3 | 11 | 6.3 | 145 | 4.9 |
| 60-69 | 15,633 | 244 | 3.2 | 78.5 | 102 | 3.4 | 11 | .9 | 12 | 4.0 | 8 | 4.6 | 111 | 3.7 |
| 70-79 | 13,911 | 187 | 2.5 | 81.0 | 82 | 2.8 | 15 | 1.3 | 5 | 1.7 | 5 | 2.9 | 80 | 2.7 |
| 80-89 | 12,042 | 143 | 1.9 | 82.9 | 59 | 2.0 | 10 | .9 | 3 | 1.0 | 5 | 2.9 | 66 | 2.2 |
| 90-99 | 12,361 | 132 | 1.8 | 84.7 | 51 | 1.7 | 10 | .9 | 3 | 1.0 | 2 | 1.1 | 66 | 2.2 |
| 100-109 | 12,099 | 116 | 1.5 | 86.2 | 43 | 1.5 | 14 | 1.2 | 8 | 2.6 | 1 | .6 | 50 | 1.7 |
| 110-119 | 12,597 | 110 | 1.5 | 87.7 | 43 | 1.5 | 8 | .7 | 3 | 1.0 | 5 | 2.9 | 51 | 1.7 |
| 120-129 | 9,286 | 75 | 1.0 | 88.7 | 34 | 1.2 | 4 | .3 | 3 | 1.0 | 2 | 1.1 | 32 | 1.1 |
| 130-139 | 10,163 | 76 | 1.0 | 89.7 | 22 | .7 | 6 | .5 | 2 | .7 | 4 | 2.3 | 42 | 1.4 |
| 140-149 | 7,891 | 55 | .7 | 90.4 | 22 | .7 | 2 | .2 | 0 | 1 | .6 | 30 | 1.0 | |
| 150-159 | 8,966 | 58 | .8 | 91.2 | 22 | .7 | 4 | .3 | 6 | 2.0 | 2 | 1.1 | 24 | .8 |
| 160-169 | 7,739 | 47 | .6 | 91.8 | 20 | .7 | 3 | .3 | 4 | 1.3 | 1 | .6 | 19 | .7 |
| 170-179 | 7,698 | 44 | .6 | 92.4 | 22 | .7 | 3 | .3 | 0 | 1 | .6 | 18 | .6 | |
| 180-189 | 7,551 | 41 | .5 | 92.9 | 16 | .5 | 4 | .3 | 5 | 1.6 | 1 | .6 | 15 | .5 |
| 190-199 | 7,450 | 39 | .5 | 93.4 | 14 | .5 | 2 | .2 | 1 | .3 | 4 | 2.3 | 18 | .6 |
| 200-299 | 50,211 | 208 | 2.7 | 96.1 | 89 | 3.0 | 8 | .7 | 4 | 1.3 | 11 | 6.3 | 96 | 3.2 |
| 300-399 | 40,390 | 117 | 1.5 | 97.6 | 48 | 1.6 | 4 | .3 | 3 | 1.0 | 7 | 4.0 | 55 | 1.9 |
| 400-499 | 20,288 | 46 | .6 | 98.2 | 16 | .5 | 6 | .5 | 1 | .3 | 1 | .6 | 22 | .7 |
| 500-599 | 14,284 | 26 | .3 | 98.5 | 10 | .3 | 1 | .1 | 1 | .3 | 1 | .6 | 13 | .4 |
| 600-799 | 33,138 | 48 | .6 | 99.1 | 21 | .7 | 2 | .2 | 4 | 1.3 | 3 | 1.7 | 18 | .6 |
| 800-999 | 19,673 | 22 | .3 | 99.4 | 8 | .3 | 0 | 3 | 1.0 | 3 | 1.7 | 8 | .3 | |
| 1000-1999 | 37,729 | 27 | .4 | 99.8 | 15 | .5 | 1 | .1 | 1 | .3 | 2 | 1.1 | 8 | .3 |
| 2000-2999 | 26,265 | 11 | .2 | 100.0 | 9 | .3 | 0 | 0 | 0 | 2 | .1 | |||
| 3000-9999 | 0 | 0 | 100.0 | 0 | 0 | 0 | 0 | 0 | ||||||
| 10,000 and over | 33,198 | 2 | 0 | 100.0 | 0 | 0 | 1 | .3 | 1 | .6 | 0 | |||
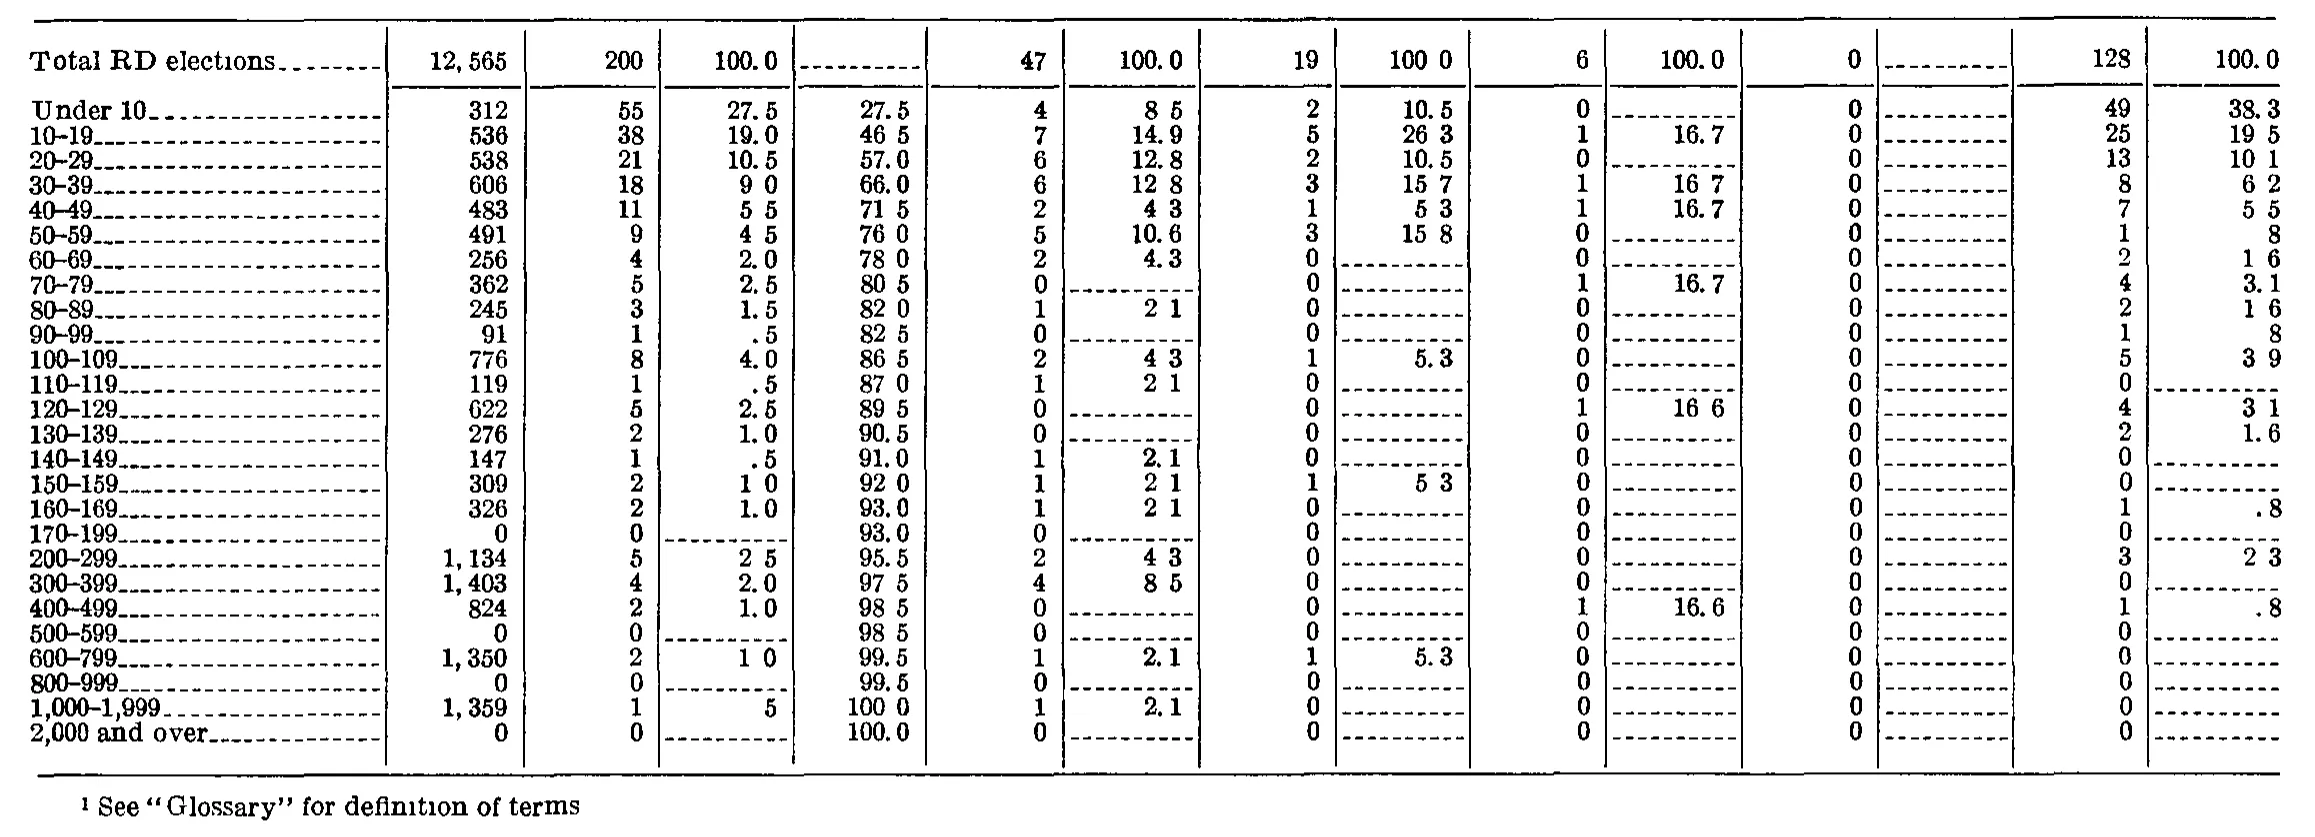
| Total RD elections | 12,565 | 200 | 100.0 | 47 | 100.0 | 19 | 100.0 | 6 | 100.0 | 0 | 128 | 100.0 | ||
| Under 10 | 312 | 55 | 27.5 | 27.5 | 4 | 8.5 | 2 | 10.5 | 0 | 0 | 49 | 38.3 | ||
| 10-19 | 536 | 38 | 19.0 | 46.5 | 7 | 14.9 | 5 | 26.3 | 1 | 16.7 | 0 | 25 | 19.5 | |
| 20-29 | 538 | 21 | 10.5 | 57.0 | 6 | 12.8 | 2 | 10.5 | 0 | 0 | 13 | 10.1 | ||
| 30-39 | 606 | 18 | 9.0 | 66.0 | 6 | 12.8 | 3 | 15.7 | 1 | 16.7 | 0 | 8 | 6.2 | |
| 40-49 | 483 | 11 | 5.5 | 71.5 | 2 | 4.3 | 1 | 5.3 | 1 | 16.7 | 0 | 7 | 5.5 | |
| 50-59 | 491 | 9 | 4.5 | 76.0 | 5 | 10.6 | 3 | 15.8 | 0 | 0 | 1 | .8 | ||
| 60-69 | 256 | 4 | 2.0 | 78.0 | 2 | 4.3 | 0 | 0 | 0 | 2 | 1.6 | |||
| 70-79 | 362 | 5 | 2.5 | 80.5 | 0 | 0 | 1 | 16.7 | 0 | 4 | 3.1 | |||
| 80-89 | 245 | 3 | 1.5 | 82.0 | 1 | 2.1 | 0 | 0 | 0 | 2 | 1.6 | |||
| 90-99 | 91 | 1 | .5 | 82.5 | 0 | 0 | 0 | 0 | 1 | .8 | ||||
| 100-109 | 776 | 8 | 4.0 | 86.5 | 2 | 4.3 | 1 | 5.3 | 0 | 0 | 5 | 3.9 | ||
| 110-119 | 119 | 1 | .5 | 87.0 | 1 | 2.1 | 0 | 0 | 0 | 0 | ||||
| 120-129 | 622 | 5 | 2.5 | 89.5 | 0 | 0 | 1 | 16.6 | 0 | 4 | 3.1 | |||
| 130-139 | 276 | 2 | 1.0 | 90.5 | 0 | 0 | 0 | 0 | 2 | 1.6 | ||||
| 140-149 | 147 | 1 | .5 | 91.0 | 1 | 2.1 | 0 | 0 | 0 | 0 | ||||
| 150-159 | 309 | 2 | 1.0 | 92.0 | 1 | 2.1 | 1 | 5.3 | 0 | 0 | 0 | |||
| 160-169 | 326 | 2 | 1.0 | 93.0 | 1 | 2.1 | 0 | 0 | 0 | 1 | .8 | |||
| 170-199 | 0 | 0 | 93.0 | 0 | 0 | 0 | 0 | 0 | ||||||
| 200-299 | 1,134 | 5 | 2.5 | 95.5 | 2 | 4.3 | 0 | 0 | 0 | 3 | 2.3 | |||
| 300-399 | 1,403 | 4 | 2.0 | 97.5 | 4 | 8.5 | 0 | 0 | 0 | 0 | ||||
| 400-499 | 824 | 2 | 1.0 | 98.5 | 0 | 0 | 1 | 16.6 | 0 | 1 | .8 | |||
| 500-599 | 0 | 0 | 98.5 | 0 | 0 | 0 | 0 | 0 | ||||||
| 600-799 | 1,350 | 2 | 1.0 | 99.5 | 1 | 2.1 | 1 | 5.3 | 0 | 0 | 0 | |||
| 800-999 | 0 | 0 | 99.5 | 0 | 0 | 0 | 0 | 0 | ||||||
| 1,000-1,999 | 1,359 | 1 | .5 | 100.0 | 1 | 2.1 | 0 | 0 | 0 | 0 | ||||
| 2,000 and over | 0 | 0 | 100.0 | 0 | 0 | 0 | 0 | 0 | ||||||
- 1 See "Glossary" for definition of terms
299 of 299 figures sit in a row or column sum that works out.
Reader’s notes
p. 221. Grid is 15 columns: stub, "Number eligible to vote", "Total elections", "Percent of total", "Cumulative percent of total", then Number/Percent pairs for AFL-CIO unions, Teamsters, Other national unions, Other local unions, and "Elections in which no representative was chosen". Decimal points: this is a 1-bit scan in which the period of many decimal percentages failed to print, so cells appear as e.g. "24 5", "100 0", "1 2". I have transcribed them with the decimal point ("24.5", "100.0", "1.2"), since every percent column is printed to one decimal place and the reading is unambiguous. Leading-zero-less decimals are kept as printed (".7", ".3"). Arithmetic cross-checks (not corrections — nothing was altered): all five count columns sum exactly to their printed "Total RC & RM elections" figures (eligible 531,971; elections 7,576; AFL-CIO 2,970; Teamsters 1,160; other national 304; other local 174; no representative 2,968), the "Percent of total" column sums to 100.0 and agrees step-by-step with the printed cumulative column, and the AFL-CIO and no-representative percent columns each sum to 100.0. This gives high confidence in the digits and in the column assignment. Individual cells worth flagging: - "Total RC & RM elections", Cumulative percent of total: a dash rule, transcribed as "". - "10,000 and over", Percent of total: printed as a plain "0" (2 elections out of 7,576), not a dash and not a footnote marker; the parallel "3000-9999" row has a dash rule there instead because it has no elections. - "150-159", Teamsters Number: a short stray dash sits at the left edge of the cell, just before the "4". It is not aligned with the dash rules used elsewhere and appears to be a scan artifact or ink speck; the cell is transcribed as "4". - "160-169", Elections in which no representative was chosen / Percent by size class: read as ".7" (19/2,968 = 0.64, which would ordinarily round to .6), but the table rounds up elsewhere too (e.g. 12.64 printed as 12.7, 1.645 as 1.7), so ".7" is consistent with its convention. The glyph is slightly broken; ".6" cannot be fully excluded. - Teamsters "Percent by size class" for rows 80-89 and 90-99: the leading period is missing in the scan; read as ".9" to match row 60-69, which prints ".9" clearly for the same count of 10-11. Crop: the caption carries a raised footnote marker 1, but no footnote text is printed within this crop and the image ends immediately after the "10,000 and over" row of panel A. The table continues on the following page (a section B for decertification elections and the footnote text are not on this image), so `footnotes` is empty.
p. 222. Continuation crop: no column headings are printed on this image, so header_rows is empty. The grid has 15 columns (stub + 14). Reading left to right the value columns are: a count column totalling 12,565; then a count/percent/cumulative-percent triplet totalling 200; then five count+percent pairs totalling 47, 19, 6, 0 and 128. The 0-column pair (columns 11-12) has a dash rule in every percent cell including the total row. Decimal points: this 1-bit scan drops many periods, so percentages are printed as e.g. "8 5", "100 0", "15 7". I have transcribed these with the decimal point ("8.5", "100.0", "15.7"); each such reading is confirmed by the column arithmetic. In the "1,000-1,999" row, column 3 shows only a bare "5" with no visible period; it is read as ".5" because the cumulative column advances from 99.5 to 100.0 there and the column then sums to exactly 100.0. Verification performed: every count column sums exactly to its printed total (12,565 / 200 / 47 / 19 / 6 / 0 / 128); every percent column sums to 100.0; and in every row the five count columns add to the figure in column 2. So the column placement of the numbers should be reliable. Possible printing anomalies, transcribed as printed and not corrected: - Row "100-109", column 1: "776" employees against 8 elections in units of 100-109 employees, which is arithmetically impossible (minimum 800). The column nevertheless sums exactly to the printed total 12,565, so either the entry and the total share the error or the digit is a misprint. "876" is the plausible alternative reading but would break the column total. - Column 8 (the 19-election group): rows "30-39" and "50-59" both have a count of 3 but are given as 15.7 and 15.8 respectively; 3/19 = 15.79. The split keeps the column at exactly 100.0. - Row "20-29", column 14: printed 10.1, though 13/128 = 10.16 would normally round to 10.2. The column sums to exactly 100.0 with 10.1. - Column 4 (cumulative percent) repeats the preceding value on the four zero rows "170-199", "500-599", "800-999" and "2,000 and over", as expected.
Source image
Source data: U.S. NLRB Annual Reports (public domain). Reconstruction by NLRB Stats Archive. Read by claude-opus-5 (effort max, prompt extract_v1) from the 300-dpi scan; stitched by page. Updated October 2026.