NLRB Stats Archive › Annual Reports › FY1965 › Geographic distribution of representation elections — by division and State
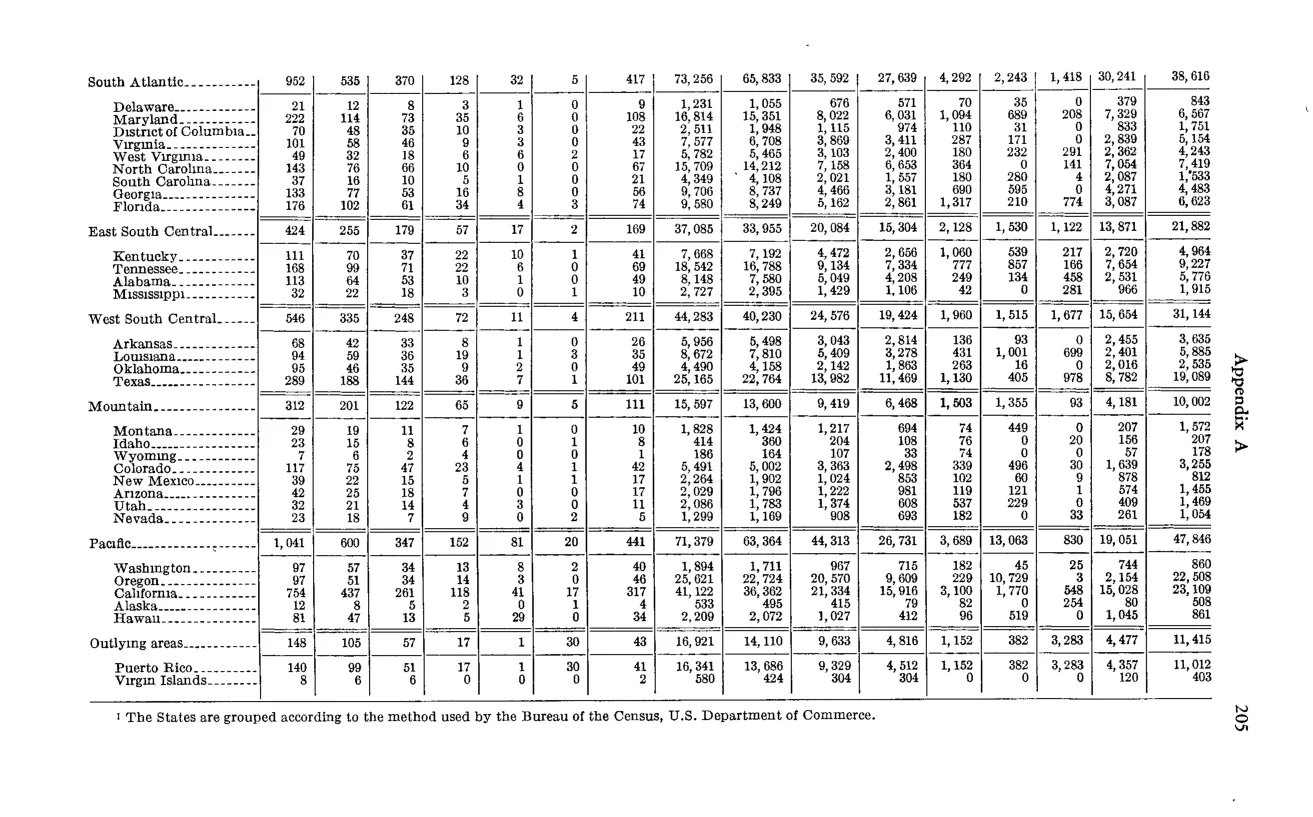
Geographic distribution of representation elections — by division and State
| Division and State | Total elections | Elections won by unions: Total | AFL-CIO | Teamsters | Other national | Other local | Other(?) | Total eligible | Total valid votes cast | Votes for unions Total | AFL-CIO | Teamsters | Other national | Other local | Votes for no union | Eligible employees in units choosing representation | |
|---|---|---|---|---|---|---|---|---|---|---|---|---|---|---|---|---|---|
| South Atlantic (division subtotal) | 932 | 553 | 370 | 128 | 32 | 5 | 417 | 73,126 | 63,853 | 35,592 | 27,689 | 4,292 | 2,243 | 1,418 | 35,241 | 35,618 | |
| South Atlantic states (DE, MD, DC, VA, WV, NC, SC, GA, FL) | |||||||||||||||||
| East South Central (division subtotal) | 424 | 255 | 179 | 57 | 17 | 2 | 169 | 37,085 | 33,955 | 20,084 | 15,304 | 2,128 | 1,530 | 1,122 | 13,871 | 21,882 | |
| East South Central states (KY, TN, AL, MS) | |||||||||||||||||
| West South Central (division subtotal) | 546 | 335 | 248 | 72 | 11 | 4 | 211 | 44,283 | 40,232 | 24,576 | 19,424 | 1,960 | 1,515 | 1,677 | 15,654 | 20,144 | |
| Mountain (division subtotal) | 332 | 201 | 122 | 63 | 6 | 5 | 111 | 15,597 | 13,600 | 9,419 | 6,468 | 1,503 | 1,355 | 30 | 4,181 | 10,002 | |
| Mountain states (MT, ID, WY, CO, NM, AZ, UT, NV) | |||||||||||||||||
| Pacific (division subtotal) | 1,041 | 600 | 347 | 152 | 85 | 15 | 441 | 71,579 | 63,366 | 44,313 | 26,731 | 3,689 | 13,052 | 839 | 19,051 | 47,840 | |
| Pacific states (WA, OR, CA, AK, HI) | |||||||||||||||||
| Outlying areas (Puerto Rico + Virgin Islands) | 149 | 73 | 60 | 13 | 76 | 16,901 | 14,353 | 9,653 | 6,652 | 4,877 | 11,453 |
Source image
Source data: U.S. NLRB Annual Reports (public domain). Reconstruction by NLRB Stats Archive. Updated June 2026.