NLRB Stats Archive › Annual Reports › FY1965 › Final outcome of representation elections in cases closed
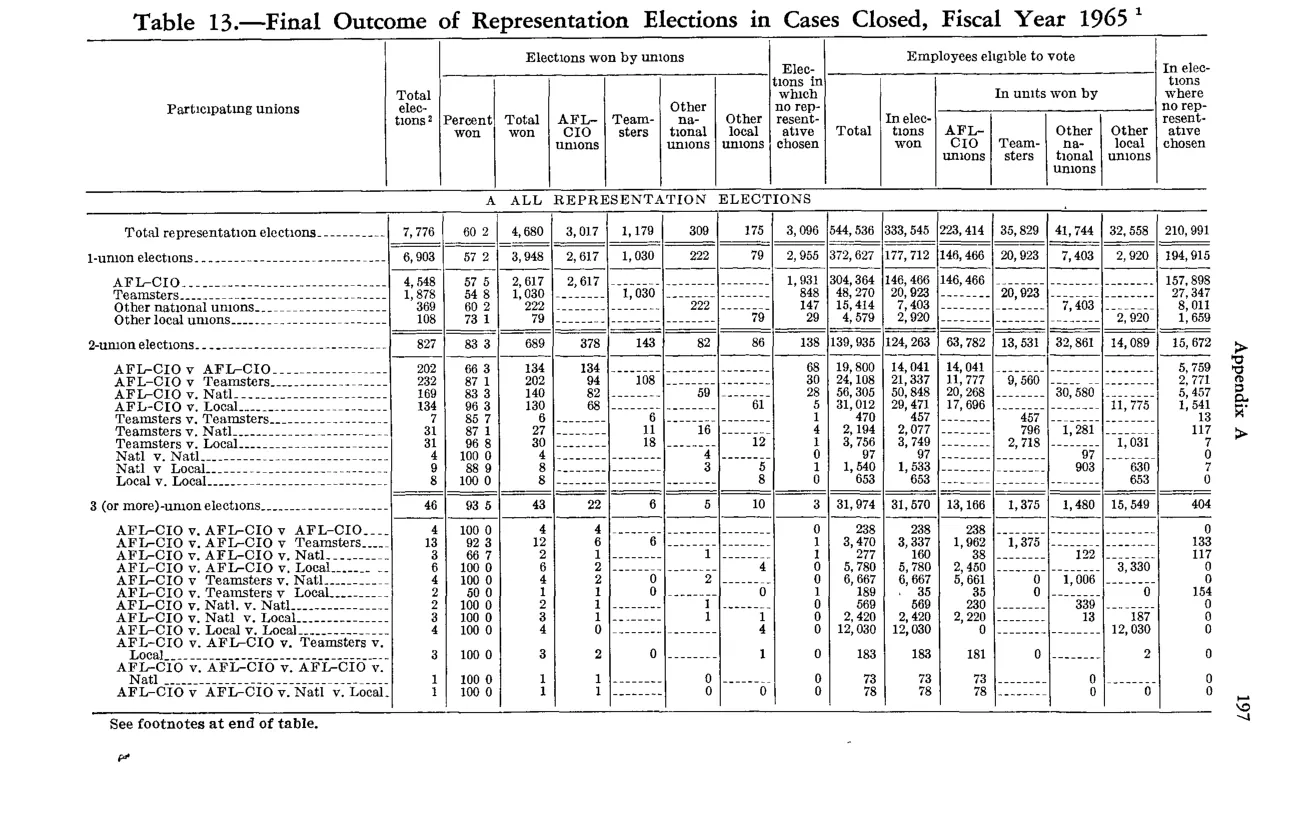
Final outcome of representation elections in cases closed
| Participating unions | Elections won by unions Total elections 1 | Elections won by unions Percent won | Elections won by unions Total won | Elections won by unions AFL-CIO unions | Elections won by unions Teamsters | Elections won by unions Other national unions | Elections won by unions Other local unions | Elections in which no representative was chosen | Employees eligible to vote Total | Employees eligible to vote In elections won by unions Total | Employees eligible to vote In units won by AFL-CIO | Employees eligible to vote In units won by Teamsters | Employees eligible to vote In units won by Other national unions | Employees eligible to vote In units won by Other local unions | Employees in elections in which no representative was chosen |
|---|---|---|---|---|---|---|---|---|---|---|---|---|---|---|---|
| Total representation elections | 7,776 | 60.2 | 4,680 | 3,017 | 1,179 | 309 | 175 | 3,096 | 544,538 | 333,545 | 223,414 | 35,829 | 41,744 | 32,558 | 210,991 |
| 1-union elections (subtotal) | 6,903 | 57.2 | 3,988 | 2,617 | 1,030 | 250 | 91 | 2,920 | 194,915 | 146,466 | 20,923 | 7,403 | |||
| 1-union: AFL-CIO | 4,548 | 2,617 | 2,617 | 1,931 | 146,466 | 146,466 | 157,598 | ||||||||
| 1-union: Teamsters | 1,878 | 54.8 | 1,030 | 1,030 | 848 | 20,923 | 20,923 | 27,247 | |||||||
| 1-union: Other national unions | 269 | 250 | 250 | 147 | 7,403 | 7,403 | |||||||||
| 1-union: Other local unions | 208 | 91 | 91 | ||||||||||||
| 2-union elections (subtotal) | 827 | 669 | 378 | 143 | 52 | 80 | 158 | 139,933 | 124,263 | 63,782 | 13,529 | 8,394 | 14,089 | 15,672 | |
| 2-union | |||||||||||||||
| 3 (or more)-union elections (subtotal) | 46 | 33 | 14 | 6 | 7 | 4 | 13 | 31,974 | 31,030 | 13,106 | 1,460 | 15,549 | 404 | ||
| 3-or-more union |
Source image
Source data: U.S. NLRB Annual Reports (public domain). Reconstruction by NLRB Stats Archive. Updated June 2026.