NLRB Stats Archive › Annual Reports › FY1965 › Analysis of Methods of Disposition of Representation and Union Deauthorization Cases Closed, Fiscal Year 1965
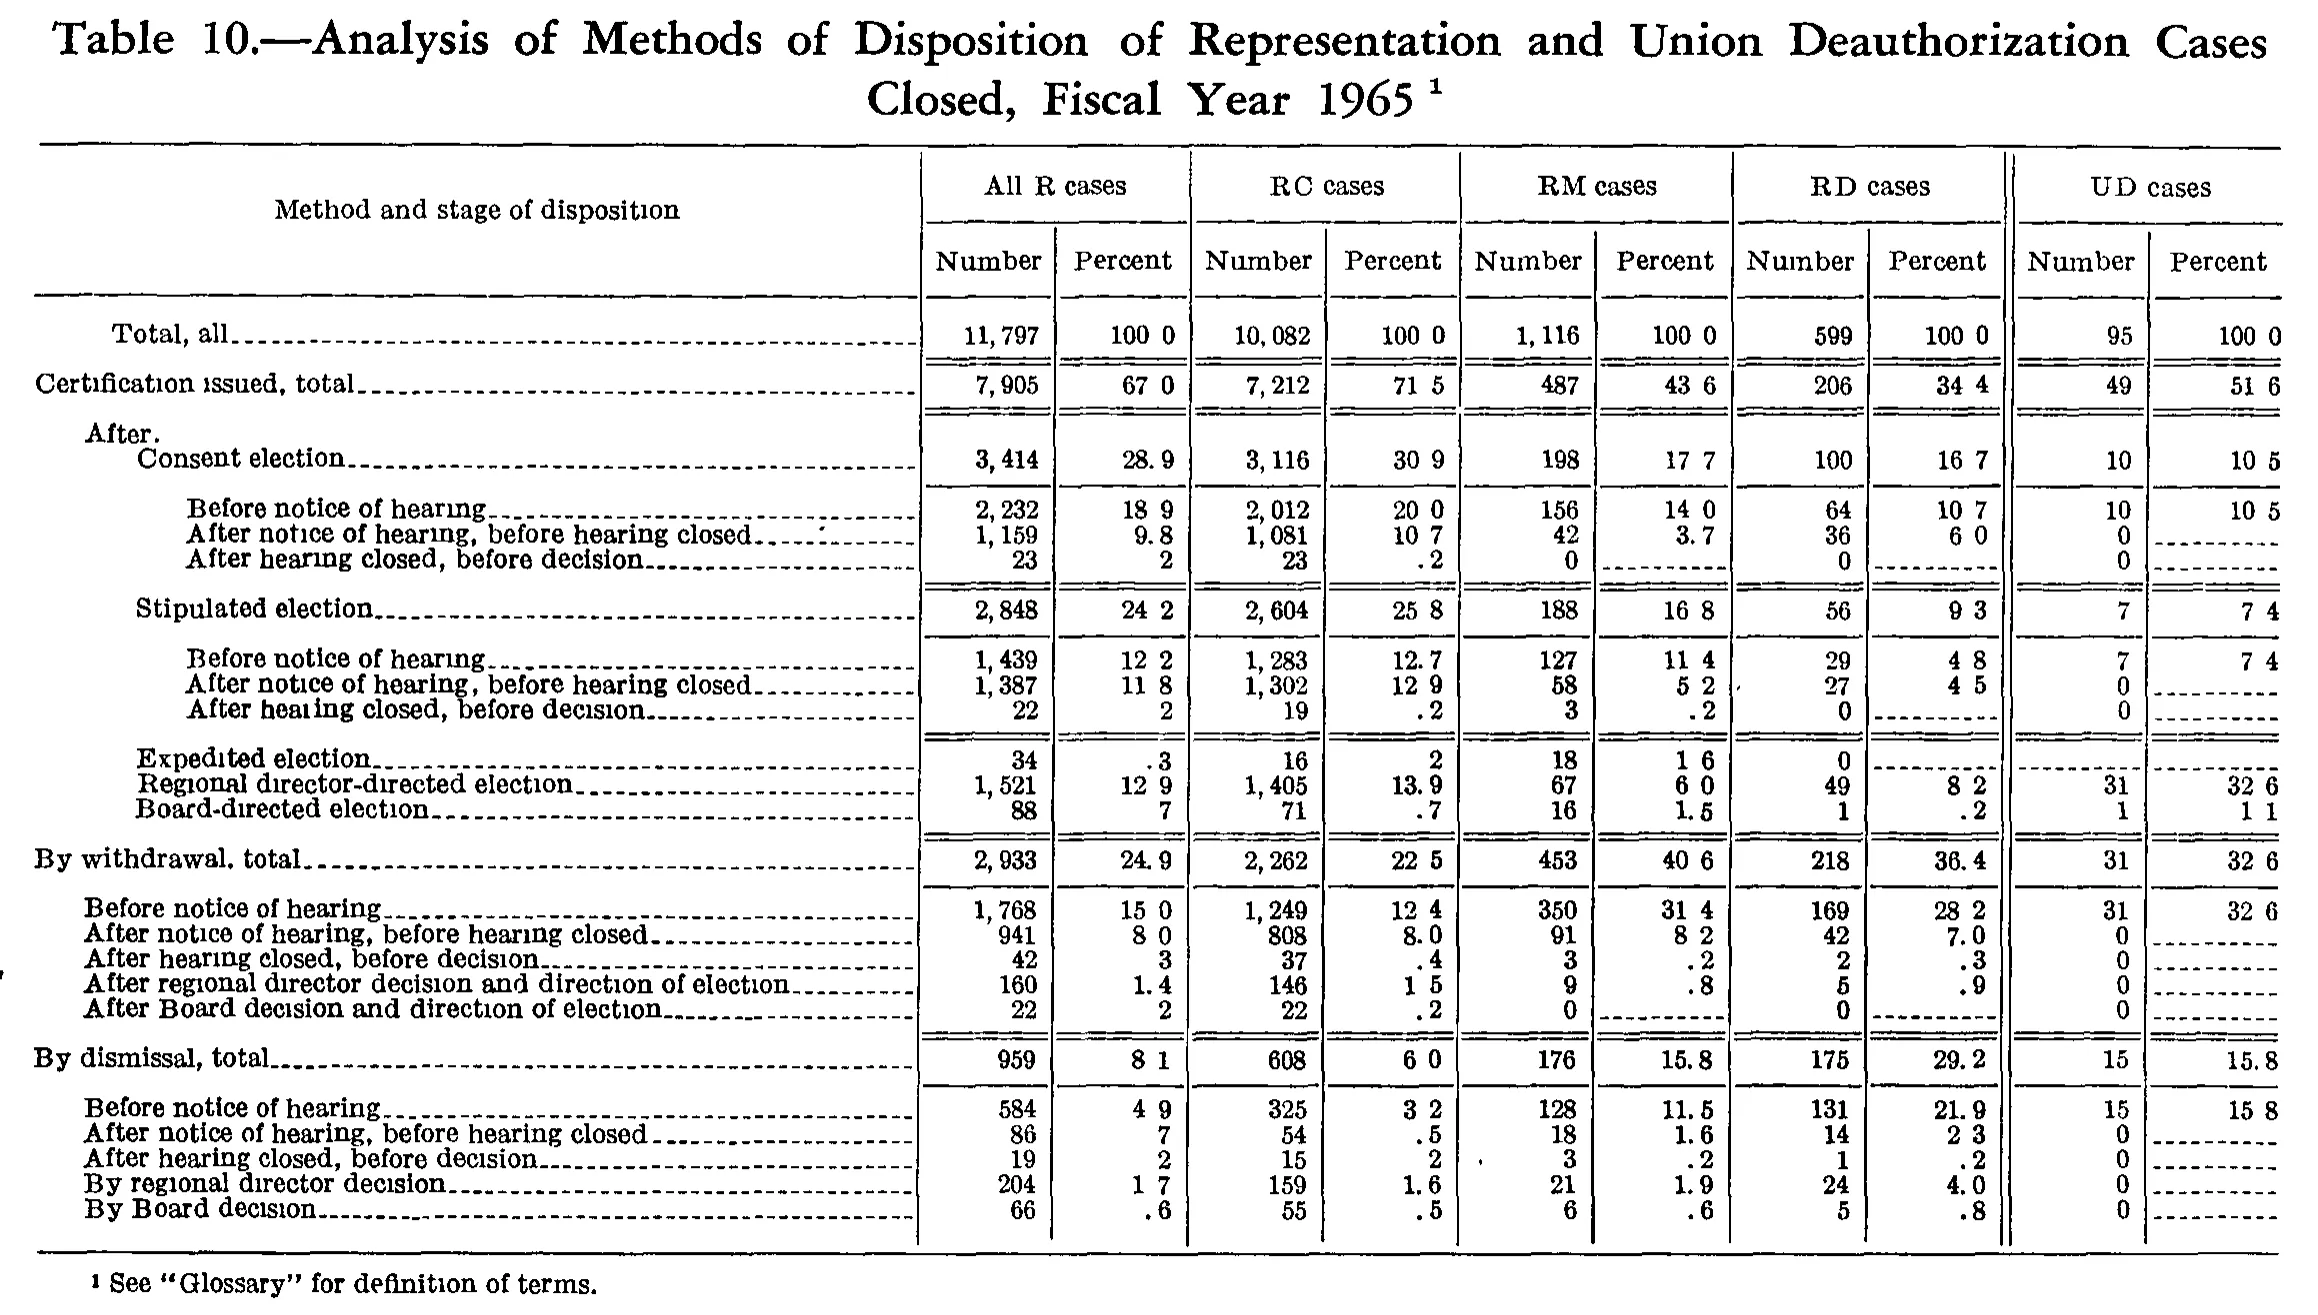
Analysis of Methods of Disposition of Representation and Union Deauthorization Cases Closed, Fiscal Year 1965
| Method and stage of disposition | All R cases | RC cases | RM cases | RD cases | UD cases | |||||
|---|---|---|---|---|---|---|---|---|---|---|
| Method and stage of disposition | Number | Percent | Number | Percent | Number | Percent | Number | Percent | Number | Percent |
| Total, all | 11,797 | 100.0 | 10,082 | 100.0 | 1,116 | 100.0 | 599 | 100.0 | 95 | 100.0 |
| Certification issued, total | 7,905 | 67.0 | 7,212 | 71.5 | 487 | 43.6 | 206 | 34.4 | 49 | 51.6 |
| After: | ||||||||||
| Consent election | 3,414 | 28.9 | 3,116 | 30.9 | 198 | 17.7 | 100 | 16.7 | 10 | 10.5 |
| Before notice of hearing | 2,232 | 18.9 | 2,012 | 20.0 | 156 | 14.0 | 64 | 10.7 | 10 | 10.5 |
| After notice of hearing, before hearing closed | 1,159 | 9.8 | 1,081 | 10.7 | 42 | 3.7 | 36 | 6.0 | 0 | |
| After hearing closed, before decision | 23 | .2 | 23 | .2 | 0 | 0 | 0 | |||
| Stipulated election | 2,848 | 24.2 | 2,604 | 25.8 | 188 | 16.8 | 56 | 9.3 | 7 | 7.4 |
| Before notice of hearing | 1,439 | 12.2 | 1,283 | 12.7 | 127 | 11.4 | 29 | 4.8 | 7 | 7.4 |
| After notice of hearing, before hearing closed | 1,387 | 11.8 | 1,302 | 12.9 | 58 | 5.2 | 27 | 4.5 | 0 | |
| After hearing closed, before decision | 22 | .2 | 19 | .2 | 3 | .2 | 0 | 0 | ||
| Expedited election | 34 | .3 | 16 | .2 | 18 | 1.6 | 0 | |||
| Regional director-directed election | 1,521 | 12.9 | 1,405 | 13.9 | 67 | 6.0 | 49 | 8.2 | 31 | 32.6 |
| Board-directed election | 88 | .7 | 71 | .7 | 16 | 1.5 | 1 | .2 | 1 | 1.1 |
| By withdrawal, total | 2,933 | 24.9 | 2,262 | 22.5 | 453 | 40.6 | 218 | 36.4 | 31 | 32.6 |
| Before notice of hearing | 1,768 | 15.0 | 1,249 | 12.4 | 350 | 31.4 | 169 | 28.2 | 31 | 32.6 |
| After notice of hearing, before hearing closed | 941 | 8.0 | 808 | 8.0 | 91 | 8.2 | 42 | 7.0 | 0 | |
| After hearing closed, before decision | 42 | .3 | 37 | .4 | 3 | .2 | 2 | .3 | 0 | |
| After regional director decision and direction of election | 160 | 1.4 | 146 | 1.5 | 9 | .8 | 5 | .9 | 0 | |
| After Board decision and direction of election | 22 | .2 | 22 | .2 | 0 | 0 | 0 | |||
| By dismissal, total | 959 | 8.1 | 608 | 6.0 | 176 | 15.8 | 175 | 29.2 | 15 | 15.8 |
| Before notice of hearing | 584 | 4.9 | 325 | 3.2 | 128 | 11.5 | 131 | 21.9 | 15 | 15.8 |
| After notice of hearing, before hearing closed | 86 | .7 | 54 | .5 | 18 | 1.6 | 14 | 2.3 | 0 | |
| After hearing closed, before decision | 19 | .2 | 15 | .2 | 3 | .2 | 1 | .2 | 0 | |
| By regional director decision | 204 | 1.7 | 159 | 1.6 | 21 | 1.9 | 24 | 4.0 | 0 | |
| By Board decision | 66 | .6 | 55 | .5 | 6 | .6 | 5 | .8 | 0 | |
- 1 See "Glossary" for definition of terms.
106 of 106 figures sit in a row or column sum that works out.
Reader’s notes
p. 205. Eleven columns: stub plus five two-column panels (All R, RC, RM, RD, UD cases), each Number/Percent. Decimal points: this scan drops the decimal point in many percent cells (they print as e.g. \"100 0\", \"67 0\", \"71 5\", \"16 8\", or a bare \"2\"/\"7\" for .2/.7), while other cells in the same columns show the point clearly (\"28.9\", \"12.7\", \"3.7\"). I have restored the decimal point in every percent cell, since the values are plainly one-decimal percentages; no digits were changed. Cells printed as a dash rule (------) were transcribed as \"\", which covers the percent cells beside a 0 count in the RM, RD and UD panels. \"Expedited election\": the UD cases Number and Percent cells appear genuinely blank (no 0, no dash rule), unlike the other rows in that panel. Consistent with this, the UD certification subitems 10 + 7 + 31 + 1 sum to the printed total 49. All Number columns are internally consistent: every subtotal equals the sum of its components and Certification + Withdrawal + Dismissal equals \"Total, all\" in all five panels, so the digits and column placement are well corroborated. A few printed percents do not match the printed counts and totals (transcribed as printed, not corrected): All R \"Stipulated election\" 24.2 (2,848/11,797 = 24.1, though the rounded subitems 12.2 + 11.8 + .2 do sum to 24.2); RM \"Board-directed election\" 1.5 (16/1,116 = 1.4); RC \"By withdrawal, total\" 22.5 (2,262/10,082 = 22.4) and RC \"After regional director decision...\" 1.5 (146/10,082 = 1.4); RD \"After regional director decision...\" .9 (5/599 = .8). Other one-tenth differences elsewhere appear to come from the source's inconsistent rounding/truncation. The row label rendered \"After:\" shows a faint single mark at the baseline in this scan; it could be a period rather than a colon. The row label \"After notice of hearing, before hearing closed\" in the consent-election block has a stray ink mark over the leader dots; the wording is unaffected.
Source image
Source data: U.S. NLRB Annual Reports (public domain). Reconstruction by NLRB Stats Archive. Read by claude-opus-5 (effort max, prompt extract_v1) from the 300-dpi scan; stitched by page. Updated October 2026.