NLRB Stats Archive › Annual Reports › FY1965 › Disposition by Stage of Unfair Labor Practice Cases Closed, Fiscal Year 1965
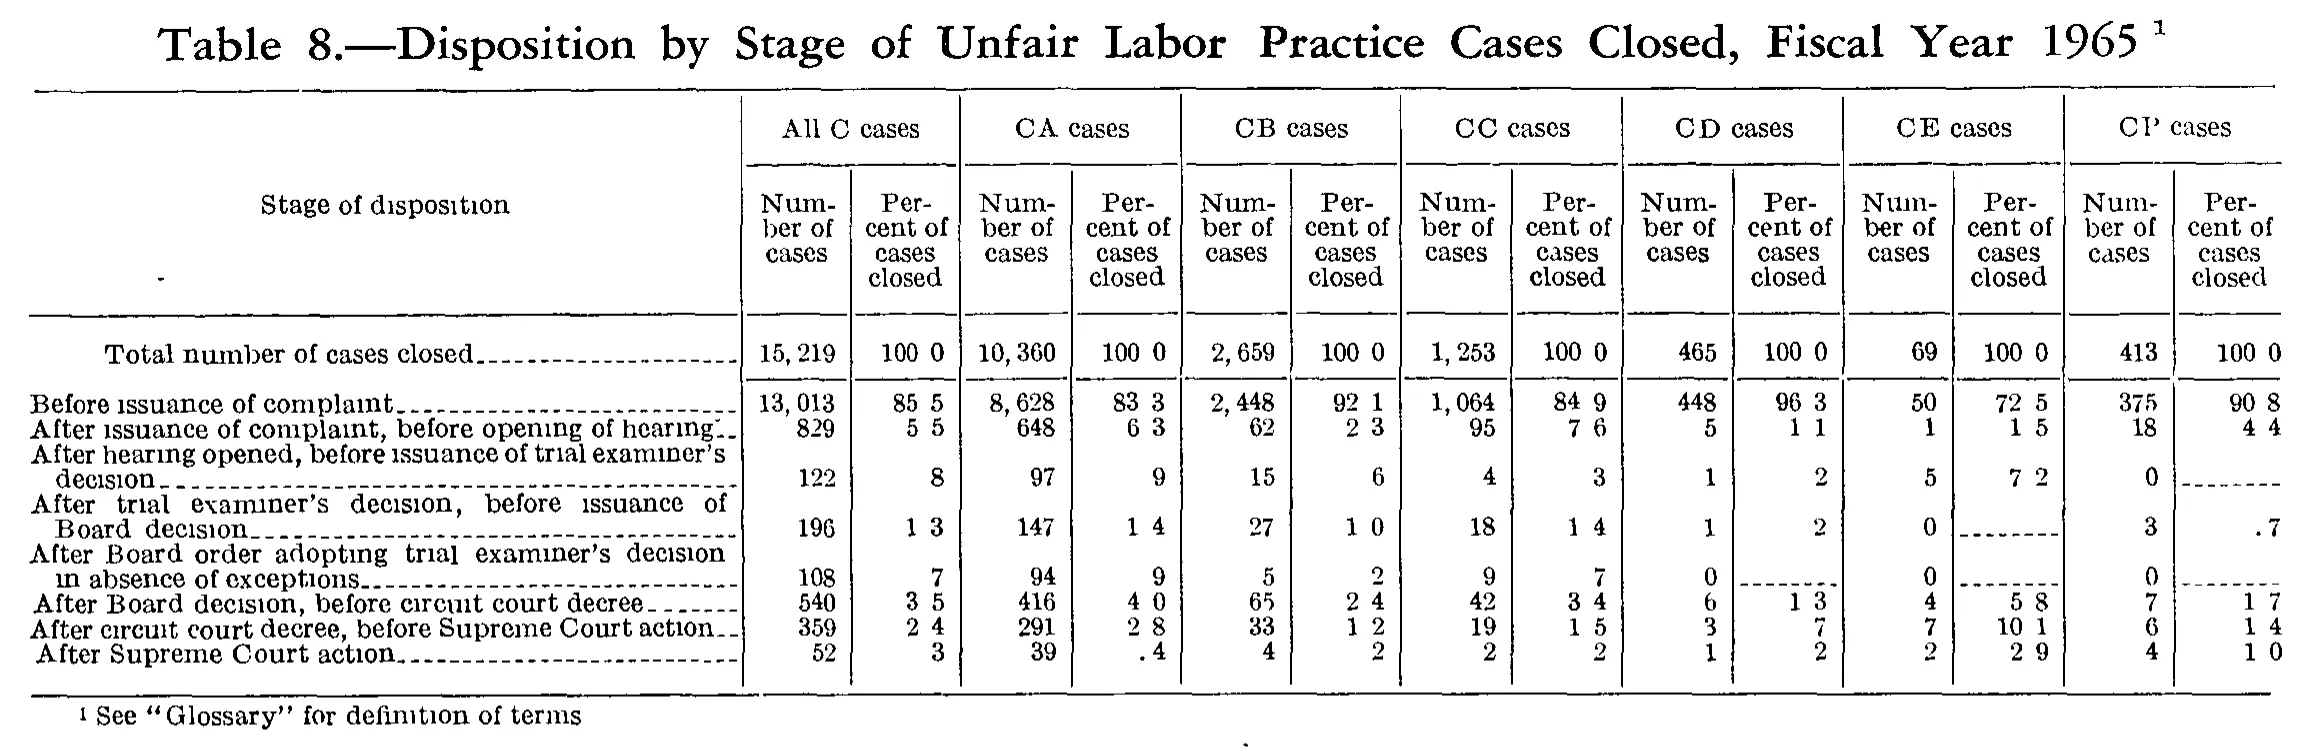
Disposition by Stage of Unfair Labor Practice Cases Closed, Fiscal Year 1965
| Stage of disposition | All C cases | CA cases | CB cases | CC cases | CD cases | CE cases | CP cases | |||||||
|---|---|---|---|---|---|---|---|---|---|---|---|---|---|---|
| Stage of disposition | Number of cases | Percent of cases closed | Number of cases | Percent of cases closed | Number of cases | Percent of cases closed | Number of cases | Percent of cases closed | Number of cases | Percent of cases closed | Number of cases | Percent of cases closed | Number of cases | Percent of cases closed |
| Total number of cases closed | 15,219 | 100.0 | 10,360 | 100.0 | 2,659 | 100.0 | 1,253 | 100.0 | 465 | 100.0 | 69 | 100.0 | 413 | 100.0 |
| Before issuance of complaint | 13,013 | 85.5 | 8,628 | 83.3 | 2,448 | 92.1 | 1,064 | 84.9 | 448 | 96.3 | 50 | 72.5 | 375 | 90.8 |
| After issuance of complaint, before opening of hearing | 829 | 5.5 | 648 | 6.3 | 62 | 2.3 | 95 | 7.6 | 5 | 1.1 | 1 | 1.5 | 18 | 4.4 |
| After hearing opened, before issuance of trial examiner's decision | 122 | .8 | 97 | .9 | 15 | .6 | 4 | .3 | 1 | .2 | 5 | 7.2 | 0 | |
| After trial examiner's decision, before issuance of Board decision | 196 | 1.3 | 147 | 1.4 | 27 | 1.0 | 18 | 1.4 | 1 | .2 | 0 | 3 | .7 | |
| After Board order adopting trial examiner's decision in absence of exceptions | 108 | .7 | 94 | .9 | 5 | .2 | 9 | .7 | 0 | 0 | 0 | |||
| After Board decision, before circuit court decree | 540 | 3.5 | 416 | 4.0 | 65 | 2.4 | 42 | 3.4 | 6 | 1.3 | 4 | 5.8 | 7 | 1.7 |
| After circuit court decree, before Supreme Court action | 359 | 2.4 | 291 | 2.8 | 33 | 1.2 | 19 | 1.5 | 3 | .7 | 7 | 10.1 | 6 | 1.4 |
| After Supreme Court action | 52 | .3 | 39 | .4 | 4 | .2 | 2 | .2 | 1 | .2 | 2 | 2.9 | 4 | 1.0 |
- 1 See "Glossary" for definition of terms
58 of 58 figures sit in a row or column sum that works out.
Reader’s notes
p. 204. 15 columns: stub plus seven two-column panels (All C, CA, CB, CC, CD, CE, CP), each panel holding "Number of cases" and "Percent of cases closed". Decimal points: in this 1-bit scan the period in the percent columns prints as a faint gap or disappears entirely, so "100 0" is read as 100.0, "85 5" as 85.5, and so on. Values below 1 percent are set in the report's leading-dot style; two of them (CP "After trial examiner's decision..." = .7 and CA "After Supreme Court action" = .4) show the dot clearly, while the others ("8", "9", "6", "3", "2", "7") show only the digit. I have written all of them with the leading dot, since each matches its own number/total ratio (e.g. 122/15,219 = 0.8 percent, 97/10,360 = 0.9 percent, 5/69 = 7.2 percent). The seventh panel heading is degraded in the scan and renders roughly as "CI' cases"; it is "CP cases" — the sequence CA, CB, CC, CD, CE, CP is the Board's case-type series for this year. Cells printed as a dash rule are transcribed as "": the percent column of CP in "After hearing opened..." and in "After Board order adopting...", of CE in "After trial examiner's decision..." and in "After Board order adopting...", and of CD in "After Board order adopting...". Each sits beside a printed 0 in its number column. Arithmetic check: in every one of the seven panels the eight stage rows sum exactly to the printed "Total number of cases closed" (15,219; 10,360; 2,659; 1,253; 465; 69; 413). No misprints detected. Nothing appears cut off by the crop.
Source image
Source data: U.S. NLRB Annual Reports (public domain). Reconstruction by NLRB Stats Archive. Read by claude-opus-5 (effort max, prompt extract_v1) from the 300-dpi scan; stitched by page. Updated October 2026.