NLRB Stats Archive › Annual Reports › FY1965 › Geographic Distribution of Cases Received, Fiscal Year 1965
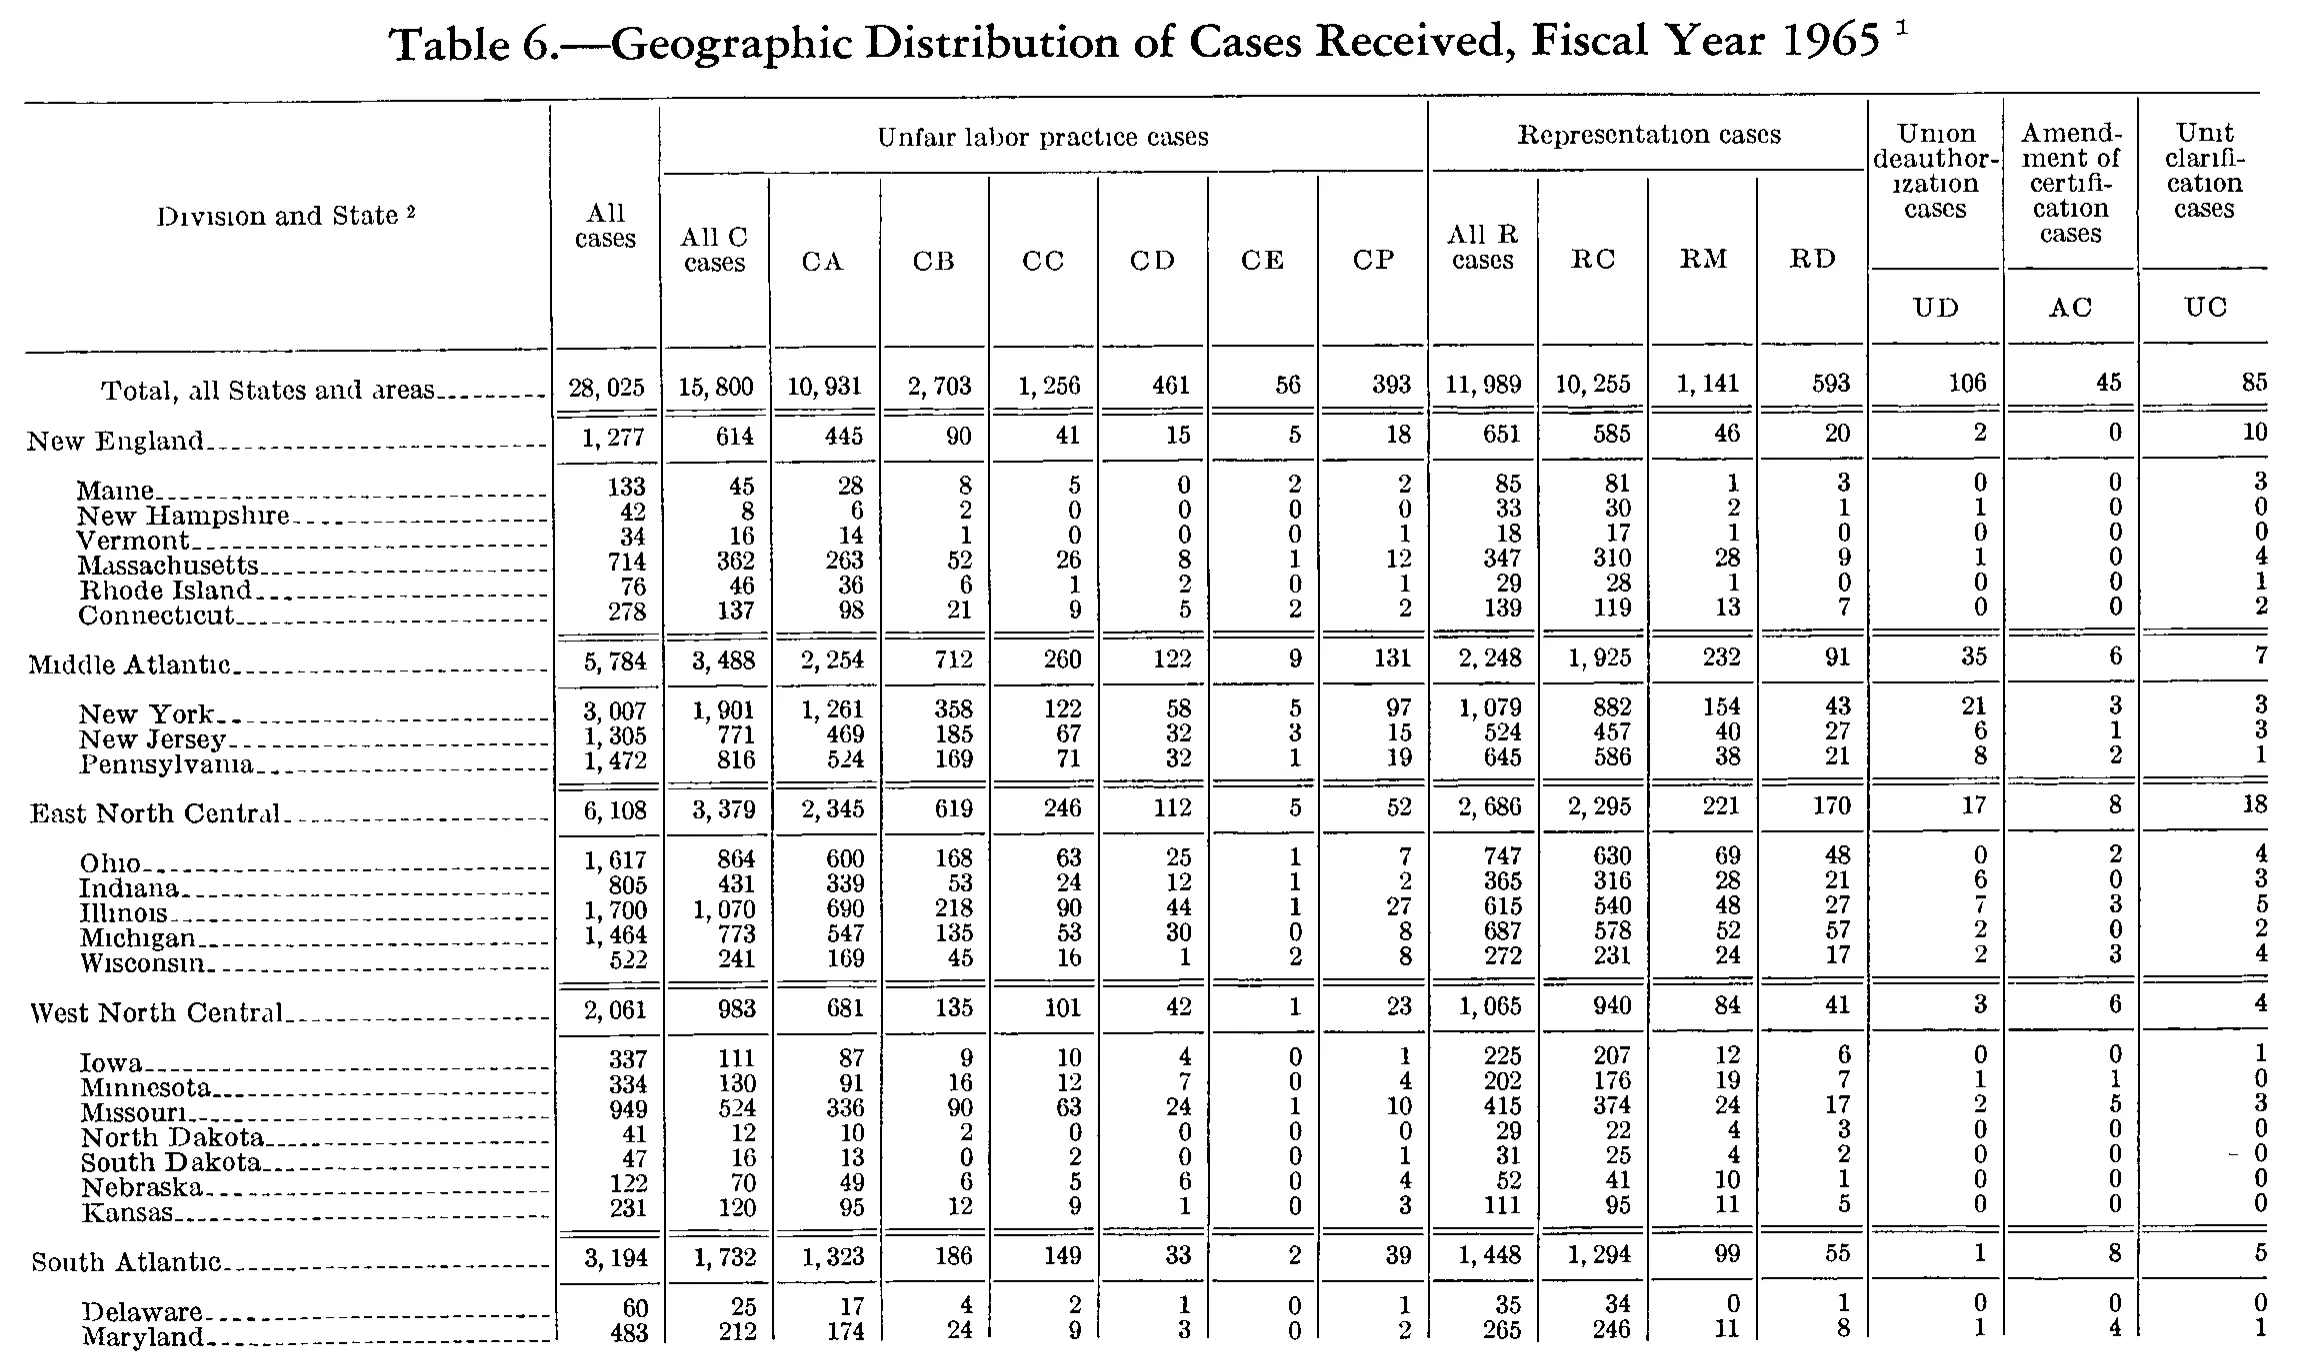
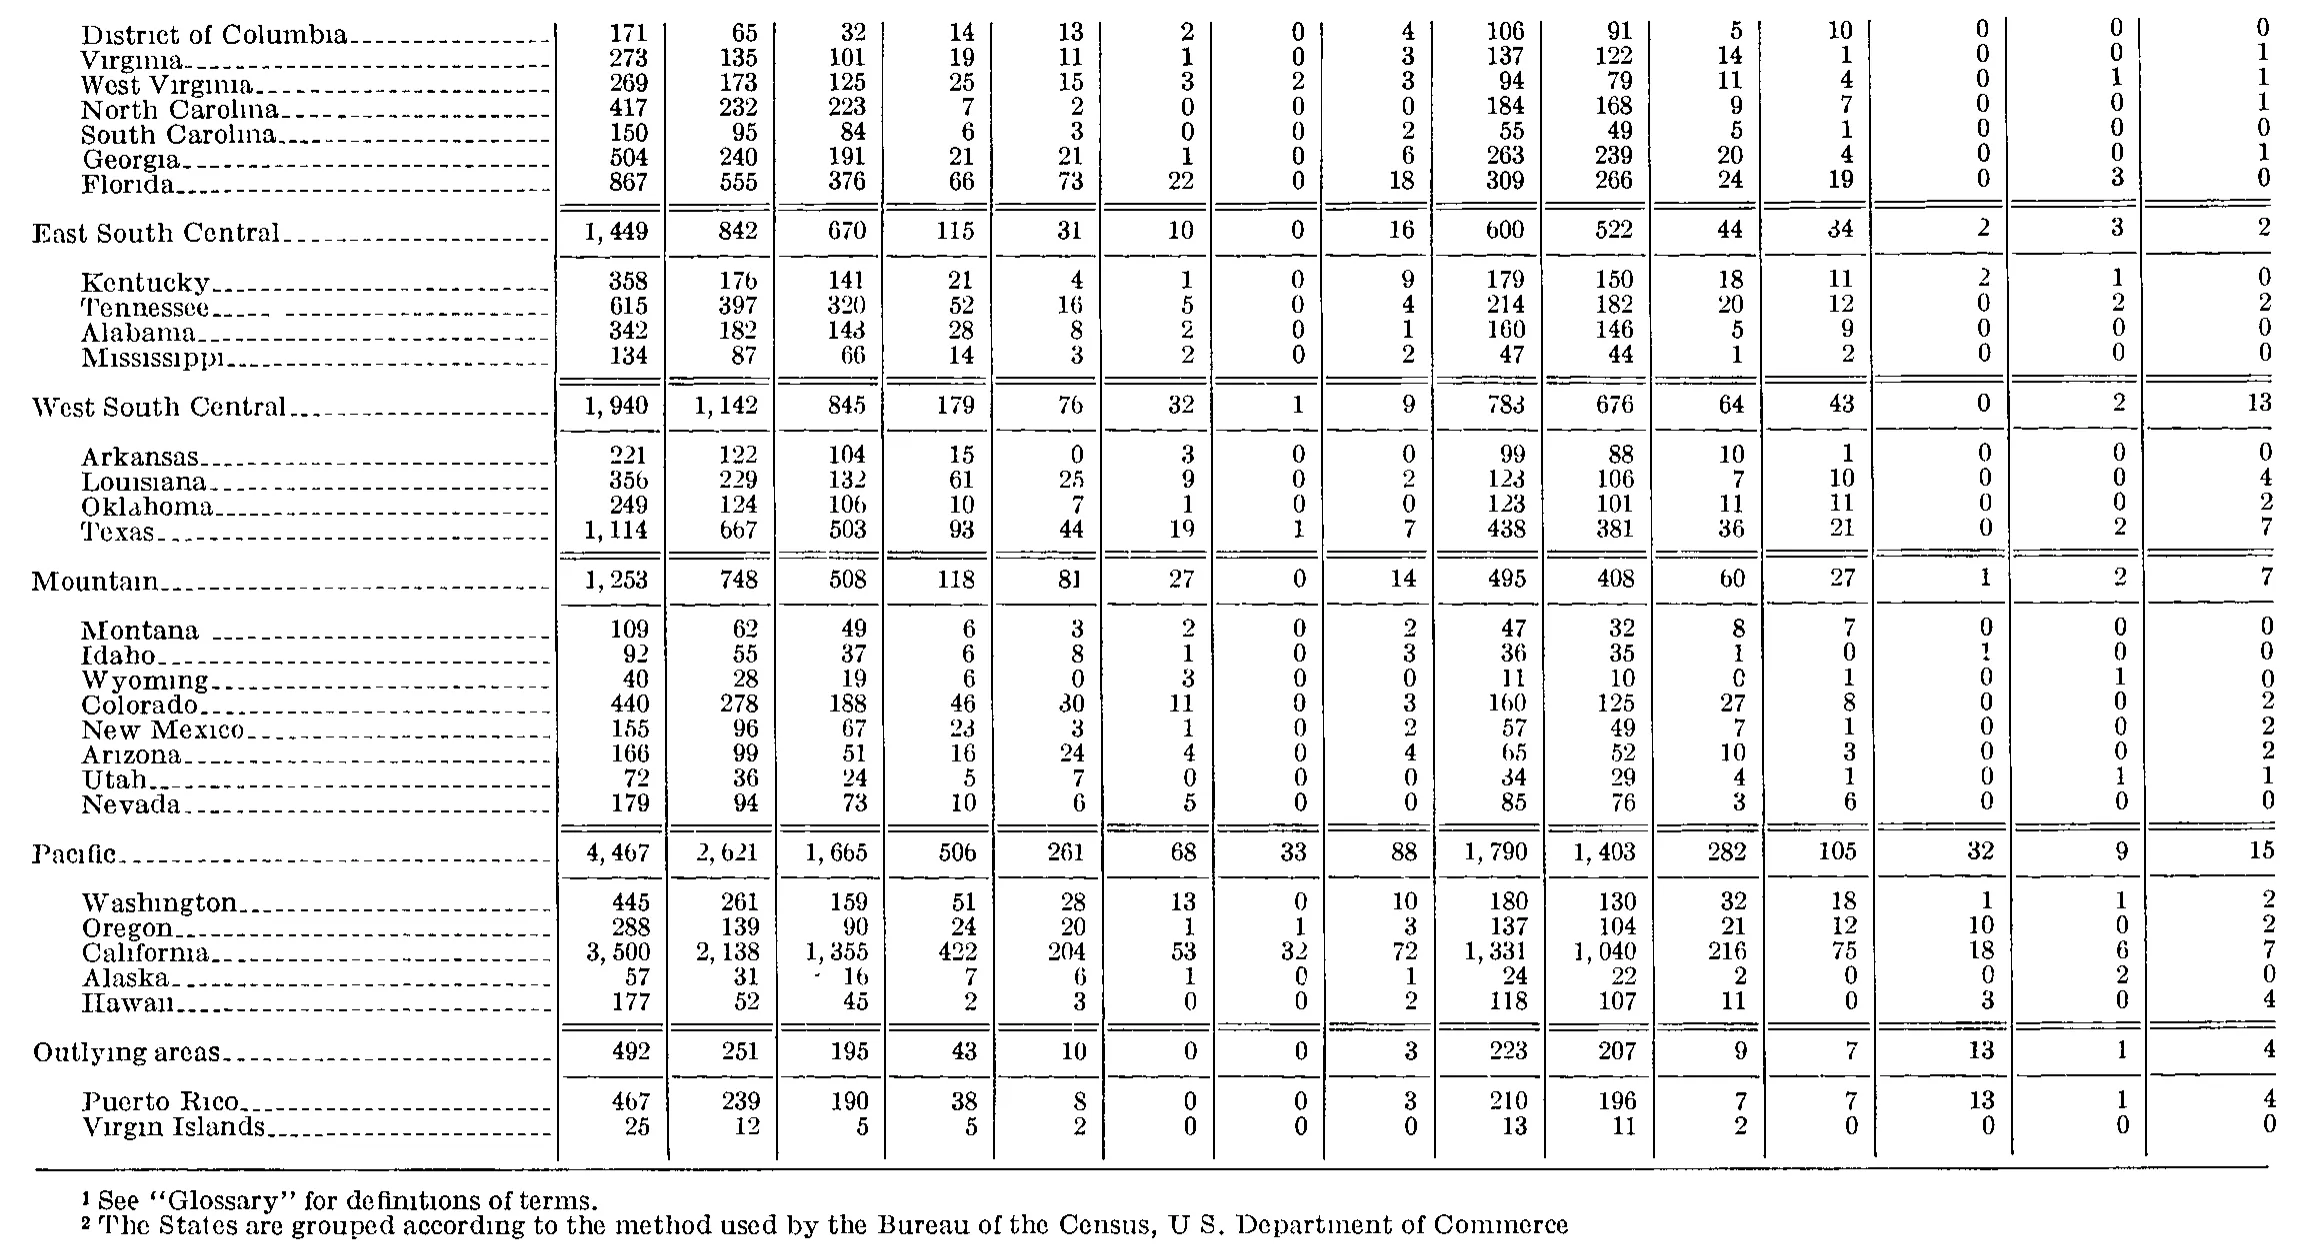
Geographic Distribution of Cases Received, Fiscal Year 1965
Stitched from pp. 199–200.
| Division and State | All cases | Unfair labor practice cases | Representation cases | Union deauthorization cases | Amendment of certification cases | Unit clarification cases | |||||||||
|---|---|---|---|---|---|---|---|---|---|---|---|---|---|---|---|
| Division and State | All cases | All C cases | CA | CB | CC | CD | CE | CP | All R cases | RC | RM | RD | Union deauthorization cases | Amendment of certification cases | Unit clarification cases |
| Division and State | All cases | All C cases | CA | CB | CC | CD | CE | CP | All R cases | RC | RM | RD | UD | AC | UC |
| Total, all States and areas | 28,025 | 15,800 | 10,931 | 2,703 | 1,256 | 461 | 56 | 393 | 11,989 | 10,255 | 1,141 | 593 | 106 | 45 | 85 |
| New England | 1,277 | 614 | 445 | 90 | 41 | 15 | 5 | 18 | 651 | 585 | 46 | 20 | 2 | 0 | 10 |
| Maine | 133 | 45 | 28 | 8 | 5 | 0 | 2 | 2 | 85 | 81 | 1 | 3 | 0 | 0 | 3 |
| New Hampshire | 42 | 8 | 6 | 2 | 0 | 0 | 0 | 0 | 33 | 30 | 2 | 1 | 1 | 0 | 0 |
| Vermont | 34 | 16 | 14 | 1 | 0 | 0 | 0 | 1 | 18 | 17 | 1 | 0 | 0 | 0 | 0 |
| Massachusetts | 714 | 362 | 263 | 52 | 26 | 8 | 1 | 12 | 347 | 310 | 28 | 9 | 1 | 0 | 4 |
| Rhode Island | 76 | 46 | 36 | 6 | 1 | 2 | 0 | 1 | 29 | 28 | 1 | 0 | 0 | 0 | 1 |
| Connecticut | 278 | 137 | 98 | 21 | 9 | 5 | 2 | 2 | 139 | 119 | 13 | 7 | 0 | 0 | 2 |
| Middle Atlantic | 5,784 | 3,488 | 2,254 | 712 | 260 | 122 | 9 | 131 | 2,248 | 1,925 | 232 | 91 | 35 | 6 | 7 |
| New York | 3,007 | 1,901 | 1,261 | 358 | 122 | 58 | 5 | 97 | 1,079 | 882 | 154 | 43 | 21 | 3 | 3 |
| New Jersey | 1,305 | 771 | 469 | 185 | 67 | 32 | 3 | 15 | 524 | 457 | 40 | 27 | 6 | 1 | 3 |
| Pennsylvania | 1,472 | 816 | 524 | 169 | 71 | 32 | 1 | 19 | 645 | 586 | 38 | 21 | 8 | 2 | 1 |
| East North Central | 6,108 | 3,379 | 2,345 | 619 | 246 | 112 | 5 | 52 | 2,686 | 2,295 | 221 | 170 | 17 | 8 | 18 |
| Ohio | 1,617 | 864 | 600 | 168 | 63 | 25 | 1 | 7 | 747 | 630 | 69 | 48 | 0 | 2 | 4 |
| Indiana | 805 | 431 | 339 | 53 | 24 | 12 | 1 | 2 | 365 | 316 | 28 | 21 | 6 | 0 | 3 |
| Illinois | 1,700 | 1,070 | 690 | 218 | 90 | 44 | 1 | 27 | 615 | 540 | 48 | 27 | 7 | 3 | 5 |
| Michigan | 1,464 | 773 | 547 | 135 | 53 | 30 | 0 | 8 | 687 | 578 | 52 | 57 | 2 | 0 | 2 |
| Wisconsin | 522 | 241 | 169 | 45 | 16 | 1 | 2 | 8 | 272 | 231 | 24 | 17 | 2 | 3 | 4 |
| West North Central | 2,061 | 983 | 681 | 135 | 101 | 42 | 1 | 23 | 1,065 | 940 | 84 | 41 | 3 | 6 | 4 |
| Iowa | 337 | 111 | 87 | 9 | 10 | 4 | 0 | 1 | 225 | 207 | 12 | 6 | 0 | 0 | 1 |
| Minnesota | 334 | 130 | 91 | 16 | 12 | 7 | 0 | 4 | 202 | 176 | 19 | 7 | 1 | 1 | 0 |
| Missouri | 949 | 524 | 336 | 90 | 63 | 24 | 1 | 10 | 415 | 374 | 24 | 17 | 2 | 5 | 3 |
| North Dakota | 41 | 12 | 10 | 2 | 0 | 0 | 0 | 0 | 29 | 22 | 4 | 3 | 0 | 0 | 0 |
| South Dakota | 47 | 16 | 13 | 0 | 2 | 0 | 0 | 1 | 31 | 25 | 4 | 2 | 0 | 0 | 0 |
| Nebraska | 122 | 70 | 49 | 6 | 5 | 6 | 0 | 4 | 52 | 41 | 10 | 1 | 0 | 0 | 0 |
| Kansas | 231 | 120 | 95 | 12 | 9 | 1 | 0 | 3 | 111 | 95 | 11 | 5 | 0 | 0 | 0 |
| South Atlantic | 3,194 | 1,732 | 1,323 | 186 | 149 | 33 | 2 | 39 | 1,448 | 1,294 | 99 | 55 | 1 | 8 | 5 |
| Delaware | 60 | 25 | 17 | 4 | 2 | 1 | 0 | 1 | 35 | 34 | 0 | 1 | 0 | 0 | 0 |
| Maryland | 483 | 212 | 174 | 24 | 9 | 3 | 0 | 2 | 265 | 246 | 11 | 8 | 1 | 4 | |
| District of Columbia | 171 | 65 | 32 | 14 | 13 | 2 | 0 | 4 | 106 | 91 | 5 | 10 | 0 | 0 | 0 |
| Virginia | 273 | 135 | 101 | 19 | 11 | 1 | 0 | 3 | 137 | 122 | 14 | 1 | 0 | 0 | 1 |
| West Virginia | 269 | 173 | 125 | 25 | 15 | 3 | 2 | 3 | 94 | 79 | 11 | 4 | 0 | 1 | 1 |
| North Carolina | 417 | 232 | 223 | 7 | 2 | 0 | 0 | 0 | 184 | 168 | 9 | 7 | 0 | 0 | 1 |
| South Carolina | 150 | 95 | 84 | 6 | 3 | 0 | 0 | 2 | 55 | 49 | 5 | 1 | 0 | 0 | 0 |
| Georgia | 504 | 240 | 191 | 21 | 21 | 1 | 0 | 6 | 263 | 239 | 20 | 4 | 0 | 0 | 1 |
| Florida | 867 | 555 | 376 | 66 | 73 | 22 | 0 | 18 | 309 | 266 | 24 | 19 | 0 | 3 | 0 |
| East South Central | 1,449 | 842 | 670 | 115 | 31 | 10 | 0 | 16 | 600 | 522 | 44 | 34 | 2 | 3 | 2 |
| Kentucky | 358 | 176 | 141 | 21 | 4 | 1 | 0 | 9 | 179 | 150 | 18 | 11 | 2 | 1 | 0 |
| Tennessee | 615 | 397 | 320 | 52 | 16 | 5 | 0 | 4 | 214 | 182 | 20 | 12 | 0 | 2 | 2 |
| Alabama | 342 | 182 | 143 | 28 | 8 | 2 | 0 | 1 | 160 | 146 | 5 | 9 | 0 | 0 | 0 |
| Mississippi | 134 | 87 | 66 | 14 | 3 | 2 | 0 | 2 | 47 | 44 | 1 | 2 | 0 | 0 | 0 |
| West South Central | 1,940 | 1,142 | 845 | 179 | 76 | 32 | 1 | 9 | 783 | 676 | 64 | 43 | 0 | 2 | 13 |
| Arkansas | 221 | 122 | 104 | 15 | 0 | 3 | 0 | 0 | 99 | 88 | 10 | 1 | 0 | 0 | 0 |
| Louisiana | 356 | 229 | 132 | 61 | 25 | 9 | 0 | 2 | 123 | 106 | 7 | 10 | 0 | 0 | 4 |
| Oklahoma | 249 | 124 | 106 | 10 | 7 | 1 | 0 | 0 | 123 | 101 | 11 | 11 | 0 | 0 | 2 |
| Texas | 1,114 | 667 | 503 | 93 | 44 | 19 | 1 | 7 | 438 | 381 | 36 | 21 | 0 | 2 | 7 |
| Mountain | 1,253 | 748 | 508 | 118 | 81 | 27 | 0 | 14 | 495 | 408 | 60 | 27 | 1 | 2 | 7 |
| Montana | 109 | 62 | 49 | 6 | 3 | 2 | 0 | 2 | 47 | 32 | 8 | 7 | 0 | 0 | 0 |
| Idaho | 92 | 55 | 37 | 6 | 8 | 1 | 0 | 3 | 36 | 35 | 1 | 0 | 1 | 0 | 0 |
| Wyoming | 40 | 28 | 19 | 6 | 0 | 3 | 0 | 0 | 11 | 10 | 0 | 1 | 0 | 1 | 0 |
| Colorado | 440 | 278 | 188 | 46 | 30 | 11 | 0 | 3 | 160 | 125 | 27 | 8 | 0 | 0 | 2 |
| New Mexico | 155 | 96 | 67 | 23 | 3 | 1 | 0 | 2 | 57 | 49 | 7 | 1 | 0 | 0 | 2 |
| Arizona | 166 | 99 | 51 | 16 | 24 | 4 | 0 | 4 | 65 | 52 | 10 | 3 | 0 | 0 | 2 |
| Utah | 72 | 36 | 24 | 5 | 7 | 0 | 0 | 0 | 34 | 29 | 4 | 1 | 0 | 1 | 1 |
| Nevada | 179 | 94 | 73 | 10 | 6 | 5 | 0 | 0 | 85 | 76 | 3 | 6 | 0 | 0 | 0 |
| Pacific | 4,467 | 2,621 | 1,665 | 506 | 261 | 68 | 33 | 88 | 1,790 | 1,403 | 282 | 105 | 32 | 9 | 15 |
| Washington | 445 | 261 | 159 | 51 | 28 | 13 | 0 | 10 | 180 | 130 | 32 | 18 | 1 | 1 | 2 |
| Oregon | 288 | 139 | 90 | 24 | 20 | 1 | 1 | 3 | 137 | 104 | 21 | 12 | 10 | 0 | 2 |
| California | 3,500 | 2,138 | 1,355 | 422 | 204 | 53 | 32 | 72 | 1,331 | 1,040 | 216 | 75 | 18 | 6 | 7 |
| Alaska | 57 | 31 | 16 | 7 | 6 | 1 | 0 | 1 | 24 | 22 | 2 | 0 | 0 | 2 | 0 |
| Hawaii | 177 | 52 | 45 | 2 | 3 | 0 | 0 | 2 | 118 | 107 | 11 | 0 | 3 | 0 | 4 |
| Outlying areas | 492 | 251 | 195 | 43 | 10 | 0 | 0 | 3 | 223 | 207 | 9 | 7 | 13 | 1 | 4 |
| Puerto Rico | 467 | 239 | 190 | 38 | 8 | 0 | 0 | 3 | 210 | 196 | 7 | 7 | 13 | 1 | 4 |
| Virgin Islands | 25 | 12 | 5 | 5 | 2 | 0 | 0 | 0 | 13 | 11 | 2 | 0 | 0 | 1 | 0 |
- 1 See "Glossary" for definitions of terms.
- 2 The States are grouped according to the method used by the Bureau of the Census, U.S. Department of Commerce
793 of 794 figures sit in a row or column sum that works out. 4 cells break a sum: 'Maryland', column 2: prints 483, the subtotals in columns 3 to 16 add to 482; 'Virgin Islands', column 2: prints 25, the subtotals in columns 3 to 16 add to 26; 'Outlying areas', column 15: prints 1, rows 'Puerto Rico' to 'Virgin Islands' add to 2; 'South Atlantic', column 16: prints 5, rows 'Delaware' to 'Florida' add to 4.
Reader’s notes
p. 199. Crop scope: the table is cut off at the bottom after the "Maryland" row; the rest of the South Atlantic division and the remaining divisions continue on following pages, and no footnote texts appear on this image (so `footnotes` is empty even though markers ^1 on the caption and ^2 on the stub heading are printed). 16 columns: stub, "All cases", seven under the "Unfair labor practice cases" spanner (All C cases, CA, CB, CC, CD, CE, CP), four under "Representation cases" (All R cases, RC, RM, RD), and three tall single-column headings whose code letters UD, AC, UC are printed on a third heading level. Doubtful cells: - Maryland / UC (last column): the cell lies at the very bottom edge of the crop and no digit is legible, so it is transcribed as "". For the reader's information only (not written into the grid): the row's printed components 212 + 265 + 1 + 4 = 482 against a printed "All cases" of 483, which would imply a value of 1 there. - South Dakota / UC: a short horizontal mark (apparently a stray leader-dot/rule artifact) sits just left of the figure; the value is read as 0, consistent with the printed row and division totals. Arithmetic check: every other row's C-detail, R-detail, and grand totals, and every division subtotal against its member States, add exactly as printed. No suspected misprints.
p. 200. Continuation page: no column headings are printed on this crop, so header_rows is empty. The grid has 16 columns (stub + 15 data columns), counted from the column rules; the first seven rows (District of Columbia through Florida) are the tail of a regional group (South Atlantic) whose group line and earlier States are on the preceding page. Arithmetic cross-checks (data col 2 = cols 3-8; col 9 = cols 10-12; col 1 = cols 2 + 9 + 13 + 14 + 15; and each group line = the sum of its States) reconcile for every row and every column except one, noted below. These checks confirm the column assignment of every value. Doubtful cells: - Virgin Islands, 14th data column (second from right): the glyph reads as "1" and is transcribed as printed, but it is inconsistent both ways — the row sums to 26 against the printed total of 25, and Puerto Rico (1) + Virgin Islands (1) = 2 against the printed "Outlying areas" value of 1. Either this cell is a misprint for 0, or the "Outlying areas" cell in the same column is a misprint for 2; nothing else in the table disagrees. - Wyoming, 11th data column: the printed character is a broken/open glyph that looks like a "C"; transcribed as "0" (consistent with 10 + 0 + 1 = 11 in that row). - Alaska, 3rd data column: a small stray ink mark sits just left of "16"; it is not a footnote marker or a digit, and the value is transcribed as 16. - Footnote 2: the scan shows "U S. Department of Commerce"; the leading period of "U.S." is faint/broken and has been rendered as "U.S.". The footnote ends without a period, as printed.
Source image
Source data: U.S. NLRB Annual Reports (public domain). Reconstruction by NLRB Stats Archive. Read by claude-opus-5 (effort max, prompt extract_v1) from the 300-dpi scan; stitched by page. Updated October 2026.