NLRB Stats Archive › Annual Reports › FY1965 › Industrial distribution of cases received
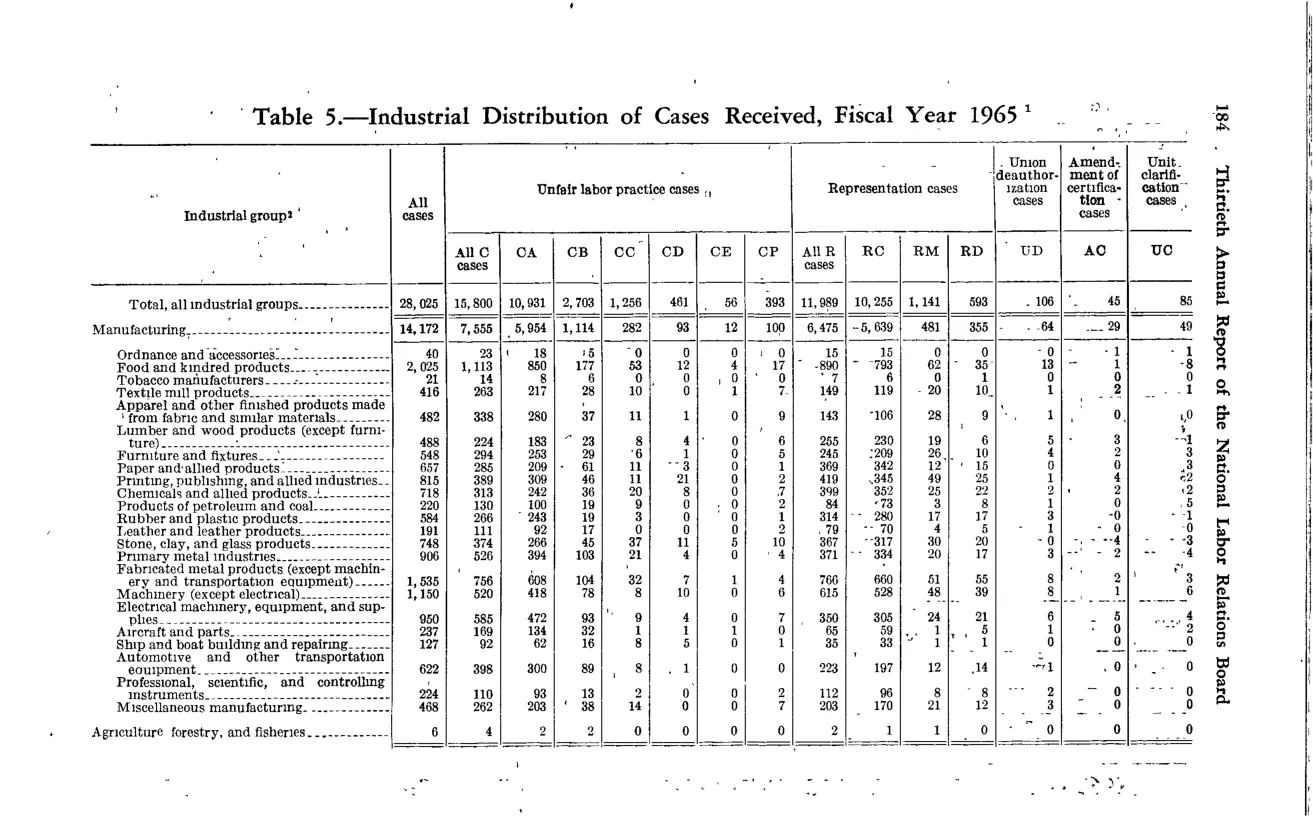
Industrial distribution of cases received
| Industrial group | All cases | Unfair labor practice cases | Unfair labor practice cases | Unfair labor practice cases | Unfair labor practice cases | Unfair labor practice cases | Unfair labor practice cases | Unfair labor practice cases | Representation cases | Representation cases | Representation cases | Representation cases | Union deauthorization cases | Amendment of certification cases | Unit clarification cases |
|---|---|---|---|---|---|---|---|---|---|---|---|---|---|---|---|
| All C cases | CA | CB | CC | CD | CE | CP | All R cases | RC | RM | RD | UD | AC | UC | ||
| Total, all industrial groups | 28,025 | 15,800 | 7,556 | 5,954 | 1,114 | 282 | 93 | 12 | 11,989 | 10,255 | 1,141 | 593 | 100 | 45 | 85 |
| Manufacturing | 14,172 | 7,555 | 5,954 | 1,114 | 282 | 93 | 12 | 6,475 | 5,639 | 481 | 355 | 64 | 29 | 49 | |
| Manufacturing sub-industries (Ordnance/accessories, Food/kindred, Tobacco, Textile mill products, Apparel/finished products from fabrics, Lumber/wood, Furniture/fixtures, Paper/allied products, Printing/publishing, Chemicals/allied products, Petroleum, Rubber/plastics, Leather, Stone/clay/glass, Primary metals, Fabricated metal, Machinery, Electrical, Transportation, Aircraft, Ship/boat, Automotive, Professional/scientific, Miscellaneous) | |||||||||||||||
| Agriculture, forestry, and fisheries |
Source image
Source data: U.S. NLRB Annual Reports (public domain). Reconstruction by NLRB Stats Archive. Updated June 2026.