NLRB Stats Archive › Annual Reports › FY1965 › Cases closed
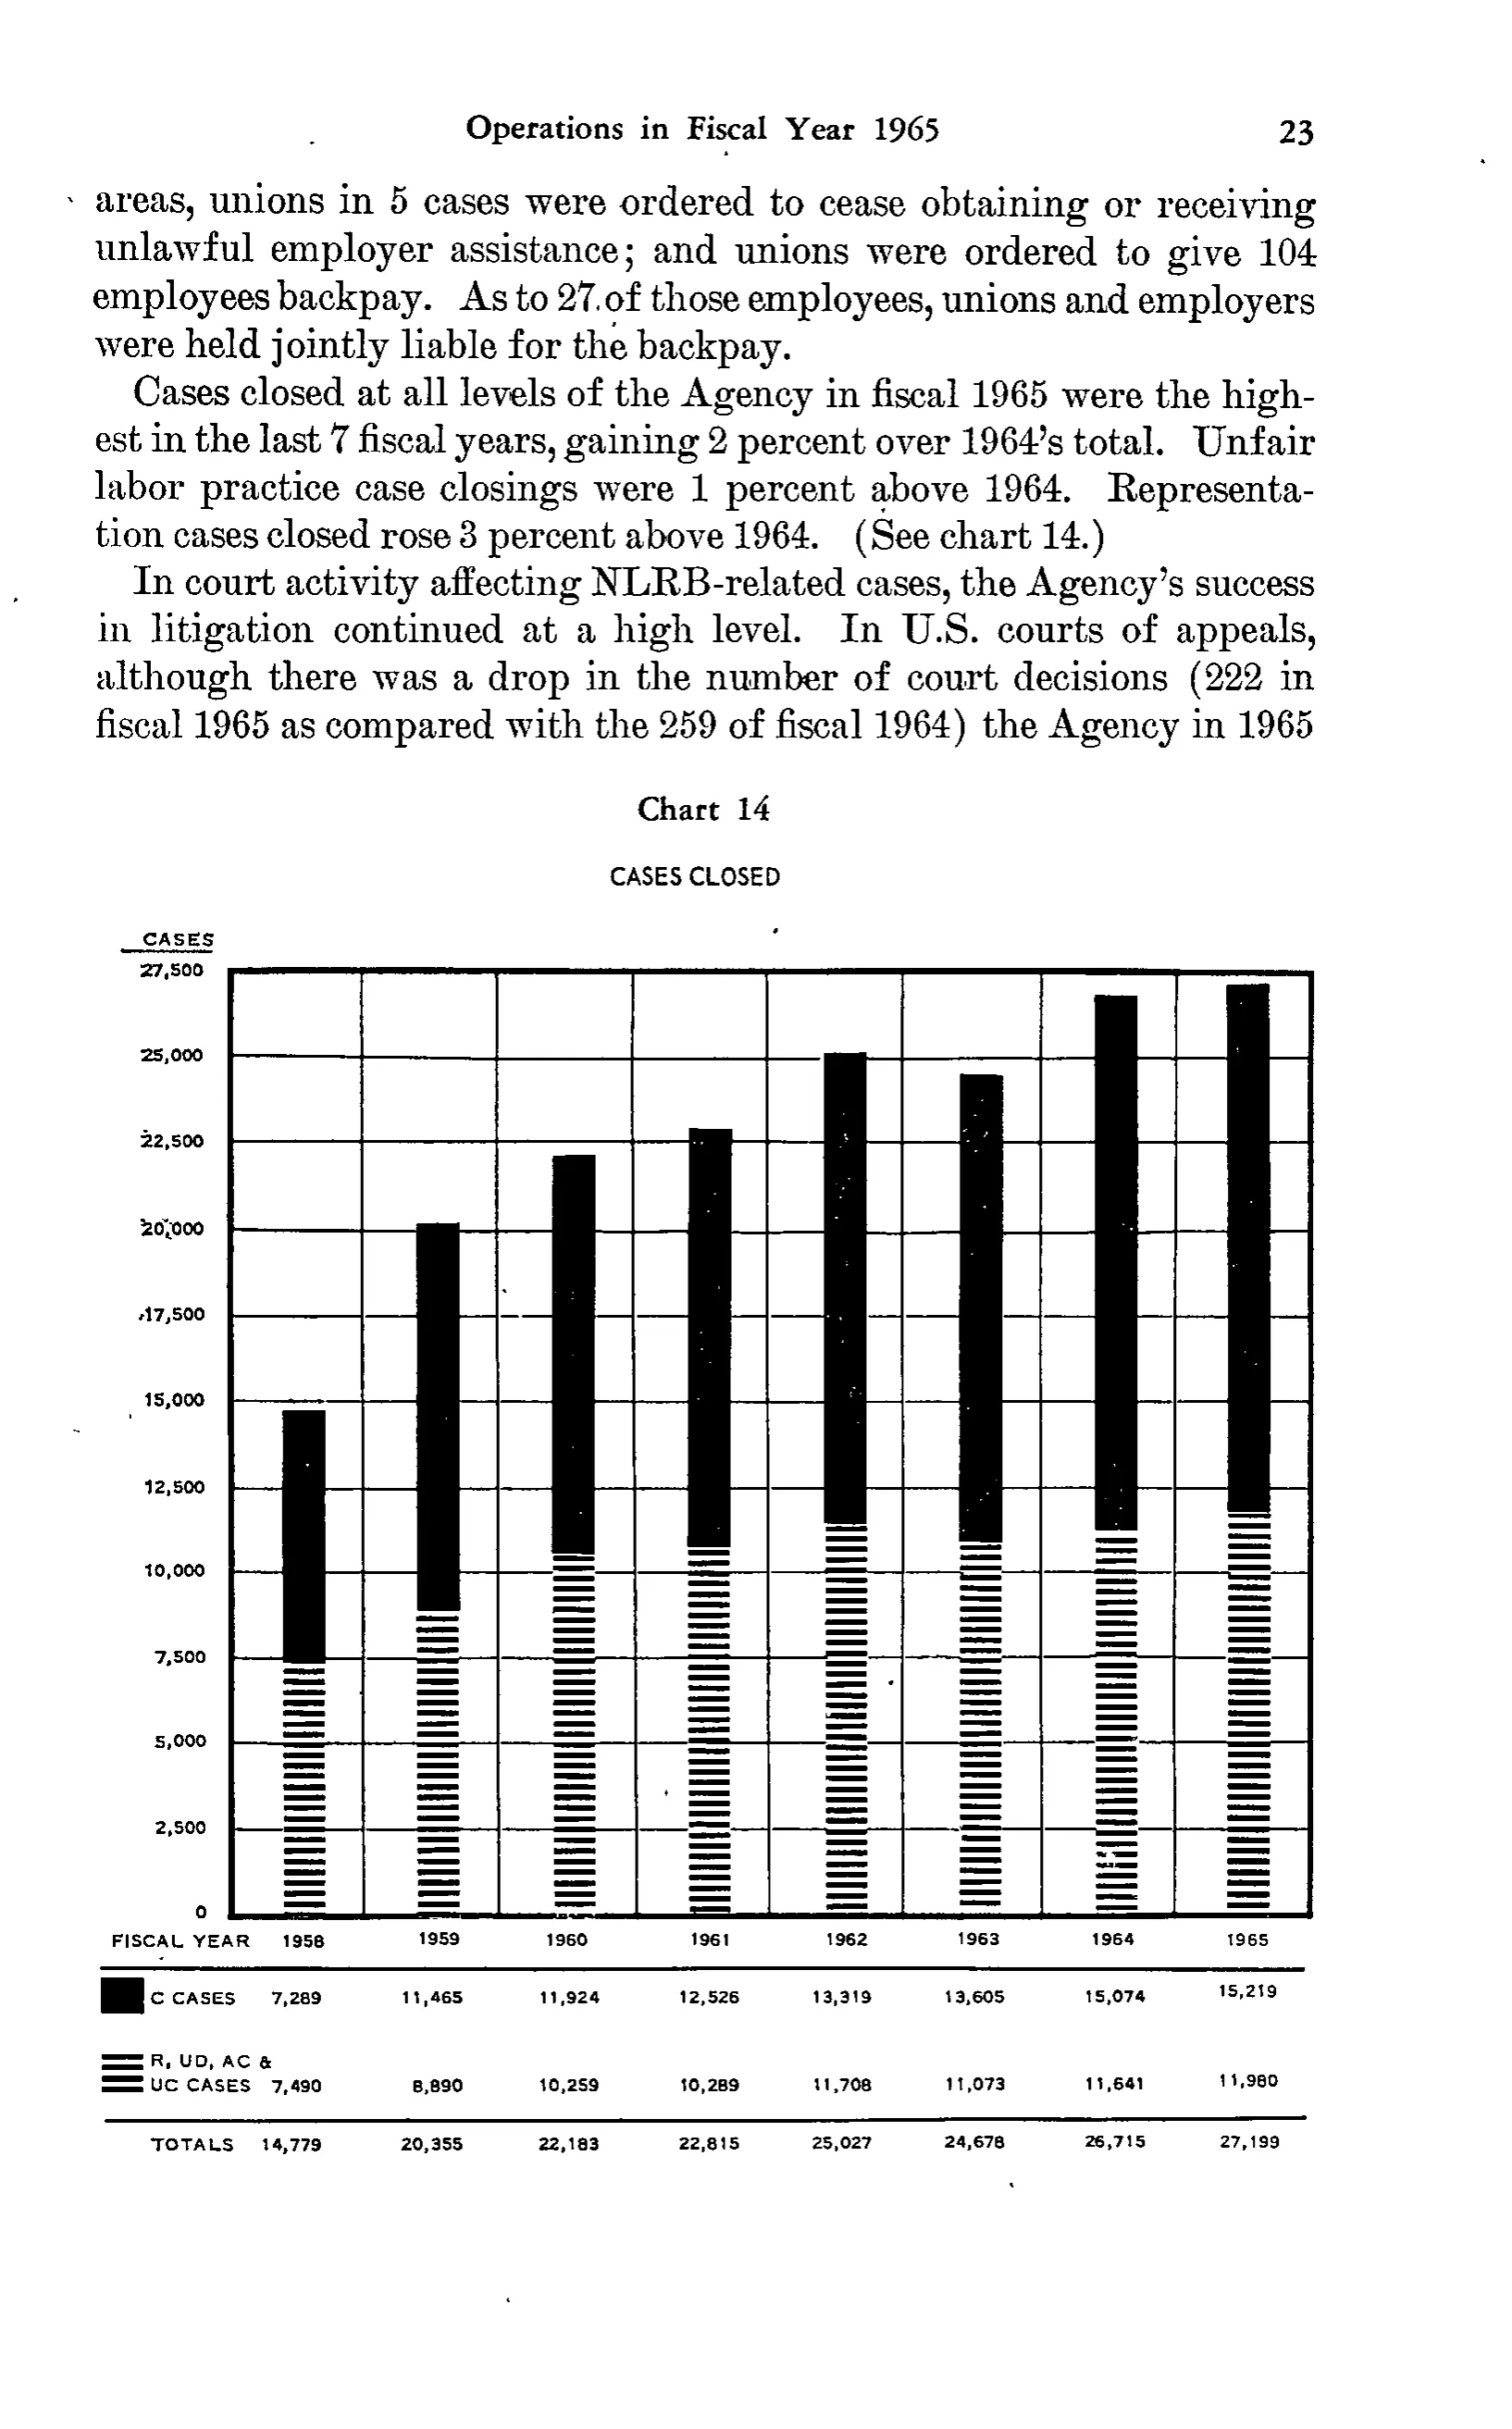
Cases closed
| FISCAL YEAR | 1958 | 1959 | 1960 | 1961 | 1962 | 1963 | 1964 | 1965 |
|---|---|---|---|---|---|---|---|---|
| C CASES | 7,289 | 11,465 | 11,924 | 12,526 | 13,319 | 13,605 | 15,074 | 15,219 |
| R, UD, AC & UC CASES | 7,490 | 8,890 | 10,259 | 10,289 | 11,708 | 11,073 | 11,641 | 11,980 |
| TOTALS | 14,779 | 20,355 | 22,183 | 22,815 | 25,027 | 24,678 | 26,715 | 27,199 |
24 of 24 figures sit in a row or column sum that works out.
Reader’s notes
p. 36. The crop is a full report page, not an isolated table: it contains narrative text at the top and then "Chart 14 / CASES CLOSED", a stacked bar chart. The only tabular matter is the data table printed under the chart's horizontal axis, which is what is transcribed here. Its column headings are the chart's fiscal-year axis labels (1958-1965), with "FISCAL YEAR" as the stub heading. The two data-row labels are each preceded by a printed pattern swatch (a solid black block for "C CASES", a horizontally striped block for "R, UD, AC & UC CASES") that keys the row to the bar segments; these are graphics, not footnote markers, and are omitted. The "R, UD, AC &" / "UC CASES" label wraps onto two printed lines and is joined into one. The chart's own y-axis scale labels (0 to 27,500, headed "CASES") belong to the plot area, not to the data table, and are not transcribed. All eight columns check out as C CASES plus R/UD/AC/UC CASES equalling the printed TOTALS; no printed value appears to be a misprint.
Source image
Source data: U.S. NLRB Annual Reports (public domain). Reconstruction by NLRB Stats Archive. Read by claude-opus-5 (effort max, prompt extract_v1) from the 300-dpi scan; stitched by page. Updated October 2026.