NLRB Stats Archive › Annual Reports › FY1965 › Board case backlog
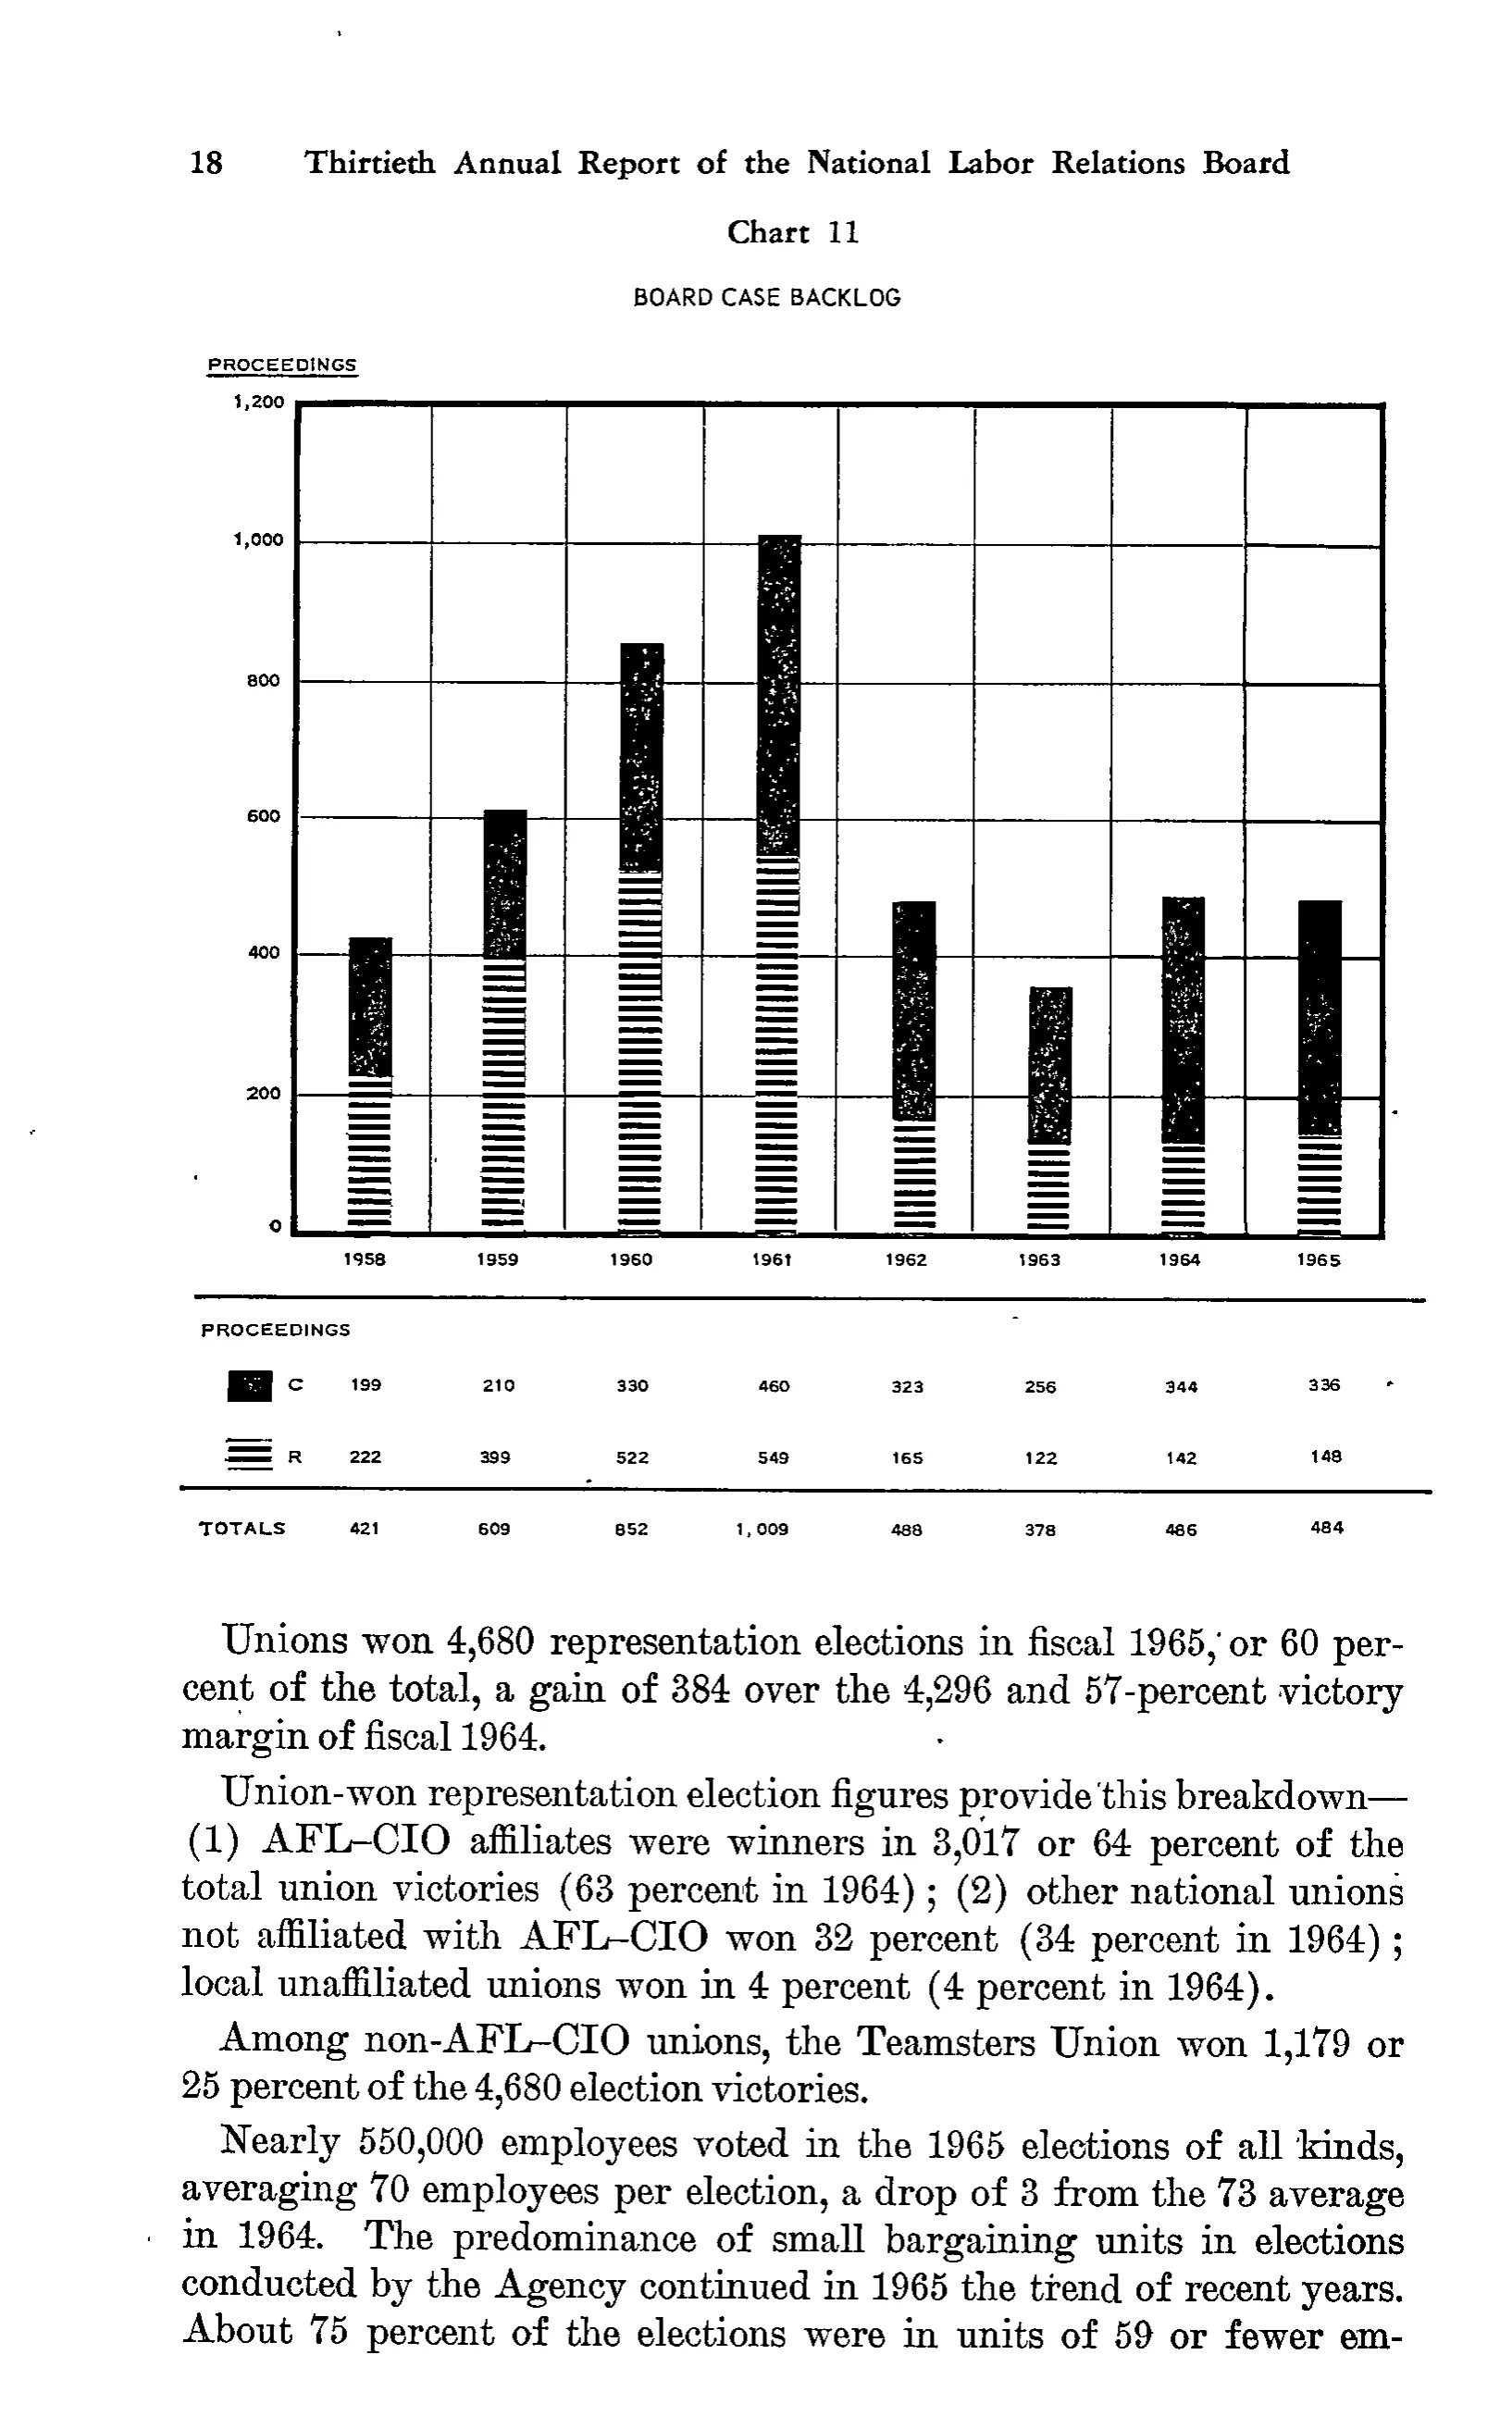
Board case backlog
| PROCEEDINGS | 1958 | 1959 | 1960 | 1961 | 1962 | 1963 | 1964 | 1965 |
|---|---|---|---|---|---|---|---|---|
| C | 199 | 210 | 330 | 460 | 323 | 256 | 344 | 336 |
| R | 222 | 399 | 522 | 549 | 165 | 122 | 142 | 148 |
| TOTALS | 421 | 609 | 852 | 1,009 | 488 | 378 | 486 | 484 |
24 of 24 figures sit in a row or column sum that works out.
Reader’s notes
p. 31. The crop is a bar chart (Chart 11, "BOARD CASE BACKLOG") with a small data table printed beneath the plot area; only that data table is transcribed. The year labels 1958-1965 are the chart's x-axis labels, printed just above the rule that opens the data panel, and they align exactly with the data columns, so they are used as the column headings. "PROCEEDINGS" printed at the left of the data panel is taken as the stub heading; a second "PROCEEDINGS" appears at the upper left of the chart as the y-axis unit label and is not part of the table. Each of the C and R row labels is preceded by a small shaded/striped legend swatch keying it to the bar segments; the swatches are graphics, not text, and are omitted. The TOTALS row is set off by a horizontal rule above it. In the TOTALS row the 1961 value is typeset with a space after the comma ("1, 009") and is written 1,009. Every column's C + R sums to the printed total. The running head, chart number, chart title and the body paragraphs below the chart are excluded.
Source image
Source data: U.S. NLRB Annual Reports (public domain). Reconstruction by NLRB Stats Archive. Read by claude-opus-5 (effort max, prompt extract_v1) from the 300-dpi scan; stitched by page. Updated October 2026.