NLRB Stats Archive › Annual Reports › FY1965 › Time required to process representation cases
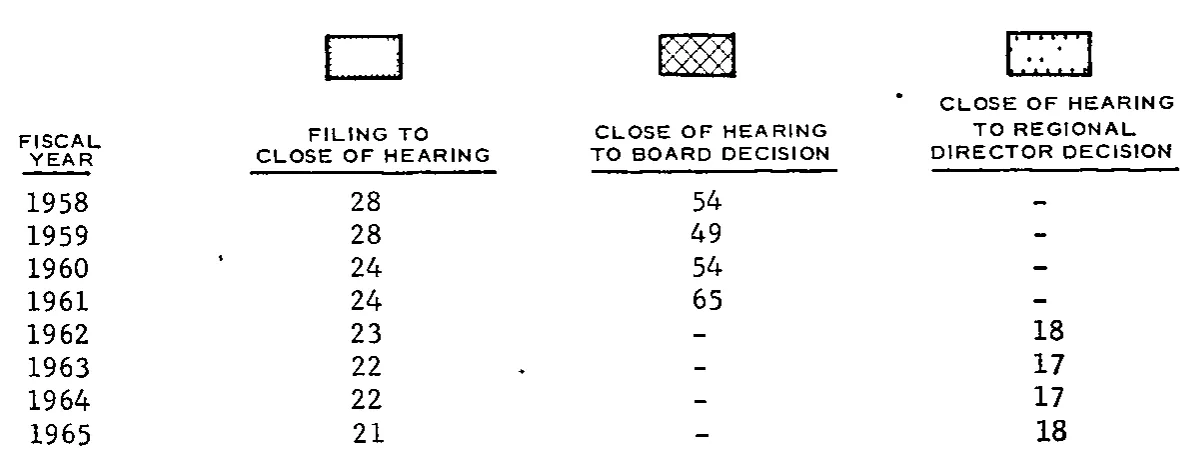
Time required to process representation cases
| FISCAL YEAR | FILING TO CLOSE OF HEARING | CLOSE OF HEARING TO BOARD DECISION | CLOSE OF HEARING TO REGIONAL DIRECTOR DECISION |
|---|---|---|---|
| 1958 | 28 | 54 | |
| 1959 | 28 | 49 | |
| 1960 | 24 | 54 | |
| 1961 | 24 | 65 | |
| 1962 | 23 | 18 | |
| 1963 | 22 | 17 | |
| 1964 | 22 | 17 | |
| 1965 | 21 | 18 |
0 of 16 figures sit in a row or column sum that works out.
Reader’s notes
p. 30. This is the data/legend table that accompanies a bar chart: a small shaded key box (open, cross-hatched, and stippled respectively) is printed above each of the three data-column headings. Those boxes are graphics, not text, so they are not transcribed. The single short dash printed in the last column for 1958-1961 and in the "Close of hearing to Board decision" column for 1962-1965 is rendered as an empty cell per the dash-rule convention; in the source it marks that the category did not apply in those years (Regional Director decisions began only after the 1961 delegation of authority). No footnotes, caption or page number fall inside the crop. All digits are clearly legible; no doubtful cells.
Source image
Source data: U.S. NLRB Annual Reports (public domain). Reconstruction by NLRB Stats Archive. Read by claude-opus-5 (effort max, prompt extract_v1) from the 300-dpi scan; stitched by page. Updated October 2026.