NLRB Stats Archive › Annual Reports › FY1965 › Unfair labor practice merit factor
Unfair labor practice merit factor
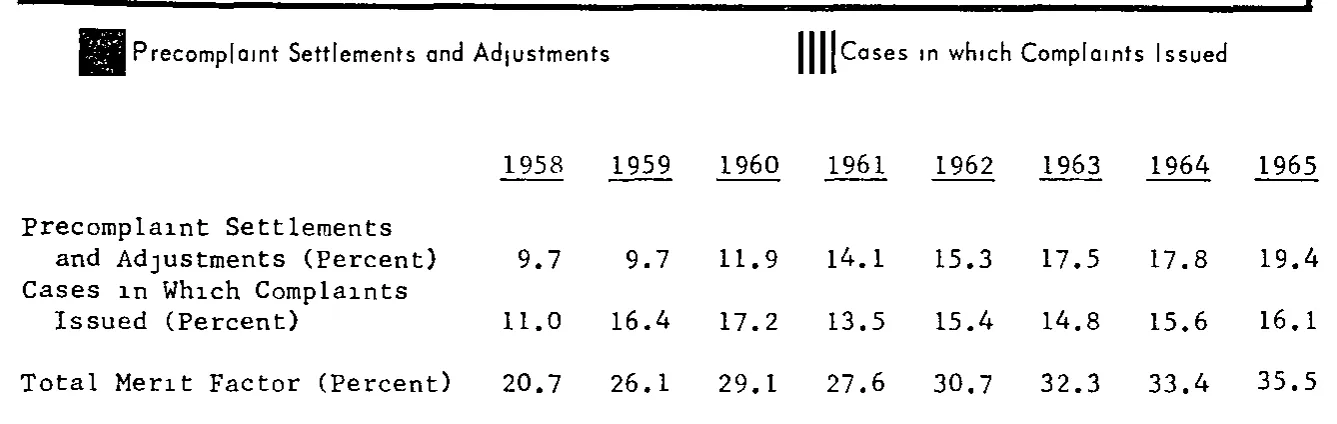
| 1958 | 1959 | 1960 | 1961 | 1962 | 1963 | 1964 | 1965 | |
|---|---|---|---|---|---|---|---|---|
| Precomplaint Settlements and Adjustments (Percent) | 9.7 | 9.7 | 11.9 | 14.1 | 15.3 | 17.5 | 17.8 | 19.4 |
| Cases in Which Complaints Issued (Percent) | 11.0 | 16.4 | 17.2 | 13.5 | 15.4 | 14.8 | 15.6 | 16.1 |
| Total Merit Factor (Percent) | 20.7 | 26.1 | 29.1 | 27.6 | 30.7 | 32.3 | 33.4 | 35.5 |
Reader’s notes
p. 25. The crop is the bottom portion of a chart page: above the table sit two shaded key patches with the legend text "Precomplaint Settlements and Adjustments" and "Cases in which Complaints Issued", which belong to the chart above (cut off by the crop), not to the table's column headings, so they are not included in header_rows. The only printed heading level is the row of underscored years 1958-1965; the stub column has no heading. The table is typewritten, so the digit 1 is struck as a lowercase l (e.g. "ll.0", "l6.4"); these are transcribed as 11.0, 16.4, etc. Every column is internally consistent as printed: rows 1 and 2 sum exactly to the Total Merit Factor in all eight years, which supports the digit readings. No footnotes are printed under the table.
Source image
Source data: U.S. NLRB Annual Reports (public domain). Reconstruction by NLRB Stats Archive. Read by claude-opus-5 (effort max, prompt extract_v1) from the 300-dpi scan; stitched by page. Updated October 2026.